Heiman G. Basic Statistics for the Behavioral Sciences
Подождите немного. Документ загружается.

308 CHAPTER 13 / The One-Way Analysis of Variance
Step 1 Find . Using the appropriate value of in the computations is what protects
the experiment-wise error for the number of means being compared. Find the value of
in Table 6 in Appendix C, entitled “Values of Studentized Range Statistic.” In the
table, locate the column labeled with the corresponding to the number of means in
your factor. Next, find the row labeled with the used to compute your . Then
find the value of for the appropriate .
For our study above, , , and , so .
Step 2 Compute the HSD.
q
k
5 3.77 5 .05df
wn
5 12k 5 3
q
k
F
obt
df
wn
k
q
k
q
k
q
k
is from the ANOVA, and is the number of scores in each level of the factor.
In the example, was 7 and was 5, so
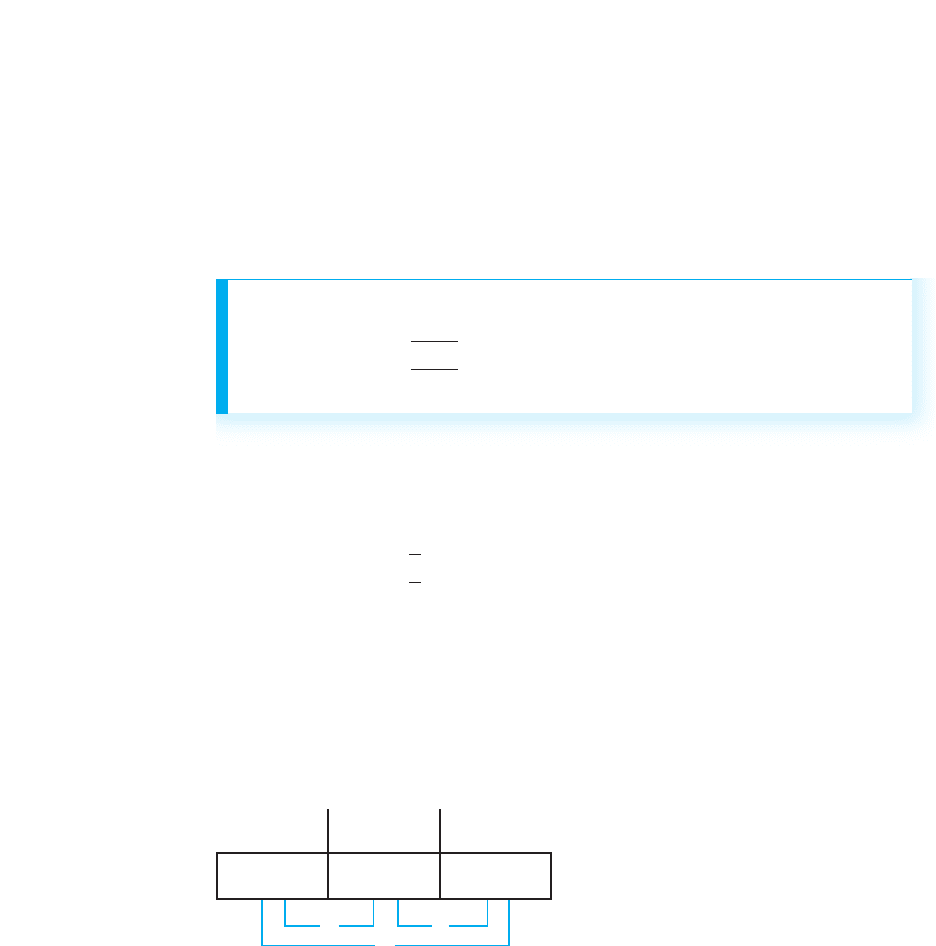
Step 3 Determine the differences between each pair of means. Subtract each mean
from every other mean. Ignore whether differences are positive or negative (for each
pair, this is a two-tailed test of ).
The differences for the perceived difficulty study can be diagramed as shown
below:
Perceived Difficulty
Easy Medium Difficult
X
苶
1
8 X
苶
2
6 X
苶
3
3
23
5
HSD 4.46
On the line connecting any two levels is the absolute difference between their means.
Step 4 Compare each difference to the HSD. If the absolute difference between two
means is greater than the HSD, then these means differ significantly. (It’s as if you per-
formed a -test on these means and was significant.) If the absolute difference
between two means is less than or equal to the HSD, then it is not a significant differ-
ence (and would not produce a significant ).
Above, the HSD was 4.46. The means from the easy level (8) and the difficult level
(3) differ by more than 4.46, so they differ significantly. The mean from the medium
level (6), however, differs from the other means by less than 4.46, so it does not differ
significantly from them.
t
obt
t
obt
t
H
0
:
1
2
2
5 0
HSD 5 13.772a
B
7
5
b5 4.46
nMS
wn
nMS
wn
The formula for Tukey’s HSD test is
HSD 5 1q
k
2a
B
MS
wn
n
b

Summary of Steps in Performing a One-Way ANOVA 309
■
Perform post hoc comparisons when is signifi-
cant to determine which levels differ significantly.
■
Perform Tukey’s HSD test when all are equal and
Fisther’s -test when are unequal.
MORE EXAMPLES
An is significant, with , , and
and , , and .
To compute Fisher’s -test on and ,
and These means do not
differ significantly.
To compute Tukey’s HSD, find For and
, . Then:
HSD 5 1q
k
2a
B
MS
wn
n
b5 13.492a
B
20.61
11
b5 4.78
q
k
5 3.49df
wn
5 30
k 5 3q
k
.
t
crit
5 ;2.042.t
obt
521.446
5
22.8
13.75
t
obt
5
X
1
2 X
2
B
MS
wn
a
1
n
1
1
1
n
2
b
5
4.0 2 6.8
B
20.61 a
1
11
1
1
11
b
X
3
X
1
t
df
wn
5 30MS
wn
5 20.61n 5 11X
3
5 6.8
X
2
5 1.5X
1
5 4.0F
obt
nst
ns
F
obt
The differences are ;
;
Comparing each difference to ,
only and differ significantly.
For Practice
We have , , and ,
with in each condition, , and
.
1. Which post hoc test should we perform?
2. What is here?
3. What is the HSD?
4. Which means differ significantly?
Answers
1. Tukey’s HSD
2. For and ,
3.
4. Only and differ significantly.X
3
X
1
HSD 5 13.4021163.44>2125 5.91
q
k
5 3.40.df
wn
5 60k 5 3
q
k
df
wn
5 60
MS
wn
5 63.44n 5 21
X
3
5 8.92X
2
5 11.50X
1
5 16.50
X
3
X
2
HSD 5 4.785 22.8.
X
1
2 X
3
5 4.0 2 6.8X
2
2 X
3
5 1.5 2 6.8 525.3
X
1
2 X
2
5 4.0 2 1.5 5 2.5
A QUICK REVIEW
SUMMARY OF STEPS IN PERFORMING A ONE-WAY ANOVA
It’s been a long haul, but here is everything we do when performing a one-way,
between-subjects ANOVA.
1. Create the hypotheses. The null hypothesis is , and the
alternative hypothesis is : not all are equal.
2. Compute . Compute the sums of squares and the degrees of freedom. Then
compute and Then compute .
3. Compare to Find , using and If is larger than ,
then is significant, indicating that the means in at least two conditions differ
significantly.
F
obt
F
crit
F
obt
df
wn
.df
bn
F
crit
F
crit
.F
obt
F
obt
MS
wn
.MS
bn
F
obt
sH
a
H
0
:
1
5
2
5 . . .
k
Thus, our final conclusion about this study is that we demonstrated a relationship
between scores and perceived difficulty, but only for the easy and difficult conditions. If
these two conditions were given to the population, we would expect to find one
population for easy with a around 8 and another population for difficult with a
around 3. We cannot say anything about the medium level, however, because it did not
produce a significant difference. Finally, as usual, we would now interpret the results in
terms of the behaviors being studied, explaining why this manipulation worked as it did.

310 CHAPTER 13 / The One-Way Analysis of Variance
4. Perform post hoc tests. If is significant and there are more than two levels of
the factor, determine which levels differ significantly by performing post hoc
comparisons. Perform Fisher’s -test if the ns are not equal or perform Tukey’s
HSD test if all are equal.
If you followed all of that, then congratulations, you’re getting good at this stuff. Of
course, all of this merely determines whether there is a relationship. Now you must
describe that relationship.
ADDITIONAL PROCEDURES IN THE ONE-WAY ANOVA
The following presents procedures for describing a significant relationship that we have
discussed in previous chapters, except that here they have been altered to accommodate
the computations in ANOVA.
The Confidence Interval for Each Population
As usual, we can compute a confidence interval for the represented by the mean of any
condition. This is the same confidence interval for that was discussed in Chapter 11,
but the formula is slightly different.
ns
t
F
obt
The is the two-tailed value found in the -tables using the appropriate and using
from the ANOVA as the is also from the ANOVA. The and are from
the level we are describing.
For example, in the easy condition, , , , and .
The two-tailed (at and ) is Thus,
This becomes
and finally,
Thus, if we were to test the entire population under our easy condition, we are 95%
confident that the population mean would fall between 5.42 and 10.58.
Follow the same procedure to describe the from any other significant level of the
factor.
5.42 # # 10.58
122.57821 8.0 # # 112.57821 8.0
a
B
7.0
5
b122.17921 8.0 # # a
B
7.0
5
b112.17921 8.0
;2.179. 5 .05df 5 12t
crit
n 5 5df
wn
5 12MS
wn
5 7.0X 5 8.0
nXMS
wn
df.df
wn
tt
crit
The formula for the confidence interval for a single is
a
B
MS
wn
n
b12t
crit
21 X # # a
B
MS
wn
n
b11t
crit
21 X
Additional Procedures in the One-Way ANOVA 311
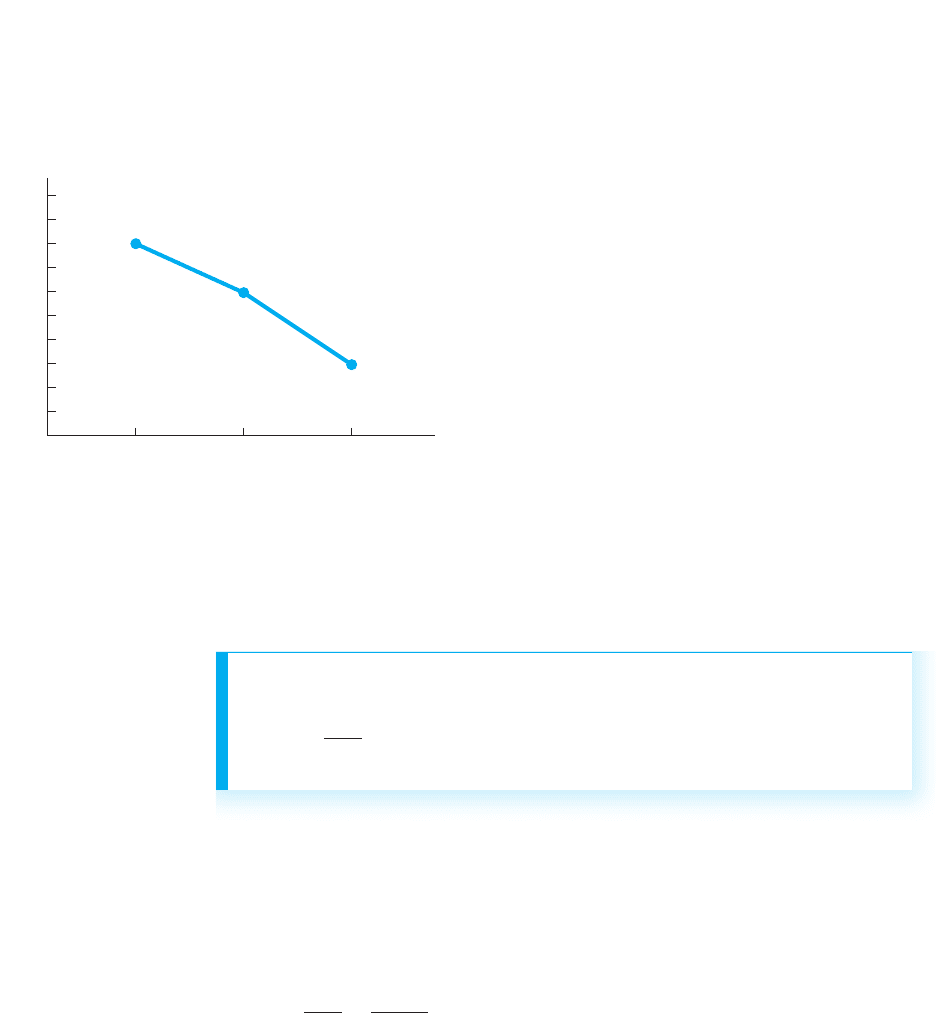
FIGURE 13.2
Mean number of
problems correctly
solved as a function of
perceived difficulty
Graphing the Results in ANOVA
As usual, graph your results by placing the dependent variable on the axis and the
independent variable on the axis. Then plot the mean for each condition. Figure 13.2
shows the line graph for the perceived difficulty study. Note that we include the
medium level of difficulty, even though it did not pro-
duce significant differences.
As usual, the line graph summarizes the relationship
that is present, and here it indicates a largely negative
linear relationship.
Describing Effect Size in
the ANOVA
Recall that in an experiment we describe the effect
size, which tells us how large of an impact the inde-
pendent variable had on dependent scores. The way to
do this is to compute the proportion of variance
accounted for, which tells us the proportional improve-
ment in predicting participants’ scores that we achieve
by predicting the mean of their condition. In ANOVA,
we compute this by computing a new correlation coefficient, called eta (pronounced
“ay-tah”), and then squaring it: eta squared indicates the proportion of variance in the
dependent variable that is accounted for by changing the levels of a factor in an
ANOVA. The symbol for eta squared is .
2
X
Y
Both and are computed in the ANOVA. The reflects the differences
between the conditions. The reflects the total differences between all scores in the
experiment. Thus, reflects the proportion of all differences in scores that are associ-
ated with the different conditions.
For example, for our study, was 63.33 and was 147.33. So,
This is interpreted in the same way that we previously interpreted The larger
the , the more consistently the factor “caused” participants to have a particular
score in a particular condition, and thus the more scientifically important the factor is
for explaining and predicting differences in the underlying behavior. Thus, our
of .43 indicates that we are 43% more accurate at predicting participants’ scores
when we predict for them the mean of the difficulty level they were tested under. In
other words, 43% of all differences in these scores are accounted for (“caused”) by
2
2
r
2
pb
.
2
5
SS
bn
SS
tot
5
63.33
147.33
5 .43
SS
tot
SS
bn
2
SS
tot
SS
bn
SS
tot
SS
bn
0
10
9
8
7
6
5
4
3
2
1
Easy
Perceived difficulty
Medium Difficult
Mean problems correct
The formula for eta squared is
2
5
SS
bn
SS
tot

When all is said and done, the -ratio is a convoluted way of measuring the differences
between the means of our conditions and then fitting those differences to a sampling
distribution. The larger the , the less likely that the means are representing the same
. A significant indicates that the means are unlikely to represent one population
mean. Then we determine which sample means actually differ significantly and
describe the relationship they form. That’s all there is to it.
There is, however, one other type of procedure that you should be aware of. All of
the research designs in this book involve one dependent variable, and the statistics we
perform are called univariate statistics. We can, however, measure participants on two
or more dependent variables in one experiment. Statistics for multiple dependent vari-
ables are called multivariate statistics. These include the multivariate -test and the
multivariate analysis of variance (MANOVA). Even though these are very complex
procedures, the basic logic still holds: The larger the or , the less likely it is that
the samples represent no relationship in the population. To discuss multivariates further
would require another book.
Using the SPSS Appendix As discussed in Appendix B.7, SPSS will perform the
one-way between-subjects ANOVA. This includes reporting the significance level of
F
obt
t
obt
t
F
obt
F
obt
F
PUTTING IT
ALL TOGETHER
312 CHAPTER 13 / The One-Way Analysis of Variance
changing the levels of perceived difficulty. Because 43% is a very substantial
amount, this factor is important in determining participants’ performance, so it is
important for scientific study.
Recall that our other measure of effect size is Cohen’s , which describes the magni-
tude of the differences between our means. However, with three or more levels, the pro-
cedure is extremely complicated. Therefore, instead, is the preferred measure of
effect size in ANOVA.
STATISTICS IN PUBLISHED RESEARCH: REPORTING ANOVA
In research reports, the results of an ANOVA are reported in the same ways as with pre-
vious procedures. However, now we are getting to more complicated designs, so there
is an order and logic to the report. Typically, we report the means and standard devia-
tion from each condition first. (Rather than use an incredibly long sentence for this,
often a table is presented.) Then we describe the characteristics of the primary ANOVA
and report the results. Then we report any secondary procedures. Thus, for our per-
ceived difficulty study, you might see:
“A one-way, between-subjects ANOVA was performed on the scores from
the three levels of perceived difficulty. The results were significant,
, p< A Tukey HSD test revealed that only the means for
the easy and difficult conditions differed significantly (p< ). This
manipulation accounted for .43 of the variance in scores (using ). The
95% confidence interval for the easy condition is . . .”
Notice that for , we report and then We also indicate that the Tukey
test was performed, although usually the HSD value is not reported. The alpha
level we used is reported (as ), as is a summary of the levels that differ sig-
nificantly. Then we report other secondary analyses, such as and confidence
intervals.
2
p 6 .05
df
wn
.df
bn
F
obt
2
.05
.05F121225 4.52
2
d

Chapter Summary 313
, performing the HSD test, and graphing the means. The program also computes,
the , , and 95% confidence interval for for each level. It does not compute .
(The “partial eta squared” is not what we’ve discussed.
Appendix B.11 describes using SPSS to perform the one-way, within-subjects
ANOVA (discussed in Appendix A.3). The program provides the same information as
above, except that it does not perform the HSD test.
CHAPTER SUMMARY
1. The general terms used previously and their corresponding ANOVA terms are
shown in this table:
General Term ⴝ ANOVA Term
independent variable ⫽ factor
condition ⫽ level of treatment
sum of squared deviations ⫽ sum of squares (SS)
variance (s
2
X
) ⫽ mean square (MS)
effect of independent variable ⫽ treatment effect
2. A one-way analysis of variance tests for significant differences between the
means from two or more levels of a factor. In a between-subjects factor, each
condition involves an independent sample. In a within-subjects factor, the
conditions involve related samples.
3. The experiment-wise error rate is the probability that a Type I error will occur in
an experiment. ANOVA keeps the experiment-wise error rate equal to
4. ANOVA tests the that all being represented are equal; is that not all
are equal.
5. The mean square within groups ( ), measures the differences among the
scores within the conditions. The mean square between groups , measures
the differences among the level means.
6. When is true, and estimate the error variance. When is false,
also reflects added treatment variance.
7. is computed using the -ratio, which equals the mean square between groups
divided by the mean square within groups.
8. may be greater than 1 because either (a) there is no treatment effect, but the
sample data are not perfectly representative of this, or (b) two or more sample
means represent different population means.
9. If is significant with more than two levels, perform post hoc comparisons to
determine which means differ significantly. When the are not equal, perform
Fisher’s protected -test on each pair of means. If all are equal, perform Tukey’s
HSD test.
10. Eta squared describes the effect size—the proportion of variance in depen-
dent scores accounted for by the levels of the independent variable.
1
2
2
nst
ns
F
obt
F
obt
FF
obt
MS
bn
H
0
MS
bn
MS
wn
H
0
1MS
bn
2
MS
wn
sH
a
sH
0
␣.
2
s
X
X
F
obt

314 CHAPTER 13 / The One-Way Analysis of Variance
KEY TERMS
HSD
analysis of variance 292
ANOVA 290
between-subjects ANOVA 291
between-subjects factor 291
error variance 298
eta squared 311
experiment-wise error rate 293
factor 290
-distribution 304
Fisher’s protected -test 307
-ratio 297
level 290
F
t
F
SS
wn
SS
bn
2
df
wn
df
bn
σ
2
treat
MS
bn
σ
2
error
MS
wn
F
crit
F
obt
k
mean square 295
mean square between groups 295
mean square within groups 295
multivariate statistics 312
one-way ANOVA 291
post hoc comparisons 294
sum of squares 295
treatment 290
treatment effect 290
treatment variance 298
Tukey’s HSD multiple comparisons
test 307
univariate statistics 312
within-subjects ANOVA 291
within-subjects factor 291
REVIEW QUESTIONS
(Answers for odd-numbered questions are in Appendix D.)
1. What does each of the following terms mean? (a) ANOVA (b) one-way design
(c) factor (d) level (e) treatment (f) between subjects (g) within subjects
2. (a) What is the difference between and ? (b) What does stand for?
3. What are two reasons for conducting a study with more than two levels of a
factor?
4. (a) What are error variance and treatment variance? (b) What are the two types of
mean squares, and what does each estimate?
5. (a) What is the experiment-wise error rate? (b) Why does ANOVA solve the prob-
lem with the experiment-wise error rate created by multiple -tests?
6. Summarize the steps involved in analyzing an experiment when
7. (a) When is it necessary to perform post hoc comparisons? Why? (b) When is it
unnecessary to perform post hoc comparisons?
8. When do you use each of the two post hoc tests discussed in this chapter?
9. What does indicate?
10. (a) Why should equal 1 if the data represent the situation? (b) Why is
greater than 1 when the data represent the situation? (c) What does a
significant indicate about differences between the levels of a factor?
11. A research article reports the results of a “multivariate” analysis. What does this
term communicate about the study?
APPLICATION QUESTIONS
12. A researcher conducts an experiment with three levels of the independent
variable. (a) Which two versions of a parametric procedure are available to her?
(b) How does she choose between them?
13. (a) In a study comparing four conditions, what is for the ANOVA? (b) What is
in the same study? (c) Describe in words what and say for this study.H
a
H
0
H
a
H
0
F
obt
H
a
F
obt
H
0
F
obt
2
k 7 2.
t
kNn

Application Questions 315
14. Foofy obtained a significant from an experiment with five levels. She
therefore concludes that changing each condition of the independent variable
results in a significant change in the dependent variable. (a) Is she correct? Why
or why not? (b) What must she now do?
15. (a) Poindexter computes an of .63. How should this be interpreted? (b) He
computes another of How should this be interpreted?
16. A report says that the between-subjects factor of participants’ salary produced sig-
nificant differences in self-esteem. (a) What does this tell you about the design?
(b) What does it tell you about the results?
17. A report says that a new diet led to a significant decrease in weight for a group of
participants. (a) What does this tell you about the design? (b) What do we call this
design?
18. A researcher investigated the number of viral infections people contract as a
function of the amount of stress they experienced during a 6-month period.
She obtained the following data:
Amount of Stress
Negligible Minimal Moderate Severe
Stress Stress Stress Stress
2465
1357
4278
1354
(a) What are and ? (b) Compute and complete the ANOVA summary
table. (c) With what is ? (d) Report your statistical results. (e) Perform
the appropriate post hoc comparisons. (f) What do you conclude about this study?
(g) Describe the effect size and interpret it. (h) Estimate the value of that is likely
to be found in the severe stress condition.
19. Here are data from an experiment studying the effect of age on creativity scores:
Age 4 Age 6 Age 8 Age 10
3997
51112 7
714 9 6
410 8 4
310 9 5
(a) Compute and create an ANOVA summary table. (b) With what
do you conclude about ? (c) Perform the appropriate post hoc comparisons.
What should you conclude about this relationship? (d) Statistically, how important
is the relationship in this study? (e) Describe how you would graph these results.
20. In a study in which , , , , and , you
compute the following sums of squares:
Source Sum of Squares df Mean Square F
Between 147.32
㛬㛬㛬㛬㛬㛬 㛬㛬㛬㛬㛬㛬 㛬㛬㛬㛬㛬㛬
Within 862.99 㛬㛬㛬㛬㛬㛬 㛬㛬㛬㛬㛬㛬
Total 1010.31 㛬㛬㛬㛬㛬㛬
X
3
5 8.2X
2
5 16.9X
1
5 45.3n 5 21k 5 3
F
obt
5 .05,F
obt
F
crit
5 .05,
F
obt
H
a
H
0
21.7.F
obt
F
obt
F
obt

316 CHAPTER 13 / The One-Way Analysis of Variance
(a) Complete the ANOVA summary table. (b) With , what do you conclude
about ? (c) Report your results in the correct format. (d) Perform the appropri-
ate post hoc comparisons. What do you conclude about this relationship? (e) What
is the effect size in this study, and what does this tell you about the influence of the
independent variable?
21. Performing ANOVA protects our experimentwise error rate. (a) Name and explain
the error that this avoids. (b) Why is this an important error to avoid?
22. A researcher investigated the effect of volume of background noise on partici-
pants’ accuracy rates while performing a boring task. He tested three groups
of randomly selected students and obtained the following means and sums of
squares:
Low Volume Moderate Volume High Volume
X
苶
61.5 65.5 48.25
n 457
Source Sum of Squares df Mean Square F
Between groups 652.16
㛬㛬㛬㛬㛬㛬 㛬㛬㛬㛬㛬㛬 㛬㛬㛬㛬㛬㛬
Within groups 612.75 㛬㛬㛬㛬㛬㛬 㛬㛬㛬㛬㛬㛬
Total 1264.92 㛬㛬㛬㛬㛬㛬
(a) Complete the ANOVA (b) At , what is ? (c) Report the statistical results
in the proper format. (d) Perform the appropriate post hoc tests. (e) What do you con-
clude about this study? (f) Compute the effect size and interpret it.
INTEGRATION QUESTIONS
23. (a) How do we create related samples? (b) In part (a) what two inferential proce-
dures are appropriate? (c) How do we create independent samples? (d) In part
(c) what two inferential procedures are appropriate? (Chs. 12, 13)
24. (a) In this chapter we tested the relationship between performance scores and
perceived difficulty. Describe this relationship using “as a function of.”
(b) An experimenter computes the mean anxiety level for samples of freshmen,
sophomores, juniors, and seniors. To graph these results, how would you label
the axes? (c) Would this be a bar or line graph and why? (Chs. 2, 4)
25. (a) How is h similar to ? (b) How do we interpret this proportion? (Chs. 12, 13)
26. (a) Name and explain the error that power prevents. (b) Why is it important to
maximize the power of any experiment? (c) How is this done in a design using
ANOVA? (d) How does influencing the differences between and within conditions
influence the size of and its likelihood of being significant? (Chs. 10, 11, 13)
27. (a) How do you identify which variable in a study is the factor? (b) How do you
identify the levels of a factor? (c) How do you identify the variable that is the
dependent variable? (Chs. 2, 13)
28. For the following, identify the inferential procedure to perform and the key infor-
mation for answering the research question. Note: If no inferential procedure is
appropriate, indicate why. (a) Doing well in statistics should reduce students’
F
obt
r
2
pb
2
F
crit
5 .05
F
obt
5 .05

Integration Questions 317
math phobia. We measure their math phobia after selecting groups who received
either an A, B, C, or D in statistics. (b) To determine if recall is better or worse
than recognition, participants study a list of words, and then half of them recall
the words and the other half performs a recognition test. (c) We repeatedly test the
aggressiveness of rats after 1, 3, 5 and 7 weeks, to see if they become more
aggressive as they grow older. (d) Using the grades of 100 students, we want to
use students’ score on the first exam to predict their final exam grade. (e) We test
for gender differences in voting history by counting the number of males and
females who voted in the last election. (f) We ask if pilots are quicker than naviga-
tors, comparing the reaction time of a group of pilots to that of their navigators.
(Chs. 7, 8, 10, 12, 13)
29. In question 28, identify the levels of the factor and the dependent variable in
experiments, and the predictor/criterion variables in correlational studies.
(Chs. 8, 12, 13)
■ ■ ■ SUMMARY OF
FORMULAS
The format for the summary table for a one-way
ANOVA is
Summary Table of One-Way ANOVA
Source Sum of Squares df Mean Square F
Between SS
bn
df
bn
MS
bn
F
obt
Within SS
wn
df
wn
MS
wn
Total SS
tot
df
tot
1. To perform the one-way, between-subjects
ANOVA
a. Compute the sum of squares,
b. Compute the mean squares,
df
wn
5 N 2 kMS
wn
5
SS
wn
df
wn
df
bn
5 k 2 1MS
bn
5
SS
bn
df
bn
SS
wn
5 SS
tot
2 SS
bn
2 a
1©X
tot
2
2
N
b
SS
bn
5 © a
1Sum of scores in the column2
2
n of scores in the column
b
SS
tot
5 ©X
2
tot
2 a
1©X
tot
2
2
N
b
c. Compute the -ratio
2. The formula for the protected -test is
Use the two-tailed for
3. The formula for the HSD is
Values of are found in Appendix C, Table 6.
4. The formula for the confidence interval for is
Use the two-tailed for
5. The formula for eta squared is
2
5
SS
bn
SS
tot
df 5 df
wn
.t
crit
a
B
MS
wn
n
b12t
crit
21 X # # a
B
MS
wn
n
b11t
crit
21 X
q
k
HSD 5 1q
k
2a
B
MS
wn
n
b
df 5 df
wn
.t
crit
t
obt
5
X
1
2 X
2
B
MS
wn
a
1
n
1
1
1
n
2
b
t
F
obt
5
MS
bn
MS
wn
F