Heiman G. Basic Statistics for the Behavioral Sciences
Подождите немного. Документ загружается.

278 CHAPTER 12 / The Two-Sample t-Test
f
μ
D
DD DDDDD
0
DD DDDDD
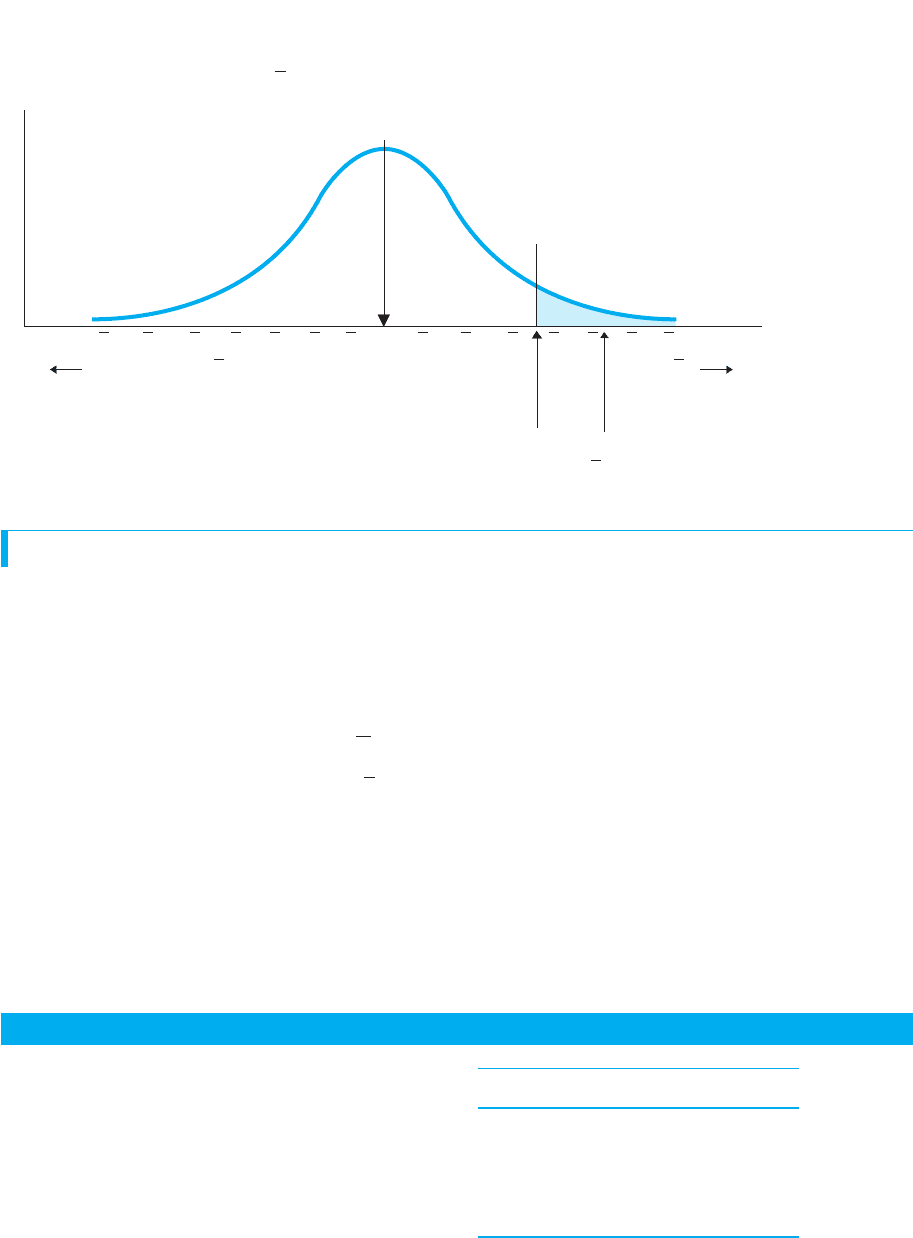
+t
obt
= +2.88
(D = +3.6)
+t
crit
= +2.132
Values of t
Larger positive Ds
...
–2.0 –1.0
0 +1.0 +2.0 ...
Larger negative Ds
FIGURE 12.6
One-Tailed Sampling Distribution of When 0
D
5Ds
■
Perform the related-samples t-test with a matched-
groups or repeated-measures design.
MORE EXAMPLES
In a two-tailed study, we compare husband-and-wife
pairs, with and . Subtracting
wife – husband produces
H
a
:
D
? 0H
0
:
D
5 0
Wife HusbandD
4 6 2
583
396
583
㛬㛬㛬 㛬㛬㛬 㛬㛬㛬
X
苶
4.25 X
苶
7.75 D
苶
3.5
A QUICK REVIEW
SUMMARY OF THE RELATED-SAMPLES t-TEST
After checking that the design is matched samples or repeated measures and meets the
assumptions, the related-samples t-test involves the following:
1. Create either the two-tailed or one-tailed and .
2. Compute :
a. Compute the difference score for each pair of scores.
b. Compute and .
c. Compute .
d. Compute .
3. Find : In the t-tables, use .
4. Compare to : If is beyond , the results are significant; describe the
populations of raw scores and interpret the relationship. If is not beyond ,
the results are not significant; make no conclusion about the relationship.
5. Compute the confidence interval for m .
D
t
crit
t
obt
t
crit
t
obt
t
crit
t
obt
df 5 N 2 1t
crit
t
obt
s
D
s
2
D
D
t
obt
H
a
H
0
(continued)
DESCRIBING THE RELATIONSHIP IN A TWO-SAMPLE EXPERIMENT
In either two-sample t-test, the fact that is significant is not the end of the story. If
you stop after hypothesis testing, then you’ve found a relationship, but you have not
described it. Instead, whenever (and only) when you have significant results, you
should fully describe the relationship in your sample data. This involves two steps—
graphing the results and computing “effect size.”
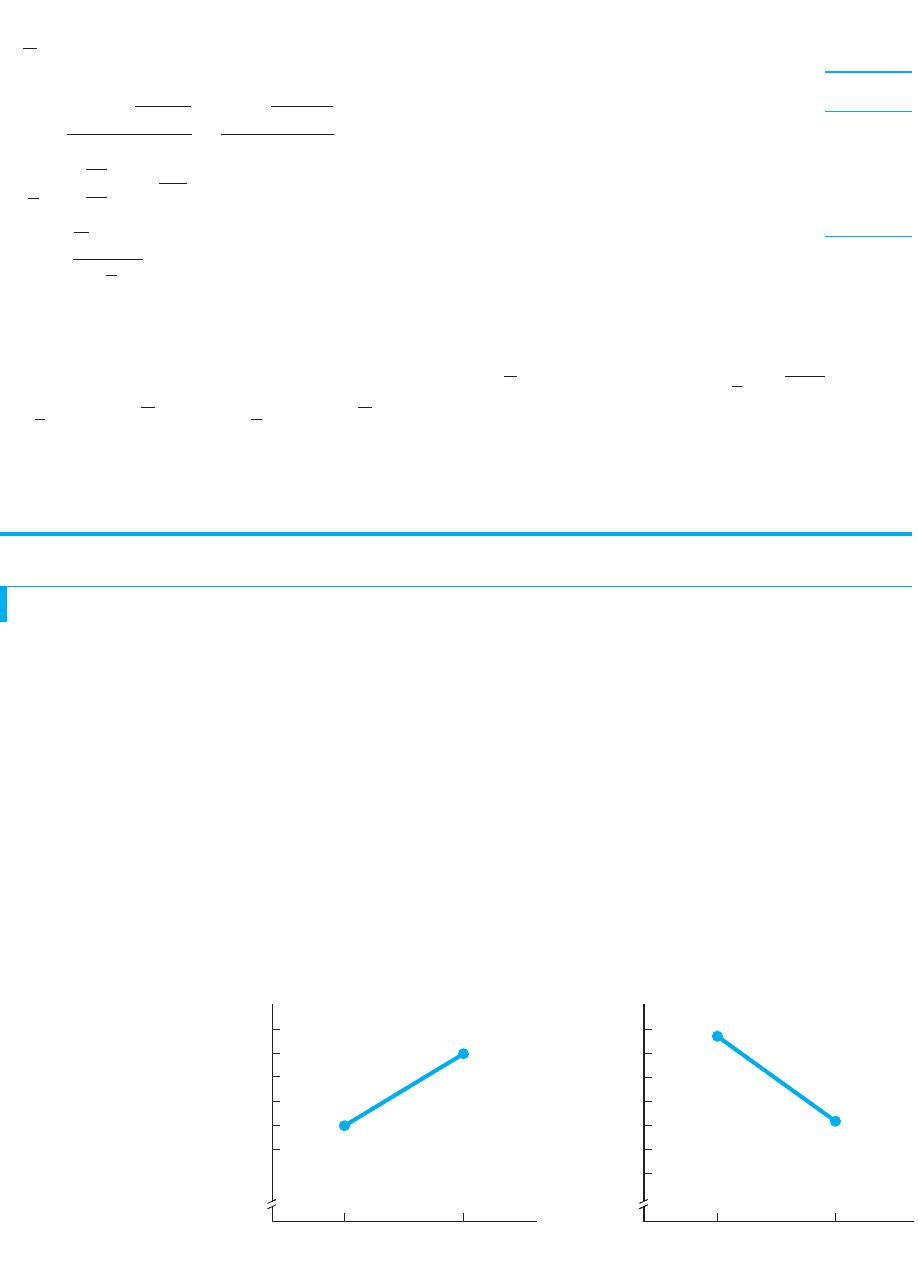
Graphing the Results of a Two-Sample Experiment
From Chapter 4, you know that we plot the mean of each condition on the axis and
the conditions of the independent variable on the axis. The results of our previous
studies are shown in Figure 12.7. Notice that for the phobia study the means of the orig-
inal fear scores from the before and after conditions are plotted, not the .Ds
X
Y
t
obt
With and , is The is
significant. For wives, we expect is 4.25, and for
husbands, we expect is 7.75. For the confidence
interval of ,
26.256 #
D
#20.744
1.8662113.1822123.5 5
1.8662123.1822123.5 #
D
#
1s
D
212t
crit
21 D #
D
# 1s
D
212t
crit
21 D
D
t
obt
;3.182t
crit
df 5 3␣ 5 .05
t
obt
5
D 2
D
s
D
5 123.5 2 02>.866 524.04
s
D
5
B
s
2
D
N
5 23>4 5 .866
s
2
D
5
©D
2
2
1©D2
2
N
N 2 1
5
58 2
12142
2
4
3
5 3.0
D 5214>4 523.5
For Practice
A two-tailed study with repeated
measures gives
AB
87
10 5
96
85
11 6
1. What are and ?
2. Subtracting A – B, perform the
t-test.
3. Compute the confidence interval of .
4. Subtracting A – B, what are and if we pre-
dicted that B would produce lower scores?
Answers
1. ;
2. ; : ;
With ,
and is significant.
3.
4. ; H
a
:
D
7 0H
0
:
D
# 0
1.324 #
D
# 5.476
1.7482122.77621 3.4 #
D
# 1.7482112.77621 3.4 5
t
obt
t
crit
5 ;2.776
␣ 5 0.5t
obt
5 13.4 2 02>.748 514.55.
s
D
5 12.8>5 5 .748s
2
D
5 2.8D 5 17>5 513.4
H
a
:
D
? 0H
0
:
D
5 0
H
a
H
0
D
H
a
H
0
Degree of hypnosis
24
23
22
21
20
19
15
14
13
12
11
10
9
Before
Therapy
Mean recall score as a function
of degree of hypnosis
Mean fear score as a function
of before-and-after therapy
After
Mean fear score
Mean recall score
No hypnosis
Hypnosis
FIGURE 12.7
Line graphs of the results
of the hypnosis study
and the phobia study
Describing the Relationship in a Two-Sample Experiment 279

280 CHAPTER 12 / The Two-Sample t-Test
From each graph, you can first discern the type—direction—of the relationship:
The hypnosis graph shows a positive linear relationship, and the phobia graph shows a
negative relationship. Further, recall that the regression line summarizes a relationship
by running through the center of the scatterplot. With only two conditions, the line
graph is the regression line. Therefore, we can envision the scatterplot in each graph
as being around the line, with participants’ data points located above and below each
mean’s data point. Finally, recall that we use the regression line to predict scores
based on . Therefore, for participants in a particular condition, we travel vertically to
the line and then horizontally to , predicting that they scored at the mean score for
that condition.
What’s missing is that we don’t know the nature of each relationship. Recall that
some relationships are stronger (more consistent) than others. Likewise, some inde-
pendent variables have a greater impact on a behavior than others. Researchers address
these issues by computing a measure of effect size.
Measuring Effect Size in the Two-Sample Experiment
An important statistic for describing the results of an experiment is called a measure of
effect size. The “effect” is from cause and effect, because in an experiment we assume
that changing the independent variable “causes” the dependent scores to change. (The
quotes are used because there’s always a chance that something else was the cause.)
However, not all independent variables will cause scores to change to the same degree,
so we need to know the influence that a particular variable has. Effect size indicates
the amount of influence that changing the conditions of the independent variable had
on dependent scores. Thus, for example, the extent to which changing hypnosis influ-
enced recall scores is the effect size of hypnosis.
The larger the effect size, the greater is the independent variable’s impact in deter-
mining participants’ scores. We want to study those variables that most influence the
behavior measured by these scores, so the larger the effect size, the more scientifi-
cally important the independent variable is. Remember that significant does not
mean important, but only that the sample relationship is unlikely to reflect sampling
error. Although a relationship must be significant to be potentially important, it can be
significant and still be unimportant. Thus, you should always compute a measure of
effect size for any significant result, because this is the only way to determine whether
your independent variable is important in influencing a behavior. In fact, the American
Psychological Association requires published research to report effect size.
REMEMBER The larger the effect size, the greater the influence that an inde-
pendent variable has on dependent scores and thus the more important the
variable is.
We will discuss two methods for measuring effect size. The first is to compute
Cohen’s d.
Effect Size Using Cohen’s d One way to describe the impact of an independent
variable is in terms of how big a difference we see between the means of our condi-
tions. For example, we saw that the presence/absence of hypnosis produced a differ-
ence in recall scores of 3. However, the problem is that we don’t know whether, in the
grand scheme of things, 3 is large, small, or in between. We need a frame of reference,
and here we use the estimated population standard deviation. Recall that the standard
deviation reflects the “average” amount that scores differ from the mean and from
Y
X
Y

each other. Individual scores always differ much more than their means, but this still
provides a frame of reference. For example, if individual scores differ by an “average”
of 20, then we know that many large differences among scores occur in this situation.
Therefore, a difference of 3 between two samples of such scores is not all that impres-
sive. However, say that scores differ by an “average” of only 5. Because smaller differ-
ences occur in this situation, a difference between conditions of 3 is more impressive.
Thus, we standardize the difference between our sample means by comparing it to
the population standard deviation. This is the logic behind the measure of effect size
known as Cohen’s d: It measures effect size as the magnitude of the difference between
the conditions, relative to the population standard deviation. We have two versions of
how it is computed.
1
Cohen, J. (1988) Statistical power analysis for the behavioral sciences. Hillsdale, NJ: Lawrence Erlbaum
Associates.
For the independent-samples t-test, the difference between the conditions is meas-
ured as and the standard deviation comes from the square root of the pooled
variance. For our hypnosis study, the means were 23 and 20, and was 8.3, so
This tells us that the effect of changing our conditions was to change scores by an
amount that is slightly larger than one standard deviation.
For the related-samples t-test, the difference between the conditions is measured by
and the standard deviation comes from finding the square root of the estimated vari-
ance In our phobia study, and , so
Thus, the effect size of the therapy was 1.29.
We can interpret the above in two ways. First, the larger the absolute size of , the
larger the impact of the independent variable. In fact, Cohen
1
proposed the following
interpretations when is the neighborhood of the following amounts:
Values of d Interpretation of Effect Size
Small effect
Medium effect
Large effectd 5 .8
d 5 .5
d 5 .2
d
dds
d 5
D
2s
2
D
5
13.6
17.8
5
13.6
2.79
5 1.29
s
2
D
5 7.8D 513.61s
2
D
.2
D
d 5
X
1
2 X
2
2s
2
pool
5
23 2 20
18.3
5
13
2.88
5 1.04
s
2
pool
X
1
2 X
2
The formulas for Cohen’s d are:
Independent-samples t-test Related-samples t-test
d 5
D
3
s
2
D
d 5
X
1
2 X
2
3
s
2
pool
Describing the Relationship in a Two-Sample Experiment 281

282 CHAPTER 12 / The Two-Sample t-Test
Thus, above we found two very large effects. Second, we can compare the relative
size of different to determine the relative impact of a variable. Above, the for
hypnosis was 1.04, but for therapy it was 1.29. Therefore, the therapy manipulation
had a slightly larger impact. (Note: The difference between the conditions may pro-
duce a that some researchers use to indicate the direction the scores change.
Others think of as the amount of impact the independent variable has, which can-
not be negative.)
Another way to measure effect size is by computing the proportion of variance
accounted for.
Effect Size Using Proportion of Variance Accounted For This approach
measures effect size, not in terms of the size of the changes in scores but in terms of
how consistently the scores change. Here, a variable has a greater impact, the more it
“causes” everyone to behave in the same way, producing virtually the same score for
everyone in a particular condition. This then is an important variable, because by
itself, it pretty much controls the score (and behavior) that everyone exhibits. A vari-
able is more minor if it exhibits less control of a behavior and scores.
We measure this effect by measuring the “proportion of variance accounted for.”
Recall from Chapter 5 that variance reflects differences in scores and that when we
predict scores, we “account for variance.” In Chapter 8, we saw that the proportion
of variance accounted for was the proportional improvement achieved when we use
a relationship to predict scores compared to when we do not use the relationship to
predict scores. In an experiment, the scores we predict are the means of the condi-
tions. Thus, in an experiment, the proportion of variance accounted for is the pro-
portional improvement achieved when we use the mean of a condition as the
predicted score of participants tested in that condition compared to when we do not
use this approach. Put simply it is the extent to which individual scores in each con-
dition are close to the mean of the condition, so if we predict the mean for someone,
we are close to his or her actual score. When the independent variable has more con-
trol of a behavior, everyone in a condition will score more consistently. Then scores
will be closer to the mean, so we will have a greater improvement in accurately pre-
dicting the scores, producing a larger proportion of variance accounted for. On the
other hand, when the variable produces very different, inconsistent scores in each
condition, our ability to predict them is not improved by much, and so little of the
variance will be accounted for.
REMEMBER The larger the proportion of variance accounted for, the greater
the effect size of the independent variable in terms of consistently changing
scores, so the more important the variable is.
In Chapter 8, we saw that the computations for the proportion of variance
accounted for are performed by computing the squared correlation coefficient. For
the two-sample experiment, we compute a new correlation coefficient and then
square it. The squared point-biserial correlation coefficient indicates the propor-
tion of variance accounted for in a two-sample experiment. Its symbol is . This
can produce a proportion as a low as 0 (when the variable has no effect) to as high
as 1.0 (when the variable perfectly controls scores so that we can accurately predict
100% of them). In real research, however, a variable typically accounts for between
about 10% and 30% of the variance, with more than 30% being a very substantial
amount.
r
2
pb
d
1 or 2
dds

This formula is used with either the independent-samples or related-samples t-test. In
either case, start with your significant and square it. Then, for independent samples,
For related samples, .
In our hypnosis study, with , so,
Thus, on average, we are 22% closer to predicting participants’ recall scores when we
predict the mean of each hypnosis condition for them, compared to when we ignore this
relationship. Hypnosis is not of major importance here, because scores are not consis-
tently very close to the mean in each condition. Further, these inconsistent scores have
a cause, so other, hidden variables must be causing them (perhaps IQ, memory ability,
or motivation are operating). Therefore, hypnosis is only one of a number of variables
that play a role here, and, thus, it is only somewhat important in determining recall.
On the other hand, in the phobia study, and , so
Thus, the presence/absence of therapy accounts for 67% of the variance in fear scores.
This variable plays a substantial role in determining these scores. Further, fewer other
variables need to be considered in order to completely predict scores, so this is an
important relationship for understanding phobias and the therapy.
We also use the proportion of variance accounted for to compare the relationships from
different studies. Thus, the role of therapy in determining fear scores (at 67%) is about three
times larger than the role of hypnosis in determining recall scores (which was only 22%).
REMEMBER Compute effect size by computing or to determine the size
of the impact of an independent variable on dependent scores.
STATISTICS IN PUBLISHED RESEARCH: THE TWO-SAMPLE EXPERIMENT
Report the results of either two-sample t-test using the same format used previously,
but, remember, we also report the mean and standard deviation of each group, the con-
fidence interval, and effect size. Thus, a published report of our independent-samples
hypnosis study might say,
“The hypnosis group ( , ) produced significantly higher
recall scores than did the control group ( , ), with
( ) , < . The 95% confidence interval for the difference is 0.91
to 5.09. The effect size of the hypnosis manipulation was ”
For the phobia study, you would see a similar statement that included the means of
the raw fear scores in each condition.
r
2
pb
5 .22.
.05p 5 12.9330t
SD 5 2.74M 5 20.00
SD 5 3.00M 5 23.00
r
2
pb
d
r
2
pb
5
1t
obt
2
2
1t
obt
2
2
1 df
5
12.882
2
12.882
2
1 4
5
8.294
12.294
5 .67
df 5 4t
obt
512.88
r
2
pb
5
1t
obt
2
2
1t
obt
2
2
1 df
5
12.932
2
12.932
2
1 30
5
8.585
8.585 1 30
5
8.585
38.585
5 .22
df 5 30t
obt
512.93
df 5 N 2 1df 5 1n
1
2 121 1n
2
2 12
t
obt
The formula for computing is
r
2
pb
5
1t
obt
2
2
1t
obt
2
2
1 df
r
2
pb
Statistics in Published Research: The Two-Sample Experiment 283

Remember that one of your goals in this course is to learn when to use different statisti-
cal procedures. Obviously, you perform the independent-samples t-test if you’ve cre-
ated two independent samples and the related-samples t-test if you’ve created two
related samples.
In both procedures, if is not significant, consider whether you have sufficient
power. If is significant, then focus on the means from each condition so that you
summarize the typical score—and typical behavior—found in each condition. Use
effect size to gauge how big a role the independent variable plays in determining the
behaviors. Finally, interpret the relationship in terms of the underlying behaviors and
causes that it reflects. (This last step will become easier as you learn more about the
behavioral sciences in your other courses.)
Using the SPSS Appendix See Appendix B.6 to use SPSS to perform the independ-
ent-samples t-test or the related-samples t-test (but it is called the “paired-samples”
t-test). For either, the program indicates the at which is significant, but for a
two-tailed test only. It also computes the descriptive statistics for each condition and
automatically computes the confidence interval for either or The program
does not compute or
CHAPTER SUMMARY
1. Two samples are independent when participants are randomly selected for each,
without regard to who else has been selected, and each participant is in only one
condition.
2. The independent-samples t-test requires (a) two independent samples,
(b) normally distributed interval or ratio scores, and (c) homogeneous variance.
3. Homogeneity of variance means that the variances in the populations being
represented are equal.
4. The confidence interval for the difference between two ms contains a range of
differences between two , one of which is likely to be represented by the
difference between our two sample means.
5. Two samples are related either when we match each participant in one condition
to a participant in the other condition, or when we use repeated measures of one
group of participants tested under both conditions.
6. The confidence interval for m contains a range of values of , any one of which
is likely to be represented by the sample’s .
7. The power of a two-sample t-test increases with (a) larger differences in scores
between the conditions, (b) smaller variability of scores within each condition,
and (c) larger The related-samples t-test is more powerful than the
independent-samples t-test.
8. Effect size indicates the amount of influence that changing the conditions of the
independent variable had on the dependent scores.
ns
D
DD
s
r
2
pb
.d
D
.
1
2
2
t
obt
t
obt
t
obt
PUTTING IT
ALL TOGETHER
284 CHAPTER 12 / The Two-Sample t-Test
9. Cohen’s measures effect size as the magnitude of the difference between the
conditions.
10. The proportion of variance accounted for (computed as ) measures effect
size as the consistency of scores produced within each condition. The larger the
proportion, the more accurately the mean of a condition predicts individual scores
in that condition.
r
2
pb
d
KEY TERMS
Cohen’s 281
Confidence interval for 277
confidence interval for the difference
between two 269
effect size 280
homogeneity of variance 262
independent samples 262
independent-samples t-test 262
matched-samples design 271
pooled variance 265
related samples 271
s
D
d
r
2
pb
ds
D
s
2
D
Ds
X
1
2X
2
s
2
pool
Nn
related-samples t-test 271
repeated-measures design 271
sampling distribution of differences
between the means 263
sampling distribution of mean
differences 274
standard error of the difference 265
standard error of the mean
difference 275
squared point-biserial correlation
coefficient 282
REVIEW QUESTIONS
(Answers for odd-numbered questions are in Appendix D.)
1. A scientist has conducted a two-sample experiment. (a) What two parametric
procedures are available to him? (b) What is the deciding factor for selecting
between them?
2. How do you create independent samples?
3. (a) What are the two ways to create related samples? (b) What other assumptions
must be met before using either two-sample t-test?
4. What is homogeneity of variance?
5. (a) What is ? (b) What is ? (c) What is the difference between and ?
6. All other things being equal, should you create a related-samples or an
independent-samples design? Why?
7. What does the confidence interval for indicate?
8. What does a confidence interval for the difference between two
indicate?
9. (a) What does effect size indicate? (b) What does indicate? (c) What does
indicate?
10. (a) What is the final step when completing an experiment? (b) Why is effect size
useful at this stage?
11. Foofy obtained a statistically significant two-sample . What three things should
she do to complete her analysis?
t
obt
r
2
pb
d
s
D
Nns
D
s
X
1
2X
2
Review Questions 285

286 CHAPTER 12 / The Two-Sample t-Test
APPLICATION QUESTIONS
12. For the following, which type of t-test is required? (a) Studying the effects of a
memory drug on Alzheimer’s patients, testing a group of patients before and after
administration of the drug. (b) Studying whether men and women rate the persua-
siveness of an argument delivered by a female speaker differently. (c) The study
described in part (b), but with the added requirement that for each man of a partic-
ular age, there is a woman of the same age.
13. We study the relationship between hot or cold baths and the amount of relaxation
they produce. The relaxation scores from two independent samples are
Sample 1 (hot): , ,
Sample 2 (cold): , ,
(a) What are and ? (b) Compute (c) With , what is ?
(d) What should we conclude about this relationship? (e) Compute the
confidence interval for the difference between the (f) Using our two
approaches, how big of an effect does bath temperature have on relaxation?
(g) Describe how you would graph these results.
14. We investigate if a period of time feels longer or shorter when people are bored
compared to when they are not bored. Using independent samples, we obtain
these estimates of the time period (in minutes):
Sample 1 (bored): , ,
Sample 2 (not bored): , ,
(a) What are and ? (b) Compute (c) With , what is ?
(d) What should the researcher conclude about this relationship? (e) Compute
the confidence interval for the difference between the (f) Using our two
approaches, how important is boredom in determining how quickly time seems
to pass?
15. A researcher asks if people score higher or lower on a questionnaire measuring
their well-being when they are exposed to much sunshine compared to when
they’re exposed to little sunshine. A sample of 8 people is measured under both
levels of sunshine and produces these well-being scores:
Low: 14 13 17 15 18 17 14 16
High: 18 12 20 19 22 19 19 16
(a) Subtracting low from high, what are and ? (b) Compute
(c) With , what do you conclude about this study? (d) Compute the
appropriate confidence interval. (e) What is the predicted well-being score for
someone when tested under low sunshine? Under high sunshine? (f) On average,
how much more accurate are these predictions than if you did not know how
much sunshine people experience? (g) How scientifically important are these
results?
16. A researcher investigates whether classical music is more or less soothing to air-
traffic controllers than modern music. She plays a classical selection to one group
and a modern selection to another. She gives each person an irritability question-
naire and obtains the following:
Sample A (classical): , ,
Sample B (modern): , , s
2
X
5 11.6X 5 17.21n 5 6
s
2
X
5 8.4X 5 14.69n 5 6
5 .05
t
obt
.H
a
H
0
s.
t
crit
5 .05t
obt
H
a
H
0
n 5 34s
2
X
5 14.6X 5 9.0
n 5 28s
2
X
5 10.22X 5 14.5
s.
t
crit
5 .05t
obt
H
a
H
0
n 5 15s
2
X
5 24.6X 5 39
n 5 15s
2
X
5 22.79X 5 43

(a) Subtracting , what are and ? (b) What is ? (c) With ,
are the results significant? (d) Report the results using the correct format.
(e) What should she conclude about the relationship in nature between type of
music and irritability? (f) What other statistics should be computed? (g) What
statistical flaw is likely in the experiment?
17. We predict that children exhibit more aggressive acts after watching a violent
television show. The scores for ten participants before and after watching the
show are
Sample 1 (After) Sample 2 (Before)
54
66
43
42
74
31
20
10
45
32
(a) Subtracting before from after, what are and ? (b) Compute
(c) With , what is ? (d) What should the researcher conclude about
this relationship? (e) Compute the appropriate confidence interval. (f) How
large is the effect of violence in terms of the difference it produces in
aggression scores?
18. You investigate whether the older or younger male in pairs of brothers tends to be
more extroverted. You obtain the following extroversion scores:
Sample 1 (Younger) Sample 2 (Older)
10 18
11 17
18 19
12 16
15 15
13 19
19 13
15 20
(a) What are and ? (b) Compute (c) With , what is ? (d) What
should you conclude about this relationship? (e) Which of our approaches should
we use to determine if this a scientifically important relationship?
19. A rather dim student proposes testing the conditions of “male” and “female” using
a repeated-measures design. What’s wrong with this idea?
20. With and , a significant independent-samples was .
How would you report this in the literature?
21. An experimenter investigated the effects of a sensitivity training course on a
policeman’s effectiveness at resolving domestic disputes (using independent
14.55t
obt
df 5 40␣ 5 .05
t
crit
␣ 5 .05t
obt
H
a
H
0
t
crit
␣ 5 .05
t
obt
H
a
H
0
␣ 5 .05t
obt
H
a
H
0
A 2 B
Application Questions 287