Heiman G. Basic Statistics for the Behavioral Sciences
Подождите немного. Документ загружается.

248 CHAPTER 11 / Performing the One-Sample t-Test and Testing Correlation Coefficients
Test scores
Age
Sample
scatterplots
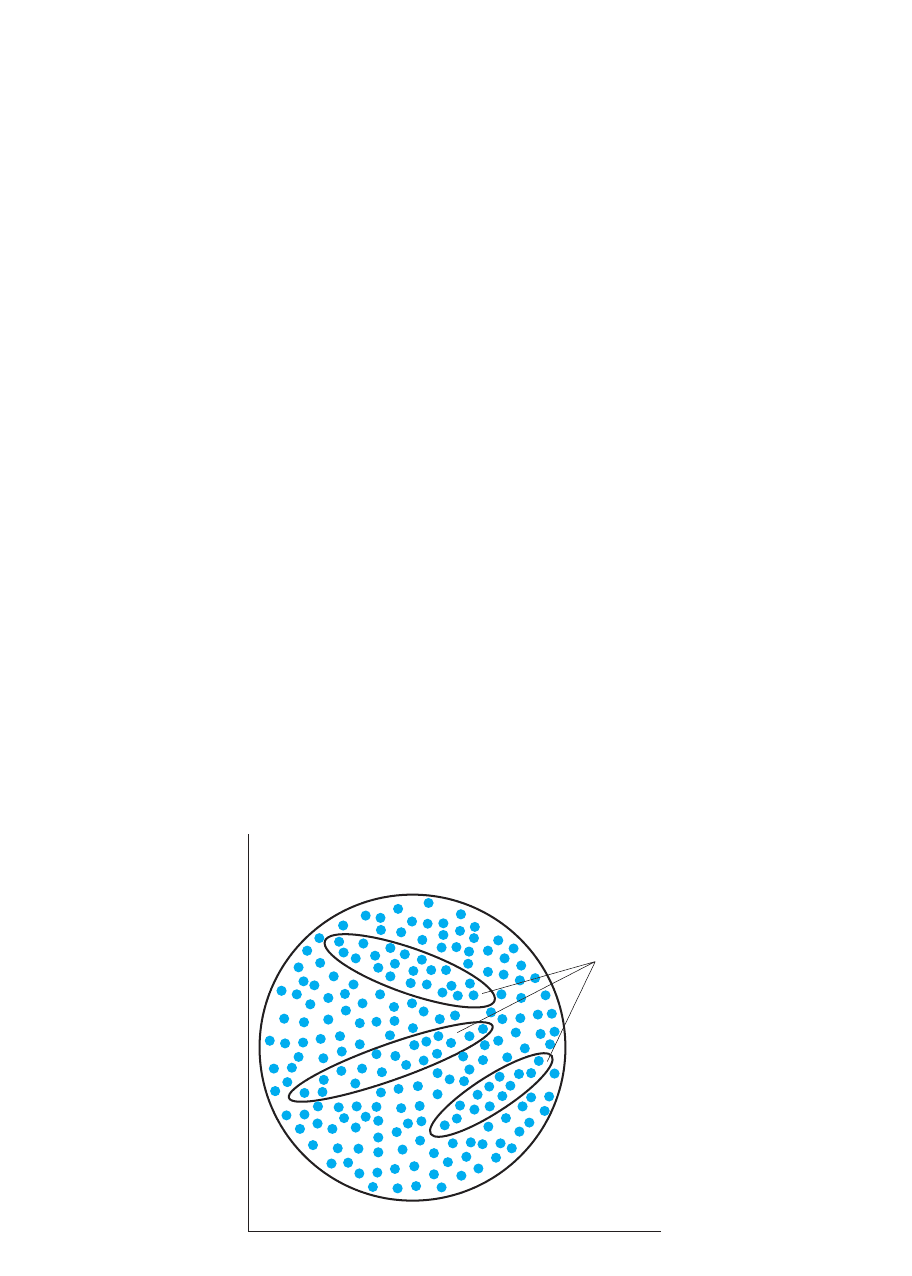
FIGURE 11.5
Scatterplot of a popula-
tion for which 0, as
described by H
0
Any r is a result of
sampling error when
selecting a sample from
this scatterplot.
5
2. The and scores each represent a normal distribution. Further, they represent a
bivariate normal distribution. This means that the scores at each form a nor-
mal distribution and the scores at each form a normal distribution. (If is
larger than 25, however, violating this assumption is of little consequence.)
3. The null hypothesis is that in the population there is zero correlation. This is the
most common approach and the one that we’ll use. (However, you can also test
the that your sample represents a nonzero . Consult an advanced statistics
book for the details.)
Our housekeeping and age scores meet these assumptions, so we set at and test
. First, we create the statistical hypotheses. You can perform either a one- or a two-
tailed test. Use a two-tailed test if you do not predict the direction of the relationship.
For example, let’s say that we are unsure whether men produce higher or lower scores
as they age. This is a two-tailed test because we’re predicting either a positive or a neg-
ative correlation. For our alternative hypothesis, if the correlation in the population is
either positive or negative, then does not equal zero. Therefore we have
On the other hand, the null hypothesis is always that the predicted relationship does
not exist, so here it says that the correlation in the population is zero. Thus,
This implies that if does not equal zero, it’s because of sampling error. You can under-
stand this by looking at Figure 11.5. It shows the scatterplot in the population that
says we would find: There is no relationship here, so equals 0. Recall, however, that a
slanting elliptical scatterplot reflects an that is not equal to zero. Thus, implies
that, by chance, we selected an elliptical sample scatterplot from this population plot.
Therefore, it says, although age and housekeeping scores are not really related, the
scores in our sample happen to pair up so that it looks like they’re related. Conversely,
implies that the population’s scatterplot would not look like Figure 11.5, but rather
it would be similar to our sample’s scatterplot.
H
a
H
0
r
H
0
r
H
0
: 5 0
H
a
: ? 0
r
.05␣
H
0
NYX
XY
YX
Significance Tests for Correlation Coefficients 249
f
μ
–1.0 ...
0
–r
... +1.0
Values of r
–r –r –r –r –r –r –r +r +r +r +r +r +r +r +r
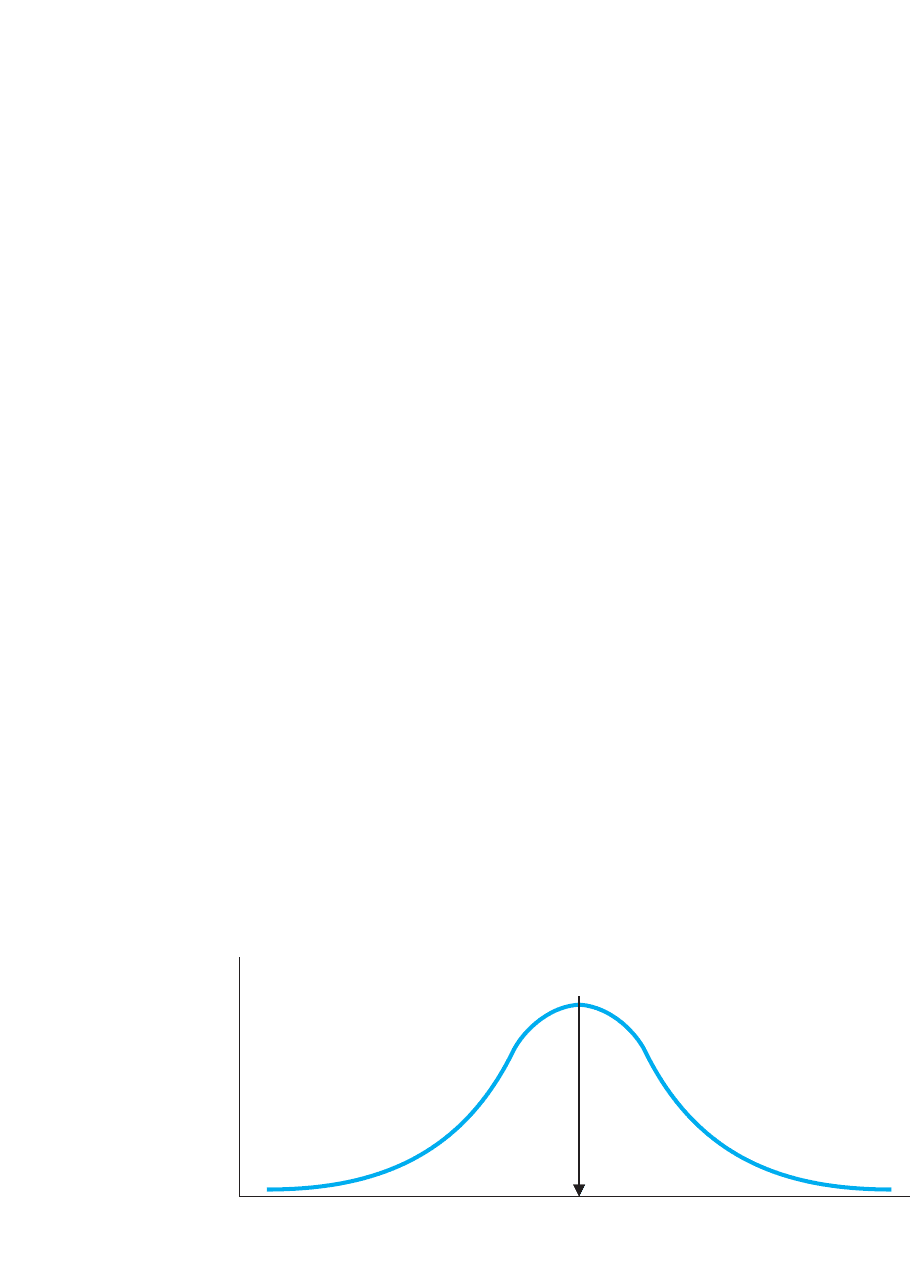
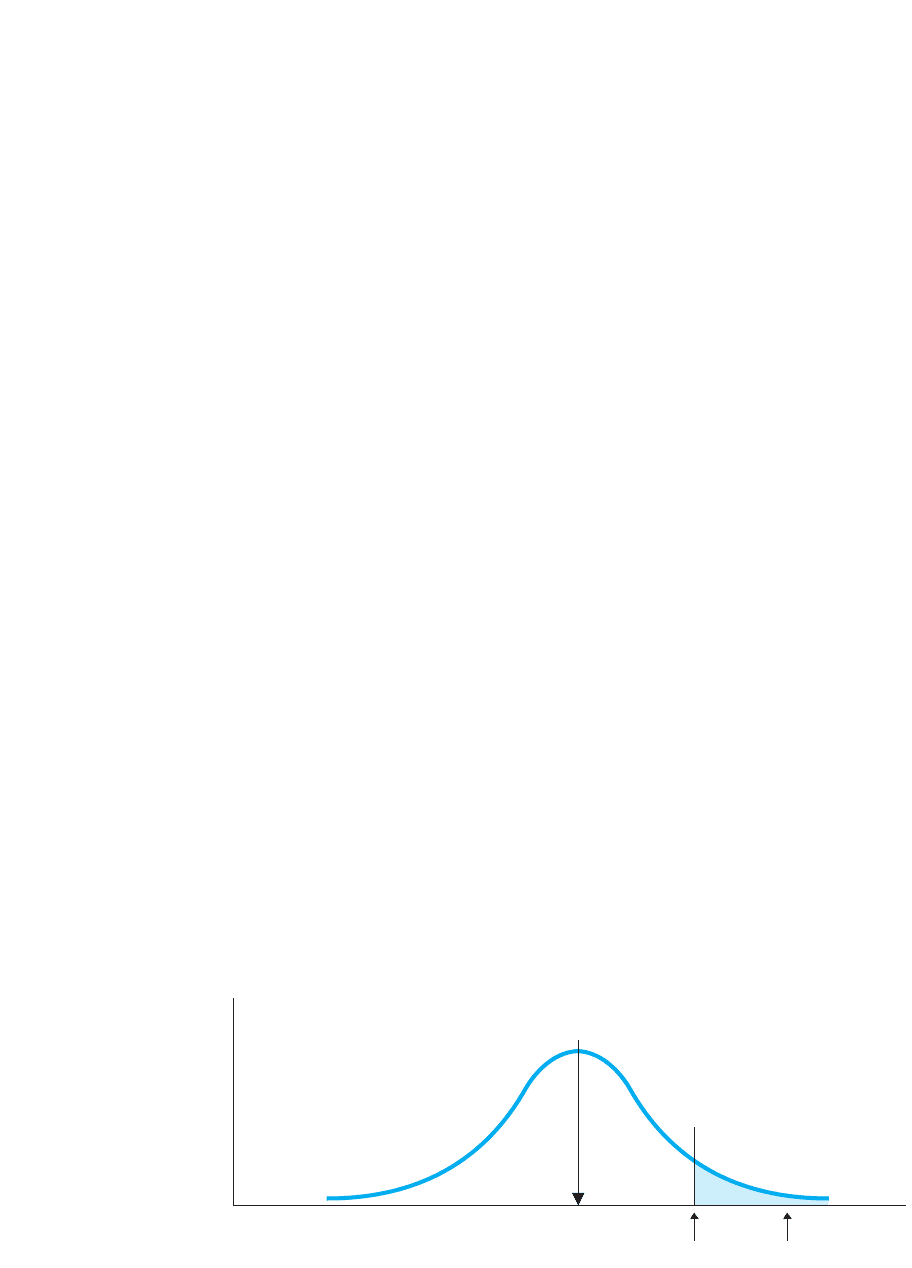
FIGURE 11.6
Sampling distribution of r
It is an approximately normal
distribution, with values of r
plotted along the X axis.
The Sampling Distribution of r We test by determining the likelihood of
obtaining our sample from the population where is zero. To do so, we envision the
sampling distribution of .
The bored statistician quit! By now, however, you could create the sampling distri-
bution yourself: Using the same as in our study, you would select an infinite number
of samples of pairs from the population where (as if you pulled each sam-
ple from the scatterplot in Figure 11.5). Each time, you would compute . If you then
plotted the frequency of the various values of , you would have the sampling distribu-
tion of . The sampling distribution of r is a frequency distribution showing all possi-
ble values of that occur by chance when samples are drawn from a population in
which is zero. Such a distribution is shown in Figure 11.6.
The only novelty here is that along the axis are now different values of . When
, the most frequent sample is also 0, so the mean of the sampling distribution—
the average —is 0. Because of sampling error, however, sometimes we’ll obtain a pos-
itive and sometimes a negative . Most often the will be relatively small and close
to 0. But, less frequently, we’ll obtain a larger that falls into a tail of the distribution.
Thus, the larger the (whether positive or negative), the less likely it is to occur when
the sample actually represents a population in which
To test , we determine where our lies on this distribution. To do so, we could per-
form a variation of the t-test, but luckily that is not necessary. Instead, directly com-
municates its location on the sampling distribution. The mean of the sampling
distribution is always zero, so, for example, our of is a distance of below the
mean. Therefore, we test simply by examining our obtained , which is . To
determine whether is in the region of rejection, we compare it to .
As with the t-distribution, the shape of the sampling distribution of is slightly dif-
ferent for each , so there is a different value of for each . But, here’s a new one:
With the Pearson correlation coefficient, the degrees of freedom equals , where
is the number of pairs of scores in the sample.
REMEMBER For the Pearson , the degrees of freedom equals , where
is the number of pairs of scores.
Table 3 in Appendix C gives the critical values of the Pearson correlation coefficient.
Use these “r-tables” in the same way that you’ve used the t-tables: Find for either a
one- or a two-tailed test at the appropriate and . For the housekeeping correlation,
was 25, so , and, for a two-tailed test with , is . We set up;.396r
crit
␣ 5 .05df 5 23N
df␣
r
crit
N
N 2 2r
N
N 2 2
dfr
crit
df
r
r
crit
r
obt
r
obt
rH
0
.452.45r
r
rH
0
5 0.
r
r
rrr
r
r 5 0
rX
r
r
r
r
5 0X2Y
N
r
r
H
0
250 CHAPTER 11 / Performing the One-Sample t-Test and Testing Correlation Coefficients
f
μ
–1.0 ...
0.0
... +1.0
Values of r +r+r+r+r+r+r
–r –r –r –r –r –r
r
obt
= –.45
–r
crit
= –.396
+r
crit
= +.396
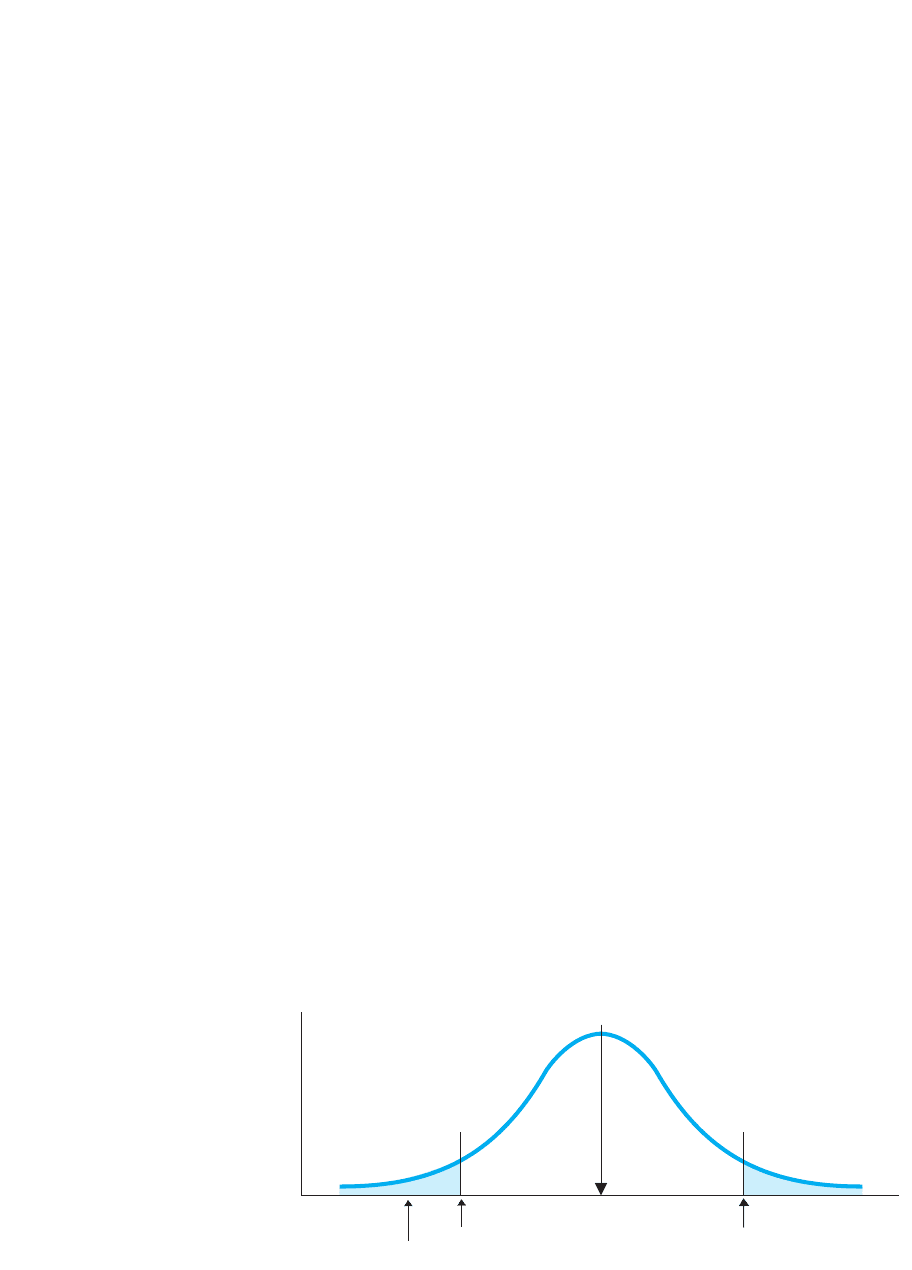
FIGURE 11.7
H
0
sampling distribution
of r
For the two-tailed test, there
is a region of rejection for
positive values of and for
negative values of .r
obt
r
obt
the sampling distribution in Figure 11.7. Our of is beyond the of ,
so it is in the region of rejection. As usual, this means that the results are significant:
This is so unlikely to occur if we had been representing the population where is 0,
that we reject the that we were representing this population. We conclude that the
is “significantly different from 0.”
Interpreting r The rules for interpreting a significant result here are the same as
before. Remember that rejecting does not prove anything. In particular, this was a
correlational study, so we have not proven that changes in age cause test scores to
change. In fact, we have not even proven that the relationship exists because we may
have made a Type I error. Here, a Type I error is rejecting the that there is zero cor-
relation in the population, when in fact there is zero correlation in the population. As
usual, though, with , the probability that we have made a Type I error is slightly
less than .
Report the Pearson correlation coefficient using the same format as with previous
statistics. Our of was significant with 23 , so in a published report we’d say
that , . As usual, our is in parentheses and because
and the coefficient is significant, we indicate that the probability is less than that
we’ve made a Type I error.
Because the sample is , our best estimate is that, in this population, equals
. However, recognizing that the sample may contain sampling error, we expect
that is probably around . (We could more precisely describe by computing a
confidence interval. However, this is computed using a very different procedure from
the one discussed previously.)
In Chapter 8, you saw that we further describe a relationship by computing the
regression equation and the proportion of variance accounted for. However, do this only
when is significant! Only then are we confident that we’re describing a “real” rela-
tionship. Thus, for the housekeeping study, we would now compute the linear regres-
sion equation for predicting test scores if we know a man’s age. We would also
compute , which is or . Recall, this is the proportion of variance in
scores that is accounted for by the relationship with . Here, an of tells us that
we are 20% more accurate when we use the relationship with age to predict housekeep-
ing scores than when we do not use the relationship.
Remember that it is and not “significance” that determines how important a
relationship is. Significant indicates only that the sample relationship is unlikely to
be a fluke of chance. The indicates the importance of a relationship because it indi-
cates the extent to which knowing participants’ scores improves our accuracy in
predicting and understanding differences in their scores. This allows us to understandY
X
r
2
r
2
.20r
2
X
Y.2012.452
2
r
2
r
obt
2.45
2.45
2.45r
obt
.05
␣ 5 .05dfp 6 .05r123252.45
df2.45r
obt
.05
␣ 5 .05
H
0
H
0
r
obt
H
0
r
;.396r
crit
2.45r
obt
Significance Tests for Correlation Coefficients 251
f
μ
–1.0 ...
0
... +1.0
+r+r +r +r
+r
crit
Predicting positive
correlation
H
0
: ρ ≤ 0
H
a
: ρ > 0
–r –r –r –r
f
μ
–1.0 ...
0
... +1.0
+r+r +r +r
–r
crit
Predicting negative
correlation
H
0
: ρ ≥ 0
H
a
: ρ < 0
–r –r –r –r
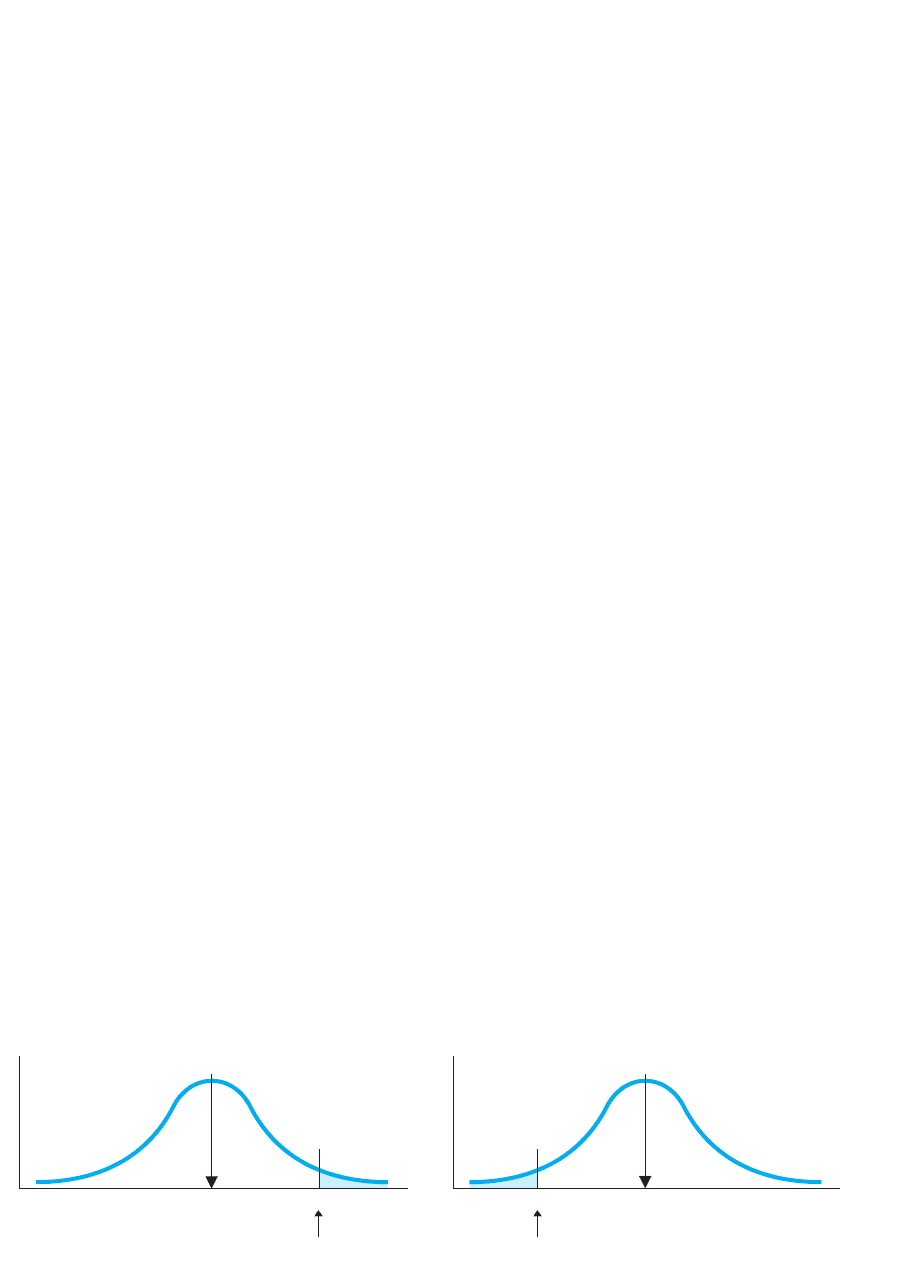
FIGURE 11.8
H
0
sampling distribution of r where 0 for one-tailed test 5
differences in their behavior, and so the larger the , the greater is the importance of
the relationship.
Thus, a relationship must be significant to be even potentially important (because it
must first be believable). But, a significant relationship is not necessarily important.
For example, an of might be significant, but it is not statistically important:
is only , so this relationship accounts for only 1% of the variance and so is
virtually useless in explaining differences in scores. (We’re only 1% better off with it
than without it.) Thus, although this relationship is unlikely to occur through sampling
error, it is also an unimportant relationship.
After describing the relationship, as usual the final step is to interpret it in terms of
behaviors. For example, perhaps our correlation coefficient reflects socialization
processes, with older men scoring lower on the housekeeping test because they come
from generations in which wives typically did the housekeeping, while men were the
“breadwinners.”
Of course, if does not lie beyond , then you would retain and conclude that
the correlation is not significant. In this case, make no claims about the relationship that
may or may not exist, and do not compute the regression equation or .
One-Tailed Tests of r If we had predicted only a positive correlation or only a neg-
ative correlation, then we would have performed a one-tailed test. When we predict a
positive relationship, we are predicting a positive (a number greater than 0) so our
alternative hypothesis is . The says that we’re wrong (that is 0 or less
than 0), so . On the other hand, when we predict a negative relationship, we
are predicting a negative (a number less than 0) so we have . The says
we’re wrong (that is 0 or greater than 0) so .
We test each by again testing whether the sample represents a population in which
there is zero relationship—so again we examine the sampling distribution for .
From the -tables in Appendix C, find the one-tailed critical value for and . Then set
up one of the sampling distributions shown in Figure 11.8. When predicting a positive
correlation, use the left-hand distribution: is significant if it is positive and falls
beyond the positive . When predicting a negative correlation, use the right-hand
distribution: is significant if it is negative and falls beyond the negative .r
crit
r
obt
r
crit
r
obt
␣dfr
5 0
H
0
H
0
: $ 0
H
0
H
a
: 6 0
H
0
: # 0
H
0
H
a
: 7 0
r
2
H
0
r
crit
r
obt
Y
.011.10
2
1.10r
obt
r
2
252 CHAPTER 11 / Performing the One-Sample t-Test and Testing Correlation Coefficients
f
μ
–1.0 ...
0
–r
s
... +1.0
–r
s
–r
s
–r
s
+r
s
+r
s
+r
s
+r
s
Critical r
s
= +.600 Obtained r
s
= +.85
FIGURE 11.9
One-tailed H
0
sampling
distribution of values
of r
s
when H
0
is
s
5 0
Testing the Spearman
We also use the above logic when testing the Spearman correlation coefficient .
Recall that describes the linear relationship in a sample when and are both
ordinal (ranked) scores. Again our ultimate goal is to use the sample coefficient to
estimate the correlation coefficient we would see if we could measure everyone in the
population.
The symbol for the Spearman correlation coefficient in the population is
S
.
However, before we can use to estimate , we must first deal with the usual prob-
lem: That’s right, maybe our merely reflects sampling error. Perhaps if we measured
the population, we’d find that is 0. Therefore, before we can conclude that the corre-
lation reflects a relationship in nature, we must perform hypothesis testing. So, we
1. Set alpha: how about ?
2. Consider the assumptions of the test: The requires a random sample of pairs of
ranked (ordinal) scores. (Note: Because of the data involved and the lack of para-
metric assumptions, is technically a nonparametric procedure.)
3. Create the statistical hypotheses: You can test the one- or two-tailed hypotheses
that we saw previously with , except now use the symbol .
The only new aspect of testing is the sampling distribution. The sampling distri-
bution of is a frequency distribution showing all possible values of that occur
when samples are drawn from a population in which is zero. This creates a new fam-
ily of sampling distributions and a different table of critical values. Table 4 in Appen-
dix C, entitled “Critical Values of the Spearman Rank-Order Correlation Coefficient,”
contains the critical values for one- and two-tailed tests of . Obtain critical values as
in previous tables, except here use , not degrees of freedom. (Note the instructions at
the top of this table for when your is not listed.)
REMEMBER The critical value of is obtained using , the number of pairs
of scores in the sample.
Here’s an example. In Chapter 7, we correlated the aggressiveness rankings given to
nine children by two observers and found that . We had assumed that the
observers’ rankings would agree, predicting a positive correlation. Therefore, we have
a one-tailed test with the hypotheses and . From Table 4 in
Appendix C, with and , the one-tailed critical value is . This pro-
duces the sampling distribution shown in Figure 11.9.
1.600N 5 9␣ 5 .05
H
a
:
S
7 0H
0
:
S
# 0
r
S
51.85
Nr
S
N
N
r
S
S
r
S
r
S
r
S
S
r
S
r
S
.05
S
r
S
S
r
S
YXr
S
1r
S
2
r
S

Maximizing the Power of Statistical Tests 253
■
Always perform hypothesis testing on a correlation
coefficient so that we are confident it is not due to
sampling error.
MORE EXAMPLES
We compute an . We predicted
some kind of relationship, so ; .
With and , the two-tailed
. The is beyond , so it is signifi-
cant: We expect the population correlation coefficient
to be around .
We compute an , using . With
, the two-tailed critical value is . The
is not in the region of rejection and is not significant.
r
S
;.409␣ 5 .05
N 5 24r
S
52.22
1.3212
r
crit
r
obt
r
crit
5 ;.304
df 5 42 2 2 5 40␣ 5 .05
H
a
: ? 0H
0
: 5 0
r 51.32 1N 5 422
For Practice
We predict a negative relationship and obtain
.
1. What are and ?
2. With and , what is ?
3. What is the conclusion about ?
4. What is the conclusion about the relationship in
the population and ?
Answers
1.
2.
3. Not significant
4. Make no conclusion and do not compute .r
2
df 5 8, r
crit
52.549
H
0
: $ 0; H
a
: 6 0
r
2
r
obt
r
crit
N 5 10␣ 5 .05
H
a
H
0
r
obt
52.44
A QUICK REVIEW
Because an of is beyond the critical value of , we reject . Thus, our
is significantly different from zero, and we estimate that in the population of such
rankings is around . In a publication, this would be reported as ,
. Note that the of the sample is given in parentheses. We would also compute
the squared to determine the proportion of variance accounted for. Then interpret
these results as we have done previously. (With different predictions, we might have
performed the other one-tailed test or a two-tailed test.)
Summary of Testing a Correlation Coefficient
All of the preceding boil down to the following steps:
1. Check the assumptions of or .
2. Create the hypotheses: Create either the two-tailed or one-tailed and .
3. Compute the correlation coefficient.
4. Obtain the critical value from Appendix C: The critical value for is in Table 3,
using . The critical value for is in Table 4, using .
5. Compare the obtained to the critical value: If the obtained coefficient is beyond
the critical value, the results are significant. If the coefficient is not beyond the
critical value, the results are not significant.
6. For significant results, compute the proportion of variance accounted for by
squaring the obtained coefficient. For , compute the linear regression equation.r
df 5 Nr
S
df 5 N 2 2
r
H
a
H
0
r
S
r
r
S
Np 6 .05
r
S
19251.851.85
S
r
S
H
0
1.6001.85r
S
MAXIMIZING THE POWER OF STATISTICAL TESTS
The t-test is our first design in which we—the researcher—have some control over all
components of our data, because we are not stuck with a given . Therefore, it is
appropriate to revisit the topic of power, so that you can understand how researchers
use this control to increase the power of a study. Recall that power is the probability of
not committing a Type II error. We’re talking about those times when really is false,H
0
σ
X

254 CHAPTER 11 / Performing the One-Sample t-Test and Testing Correlation Coefficients
and the error would be to retain . Instead, we should reject , correctly concluding
that the predicted relationship exists in nature. Essentially, power is the probability that
we will not miss a relationship that really exists in nature. We maximize power by
doing everything we can to reject so that we don’t miss the relationship. If we still
end up retaining , we can be confident that we did not do so incorrectly and miss a
relationship that exists, but rather that the relationship does not exist.
We maximize power by the way that we design an experiment or correlational
study.
2
We’re talking about those times when we should reject the null hypothesis, so
maximizing power boils down to maximizing the probability that our results will be
significant. This translates into designing the study to maximize the size of our
obtained statistic relative to the critical value, so that the obtained will be significant.
For the one-sample t-test, three aspects of the design produce a relatively larger
and thus increase power. (These also apply to other types of experiments that we will
discuss.) Look at the formulas:
First, larger differences produced by changing the independent variable increase
power. In the housekeeping study, the greater the difference between the sample mean
for men and the for women, the greater the power. Logically, the greater the differ-
ence between men and women, the less likely we are to miss that a difference exists.
Statistically, in the formula this translates to a larger difference between and that
produces a larger numerator, which results in a larger that is more likely to be sig-
nificant. Therefore, when designing any experiment, the rule is to select conditions that
are substantially different from one another, so that we produce a big difference in
dependent scores between the conditions.
Second, smaller variability in the raw scores increases power. Recall that variability
refers to the differences among the scores. Logically, smaller variability indicates more
consistent behavior and a more consistent, stronger relationship. This makes a clearer
pattern that we are less likely to miss. Statistically, in the formula, smaller variability pro-
duces a smaller estimated variance , which produces a smaller standard error .
Then in the t-test, dividing by a smaller denominator produces a larger . We will see
smaller variability in scores the more that all participants experience the study in the same
way. Therefore, the rule is to conduct any study in a consistent way that minimizes the
variability of scores within each condition.
Third, a larger increases power. Logically, a larger provides a more accurate
representation of the population, so we are less likely to make any type of error. Statis-
tically, dividing by a larger produces a smaller , which results in a larger .
Also, a larger produces larger , which produces a smaller . Then our is more
likely to be significant. Therefore, the rule is to design any experiment with the largest
practical . However, this is for small samples. Generally, an of 30 per condition is
needed for minimal power, and increasing up to 121 adds substantially to it. How-
ever, an of, say, 500 is not substantially more powerful than an of, say, 450.
REMEMBER Increase power in an experiment by maximizing differences in
dependent scores between conditions, minimizing differences among scores
within conditions, and testing a larger .N
NN
N
NN
t
obt
t
crit
dfN
t
obt
s
X
Ns
2
X
NN
t
obt
1s
X
21s
2
X
2
t
obt
X
t
obt
5
X 2
s
X
s
X
5
B
s
2
X
N
t
obt
H
0
H
0
H
0
H
0
2
More advanced textbooks contain procedures for determining the amount of power that is present in a given
study.

In one sense, I hope that you found this chapter rather boring—not because it is bor-
ing, but because, for each statistic, we performed virtually the same operations. In
testing any statistic, we ultimately do and say the same things. In all cases, if the
obtained statistic is out there far enough in the sampling distribution, it is too
unlikely for us to accept as representing the situation, so we reject . Any
implies that the sample does not represent the predicted relationship, so rejecting
increases our confidence that the data do represent the predicted relationship. We’re
especially confident because the probability is less than that we’ve made an error
in this decision. If we fail to reject , then hopefully we have sufficient power, so
that we’re unlikely to have made an error here, too. These are the fundamentals of all
inferential statistics.
Using the SPSS Appendix As described in Appendix B.5, SPSS will compute the
one-sample . It also indicates the smallest two-tailed region of rejection (and alpha
level) for which your is significant. Further, it computes the and for the sample
and it computes the 95% confidence interval.
As part of computing the Pearson or the Spearman , SPSS automatically per-
forms a one- or two-tailed significance test. This includes indicating the smallest alpha
level at which the coefficient is significant.
CHAPTER SUMMARY
1. The one-sample t-test is for testing a one-sample experiment when the standard
deviation of the raw score population is not known.
2. A t-distribution is a theoretical sampling distribution of all possible values
of t when a raw score population is infinitely sampled using a particular .
A t-distribution that more or less forms a perfect normal curve will occur
depending on the degrees of freedom of the samples used to create it.
3. In point estimation, a is assumed to be at a point on the variable equal
to . Because the sample probably contains sampling error, a point estimate
is likely to be incorrect. In interval estimation, a is assumed to lie within a
specified interval. Interval estimation is performed by computing a confidence
interval.
X
1df2
N
r
S
r
s
X
Xt
obt
t
obt
H
0
␣
H
0
H
0
H
0
H
0
PUTTING IT
ALL TOGETHER
Chapter Summary 255
Likewise, we maximize the power of a correlational study by maximizing the size of
the correlation coefficient relative to the critical value. Three aspects will increase the
power of a correlation coefficient. First, avoiding a restricted range increases power.
Recall from Chapter 7 that having a small range of scores on the or variable pro-
duces a coefficient that is smaller than it would be without a restricted range. There-
fore, always measure the full range of possible and scores. Second, minimizing
the variability of the scores at each increases power. Recall that the smaller the
variability in scores at each , the larger the correlation coefficient. Therefore,
always test participants in a consistent fashion to minimize the variability in scores
at each . Third, increasing increases power. With a larger , the are larger, so the
critical value is smaller, and thus a given coefficient is more likely to be significant.
REMEMBER Increase power in a correlation coefficient by avoiding a
restricted range, minimizing the variability in scores, and increasing .NY
dfNNX
Y
XY
XY
YX
YX

256 CHAPTER 11 / Performing the One-Sample t-Test and Testing Correlation Coefficients
4. The confidence interval for a single m describes a range of , one of which the
sample mean is likely to represent. The interval contains the highest and lowest
values of that are not significantly different from the sample mean.
5. The symbol for the Pearson correlation coefficient in the population is (called
rho). The symbol for the Spearman correlation coefficient in the population is .
6. The sampling distribution of the Pearson is a frequency distribution showing all
possible values of that occur when samples are drawn from a population in
which is zero.
7. The sampling distribution of the Spearman is a frequency distribution showing
all possible values of that occur when samples are drawn from a population in
which is zero.
8. Only when a correlation coefficient is significant is it appropriate to compute the
linear regression equation and the proportion of variance accounted for.
9. Maximize the power of experiments by (a) creating large differences in scores
between the conditions of the independent variable, (b) minimizing the variability
of the scores within each condition, and (c) increasing the of small samples.
10. Maximize the power of a correlation coefficient by (a) avoiding a restricted range,
(b) minimizing the variability in at each , and (c) increasing the of small
samples.
NXY
N
S
r
S
r
S
r
r
S
s
KEY TERMS
confidence interval for a single 243
estimated standard error of the
mean 236
interval estimation 243
margin of error 243
r
crit
r
obt
H
a
H
0
dfs
X
t
crit
t
obt
one-sample t-test 234
point estimation 243
sampling distribution of 249
sampling distribution of 252
t-distribution 238
r
S
r
REVIEW QUESTIONS
(Answers for odd-numbered questions are in Appendix D.)
1. A scientist has conducted a one-sample experiment. (a) What two parametric pro-
cedures are available to her? (b) What is the deciding factor for selecting between
them? (c) What are the other assumptions of the t-test?
2. In this chapter, you learned how to perform four different statistical procedures.
List them.
3. (a) What is the difference between and ? (b) How is their use the same?
4. (a) Why are there different values of when samples have different ?
(b) What must you compute in order to find ?
5. (a) What is the symbol for the Pearson correlation coefficient in the population?
(b) What is the symbol for the Spearman correlation coefficient in the population?
(c) Summarize the steps involved in analyzing a Pearson correlational study.
t
crit
Nst
crit
σ
X
s
X

Application Questions 257
6. Summarize the steps involved in analyzing the results of a one-sample
experiment.
7. What is the final step when results are significant in any study?
8. Say that you have a sample mean of 44 in a study. (a) Estimate the corresponding
using point estimation. (b) What would a confidence interval for this tell you?
(c) Why is computing a confidence interval better than using a point estimate?
(d) What is the difference between reporting an estimate of using a margin of
error versus using a confidence interval?
9. (a) What is power? (b) What outcome should cause you to worry about having
sufficient power? (c) Why? (d) At what stage do you build in power?
10. (a) What are the three aspects of maximizing the power of a t-test? (b) What are
the three aspects of maximizing the power of a correlation coefficient?
APPLICATION QUESTIONS
11. We ask whether a new version of our textbook is beneficial or detrimental to students
learning statistics. On a national statistics exam, for students using other
textbooks. A sample of students using this book has the following scores:
64 69 92 77 71 99 82 74 69 88
(a) What are and for this study? (b) Compute . (c) With , what
is ? (d) What do you conclude about the use of this book? (e) Compute the
confidence interval for .
12. A researcher predicts that smoking cigarettes decreases a person’s sense of smell.
On a test of olfactory sensitivity, the for nonsmokers is 18.4. A sample of peo-
ple who smoke a pack a day produces these scores:
16 14 19 17 16 18 17 15 18 19 12 14
(a) What are and for this study? (b) Compute . (c) With ,
what is ? (d) What should the researcher conclude about this relationship?
(e) Compute the confidence interval for .
13. Foofy studies if hearing an argument in favor of an issue alters participants’
attitudes toward the issue one way or the other. She presents a 30-second
argument to 8 people. In a national survey about this issue, . She obtains
and . (a) What are and ? (b) What is ? (c) With
, what is ? (d) If appropriate, compute the confidence interval for .
(e) What conclusions should Foofy draw about the relationship?
14. In question 13, (a) What statistical principle should Foofy be concerned with?
(b) Identify three problems with her study from a statistical perspective.
(c) Why would correcting these problems improve her study?
15. Poindexter examined the relationship between ratio scores measuring the
quality of sneakers worn by volleyball players and their average number of
points scored per game. Studying 10 people who owned sneakers of good to
excellent quality, he computed . Without further ado, he immediately
claimed to have support for the notion that better-quality sneakers are related to
better performance on a somewhat consistent basis. He then computed and the
regression equation. Do you agree or disagree with his approach? Why?
16. Eventually, for the study in question 15, Poindexter reported that ,
. (a) What should he conclude about this relationship? (b) What otherp 7 .05
r18251.21
r
2
r 51.21
t
crit
␣ 5 .05
t
obt
H
a
H
0
s
2
X
5 569.86X 5 53.25
5 50
t
crit
␣ 5 .05t
obt
H
a
H
0
t
crit
␣ 5 .05t
obt
H
a
H
0
5 68.5