Heiman G. Basic Statistics for the Behavioral Sciences
Подождите немного. Документ загружается.


258 CHAPTER 11 / Performing the One-Sample t-Test and Testing Correlation Coefficients
computations should he perform to describe the relationship in these data?
(c) What statistical goal described in this chapter should he be concerned with?
(d) Identify three problems with his study. (e) Why will correcting these problems
improve his study?
17. A scientist suspects that as a person’s stress level changes, so does the amount of
his or her impulse buying. With , his is . (a) What are and ?
(b) With , what is ? (c) Report these results using the correct format.
(d) What conclusions should he draw? (e) What other calculations should be per-
formed to describe the relationship in these data?
18. Foofy computes the correlation between an individual’s physical strength and his
or her college grade point average. Using a computer, the correlation for a sample
of 2000 people is , . She claims this is a useful tool
for predicting which college applicants are likely to succeed academically. Do you
agree or disagree? Why?
19. We study the influence of wearing uniforms in middle school on attitudes toward
achieving good grades. On a national survey, the average attitude score for
students who do not wear uniforms is . A sample of students who wear
uniforms has scores of 8, 12, 10, 9, 6, and 7. Perform all parts of the t-test and
draw the appropriate conclusions.
20. A newspaper article claims that the academic rank of a college is negatively
related to the rank of its football team. From a sample of 28 colleges, you obtain a
correlation coefficient of . (a) Which type of correlation coefficient did you
compute? (b) What are and ? (c) With , what is the critical value?
(d) What should you conclude about the accuracy of the newspaper’s claim?
(e) In predicting a particular school’s academic ranking in your sample, how
important is it that you look at the school’s football ranking?
21. (a) How would you report your results if , , and is
significant? (b) How would you report your results if , , and
is not significant?
22. While reading a published research report, you encounter the following statements.
For each, identify the , the procedure performed and the outcome, the relationship,
and the type of error possibly being made. (a) “When we examined the perceptual
skills data, the mean of 55 for the sample of adolescents differed significantly from
the population mean of 70 for adults, .” (b) “The correlation
between personality type and emotionality, however, was not significantly different
from zero, with , .”
23. You wish to compute the 95% confidence interval for a sample with a of 80.
Using interpolation, determine the that you should use.
24. In a two-tailed test, is 35. (a) Is the of significant? (b) Is the of
significant?
INTEGRATION QUESTIONS
25. (a) Why must a relationship be significant to be important? (b) Why can a
relationship be significant and still be unimportant? (Chs. 8, 10, 11)
26. (a) What is the difference between the purpose of descriptive and inferential
statistics? (b) When should you should use a parametric versus a nonparametric
inferential procedure? (Chs. 2, 10)
27. What is the design of the study when we compute the z-test and t-test versus when
we compute a correlation coefficient? (Chs. 2, 7, 10, 11)
14.0
t
obt
12.019t
obt
N
t
crit
df
p 7 .05r125251.42
t14525 3.76, p 6 .01
N
t
obt
521.72
N 5 6␣ 5 .05
t
obt
516.72N 5 43␣ 5 .05
␣ 5 .05H
a
H
0
2.32
5 12
p 5 6 .0001r11998251.08
r
crit
␣ 5 .05
H
0
H
0
1.38rN 5 72

Integration Questions 259
28. (a) What does a correlation coefficient tell you? (b) When do you compute ?
(c) When do you compute ? (d) When is linear regression used? (Chs. 7, 8, 11)
29. (a) Study A reports a result with . Study B reports results with .
What is the difference between the results of A and B in terms of (a) how signifi-
cant they are? (b) Their critical values? (c) Their region of rejection? (d) The
probability of a statistical error? (Chs. 9, 10, 11)
30. (a) What do we mean by the restriction of range? (b) Why is it a problem for the
size of correlation coefficient? (c) Why is it a problem for the power of a correla-
tion coefficient? (Chs. 7, 11)
31. For the following, specify which descriptive and inferential procedures should be
performed, explain what is being compared, and identify the key to answering the
researcher’s question. (a) A researcher measures a group of participants using stan-
dard tests of “social nervousness” and “introversion” to determine if introversion is
a good predictor of nervousness. (Scores are interval scores.) (b) The average
worker at a calculator plant can assemble 106 calculators in his or her first hour of
work. During their final hour, a sample of workers produced an average of only
97.4 calculators . Should we conclude that performance decreases dur-
ing the final hour for all workers? (c) For 20 years the basketball coach recorded
his team’s performance when making free throws, with and .
A sports psychologist trained 20 players on this year’s team to visualize each shot
beforehand. They shot an average of 77.6 for the year. Is visualization a way to
improve the performance of all players? (Chs. 4, 5, 7, 8, 10, 11)
σ
X
5 14.2 5 71.1
1s
X
5 17.32
p 6 .001p 5 .031
r
S
r
■ ■ ■ SUMMARY OF
FORMULAS
1. To perform the one-sample t-test,
Values of are found in Table 2 of Appendix
C, for .df 5 N 2 1
t
crit
t
obt
5
X 2
s
X
s
X
5
B
s
2
X
N
s
2
X
5
©X
2
2
1©X2
2
N
N 2 1
2. The formula for a confidence interval for a single
is
where is the two-tailed value for .
3. Critical values of the Pearson are found in
Table 3 of Appendix C, using ,
where is the number of pairs.
4. Critical values of the Spearman are found in
Table 4 of Appendix C, using , the number of
pairs.
N
r
S
N
df 5 N 2 1
r
df 5 N 2 1t
crit
1s
X
212t
crit
21 X # # 1s
X
211t
crit
21 X

GETTING STARTED
To understand this chapter, recall the following:
■
From Chapter 2, what the terms condition, independent variable, and
dependent variable refer to.
■
From Chapter 4, how to graph the results of experiments.
■
From Chapter 8, how to interpret the proportion of variance
accounted for.
■
From Chapter 11, what a confidence interval indicates and what you’ve
learned about inferential statistics.
Your goals in this chapter are to learn
■
The logic of a two-sample experiment.
■
The difference between independent samples and related samples.
■
How to perform the independent-samples t-test and related-samples t-test.
■
How to compute a confidence interval for the difference between two ms
and for the of difference scores.
■
How is used to describe effect size in a two-sample experiment.r
2
pb
The Two-Sample t-TEST12
260
This chapter presents the two-sample t-test, which is the major parametric procedure
used when an experiment involves two samples. As the name implies, this test is simi-
lar to the one-sample t-test you saw in Chapter 11, except that a two-sample design
requires that we use slightly different formulas. This chapter discusses (1) one version
of this t-test, called the independent-samples t-test, and its confidence interval; (2) the
other version of this t-test, called the related-samples t-test, and its confidence interval;
and (3) procedures for summarizing the results of any two-sample experiment.
NEW STATISTICAL NOTATION
So far, has stood for the number of scores in a sample. Actually, indicates the total
number of scores in the study, but with only one condition, was also the number of scores
in the sample. However, now we will be discuss experiments with two conditions, so the
lowercase with a subscript will stand for the number of scores in each sample. Thus,
is the number of scores in condition 1, and is the number of scores in condition 2. is
the total number of scores in the experiment, so adding the together equals .
REMEMBER stands for the total number of scores in an experiment;
stands for the number of scores in a condition.n
N
Nns
Nn
2
n
1
n
N
NN
Understanding the Two-Sample Experiment 261
X
Low scores
Dependent scores
f
High scores
Condition 1
XXXXXXXXXXXXXXXXX
Condition 2
X
1
⇒ μ
1
X
2
⇒ μ
1
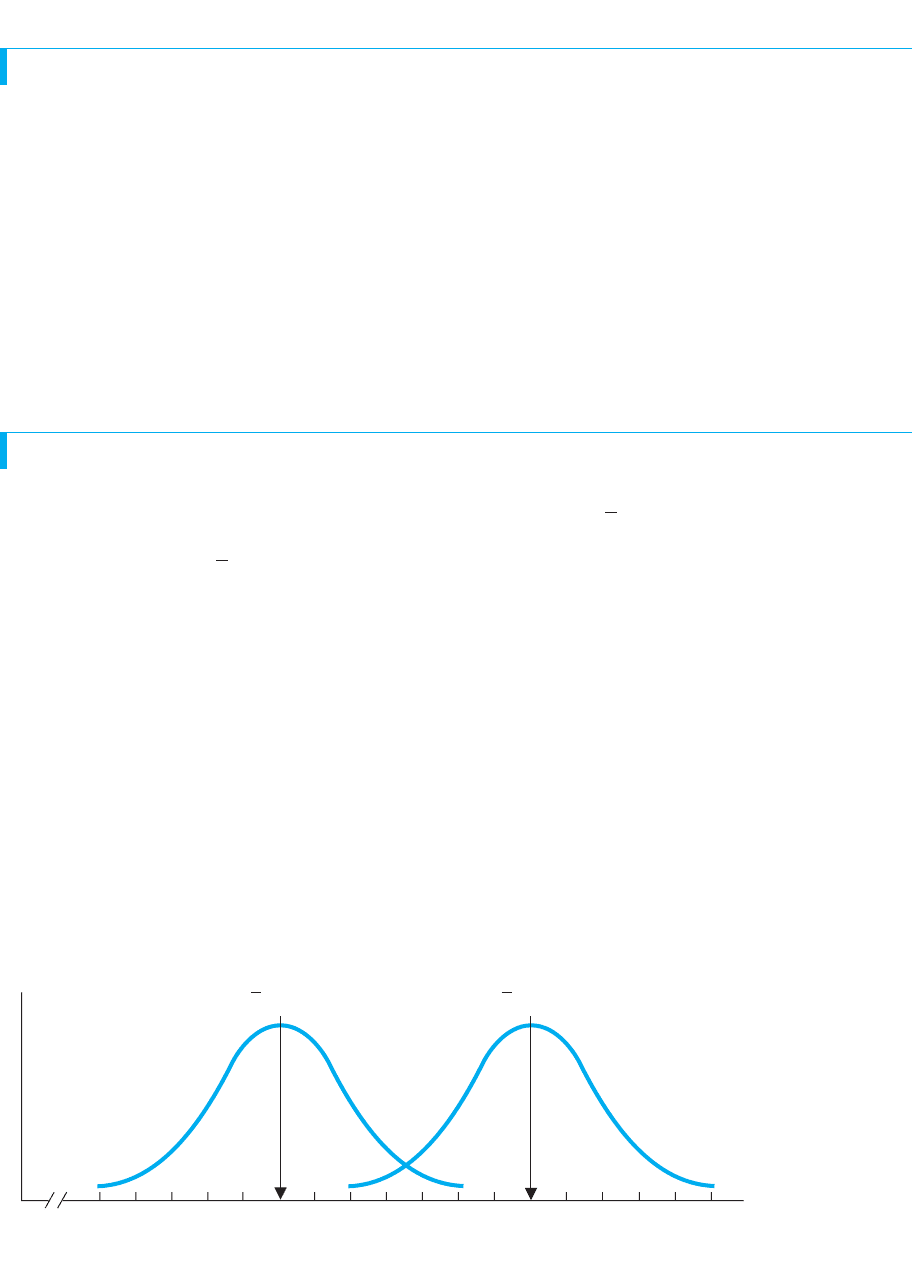
FIGURE 12.1
Relationship in the population in a two-sample experiment
As the conditions change, scores in the population tend to change.
WHY IS IT IMPORTANT TO KNOW ABOUT THE TWO-SAMPLE t-TEST?
The one-sample experiments discussed in previous chapters are not often found in real
research, because they require that we know under one condition of the independent
variable. Usually, however, researchers explore new behaviors and variables, so they
do not know any beforehand. Instead, the usual approach is to measure a sample of
participants under each condition of the independent variable and to use the sample
mean to estimate the corresponding population that would be found. Often we test
only two conditions, and then our inferential procedures involve two-sample t-tests.
Thus, it is important for you to know about these procedures because they apply to a
more realistic and common way of conducting experiments that you’ll often encounter.
Further, by understanding studies with two conditions, you will understand the more
complicated designs and analyses that we’ll discuss in the remaining chapters and that
also are common in the literature.
UNDERSTANDING THE TWO-SAMPLE EXPERIMENT
In a two-sample experiment, we measure participants’ scores under two conditions of
the independent variable. Condition 1 produces that represents , the we would
find if we tested everyone in the population under condition 1. Condition 2 produces
that represents , the we would find if we tested everyone in the population
under condition 2. A possible outcome from such an experiment is shown in Figure
12.1. If each sample mean represents a different population and for each condition,
then the experiment has demonstrated a relationship in nature.
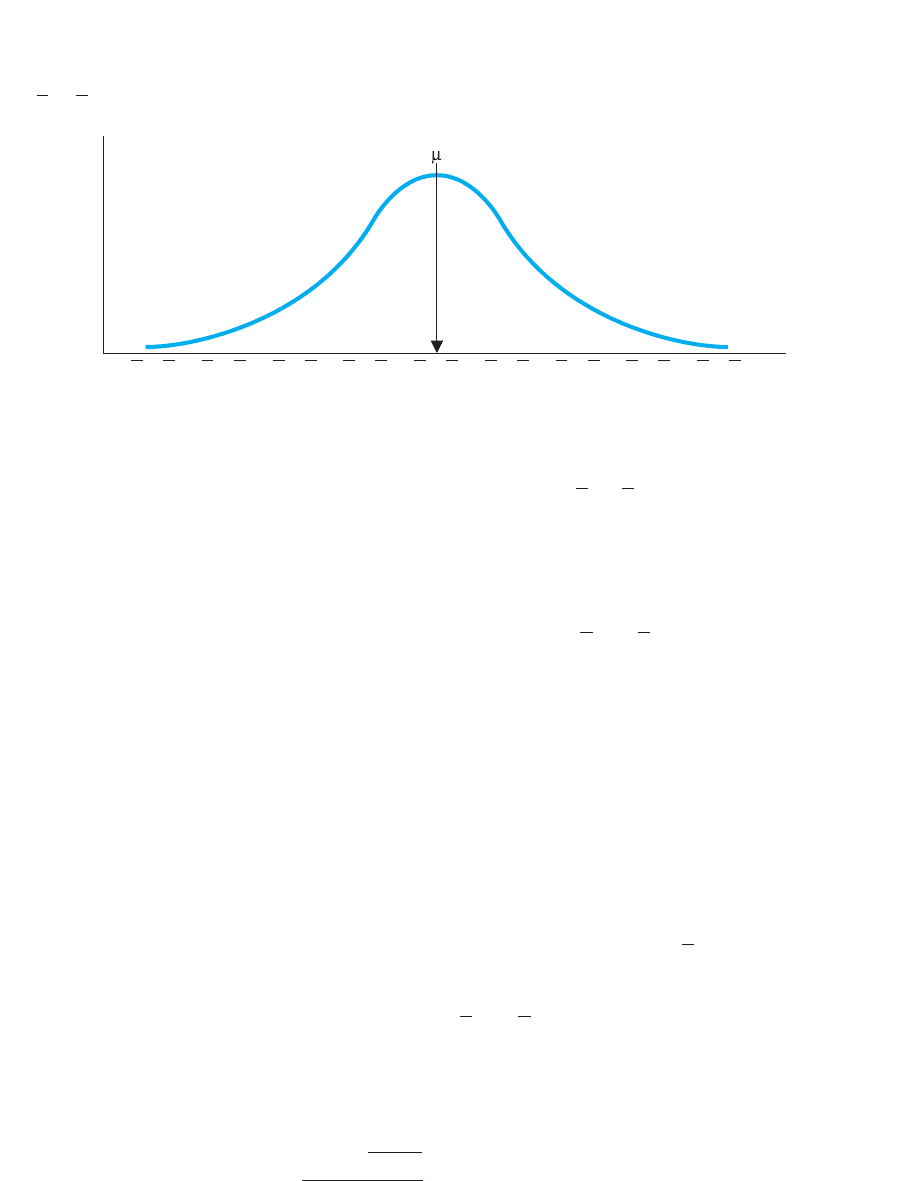
However, there is the usual problem of sampling error. Even though we may have
different sample means, the relationship may not exist in the population. Instead, if we
tested the population, we might find the same population of scores under both condi-
tions. In Figure 12.1 we might find only the lower or upper distribution, or we might
find one in-between. Then there would be only one value of : Call it or , it
wouldn’t matter because it’s the same Therefore, before we make any conclusions
about the experiment, we must determine whether the difference between the sample
means reflects sampling error.
.
2
1
2
X
2
1
X
1
s

262 CHAPTER 12 / The Two-Sample t-Test
The parametric statistical procedure for determining whether the results of a two-
sample experiment are significant is the two-sample t-test. However, we have two differ-
ent ways to create the samples, so we have two different versions of the t-test: One is
called the independent-samples t-test and the other is called the related-samples t-test.
REMEMBER The two ways to calculate the two-sample t-test are the
independent-samples t-test or the related-samples t-test.
THE INDEPENDENT-SAMPLES t-TEST
The independent-samples t-test is the parametric procedure for testing two sample
means from independent samples. Two samples are independent when we randomly
select participants for a sample, without regard to who else has been selected for either
sample. Then the scores are independent events, which, as in Chapter 9, means that the
probability of a particular score occurring in one sample is not influenced by the scores
that occur in the other sample. You can recognize independent samples by the absence
of anything fancy when selecting participants, such as creating pairs of participants or
repeatedly testing the same participants in both conditions.
Here is a study that calls for the independent-samples t-test. People who witness a
crime or other event may recall the event differently when they are hypnotized. We’ll
select two samples of participants who watch a videotape of a supposed robbery. Later,
one group will be hypnotized and then answer 30 questions about the event. The other
group will answer the questions without being hypnotized. Thus, the conditions of
the independent variable are the presence or absence of hypnosis, and the dependent
variable is the amount of information correctly recalled. This design is shown in
Table 12.1. After replacing the with the actual recall scores, we will compute the
mean of each condition (each column). If the means differ, we’ll have evidence of a
relationship where, as amount of hypnosis changes, recall scores also change.
First, as always, we check that the study meets the assumptions of the statistical test.
In addition to requiring independent samples, this t-test also requires
1. The dependent scores measure an interval or ratio variable.
2. The populations of raw scores form at least roughly normal distributions.
3. And here’s a new one: The populations have homogeneous variance. Homogene-
ity of variance means that the variances of the populations being represented are
equal. That is, we assume that if we computed for each population, we would
have the same answer each time.
4. It is not required that each condition have the same , but the should not be mas-
sively unequal—a difference in the neighborhood of 10 to 20 is best. (The more the
differ from each other, the more important it is to have homogeneity of variance.)
You’ll know if you meet these assumptions by seeing how the vari-
ables are treated in previously published research related to your study.
Statistical Hypotheses for the
Independent-Samples t-Test
As usual, we may have a one- or a two-tailed test. For now, say that
we don’t predict whether hypnosis will increase or decrease recall
scores so we have a two-tailed test.
ns
nsn
σ
2
X
Xs
No Hypnosis Hypnosis
Recall XX
Scores XX
➝
XX
XX
XX
X
X
TABLE 12.1
Diagram of Hypnosis
Study using an
Independent-Samples
Design
The independent variable
is amount of hypnosis,
and the dependent
variable is recall.

The Independent-Samples t-Test 263
First, the alternative hypothesis: A relationship exists if one population mean is
larger or smaller than the other , producing two distributions, similar to that back in
Figure 12.1. In other words, should not equal . We could state this as
, but there is a better way. If the two are not equal, then their difference does not equal
zero. Thus, the two-tailed alternative hypothesis for our study is
implies that the means from our two conditions each represent a different popula-
tion of recall scores having a different , so a relationship is present.
Of course, there’s also our old nemesis, the null hypothesis. Perhaps there is no rela-
tionship, so if we tested everyone under the two conditions, we would find the same
population and . In other words, equals . We could state this as ,
but, again, there is a better way. If the two are equal, then their difference is zero.
Thus, our two-tailed null hypothesis is
implies that both samples represent the same population of scores, having the same
, so a relationship is not present. If our sample means differ, it’s because of sampling
error in representing that one .
Notice that these hypotheses do not contain a specific value of . Therefore, these
are the two-tailed hypotheses for any independent-samples t-test, when you are testing
an that says there is zero difference between the populations. This is the most com-
mon approach and the one that we’ll use. (Consult an advanced statistics book to test
for nonzero differences.)
As usual, we test the null hypothesis, and to do that we examine the sampling
distribution.
The Sampling Distribution for the
Independent-Samples t-Test
To understand the sampling distribution here, say that we find a mean recall score of 20
in the no-hypnosis condition and a mean of 23 in the hypnosis condition. We can sum-
marize these results by looking at the difference between the means: Changing from no
hypnosis to hypnosis results in a difference in mean recall of 3 points. We always test
by finding the probability of obtaining our results when there is not a relationship,
so here we will determine the probability of obtaining a difference of 3 between two
when they both actually represent the same .
REMEMBER The independent-samples t-test determines the probability of
obtaining our difference between when is true.
You can think of the sampling distribution as follows. Using the same as in our
study, we select two random samples from one raw score population. (Just like says
we did in our study.) We compute the two sample means and subtract one from the other.
The result is the difference between the means, which we symbolize by . We do
this an infinite number of times and plot a frequency distribution of these differences,
producing the sampling distribution of differences between means. This is the distri-
bution of all possible differences between two means when they are drawn from one raw
score population. You can envision this sampling distribution as shown in Figure 12.2.
On the axis, each score is the difference between two randomly selected sample
means. The axis is labeled twice, first using the symbols of and, beneath them,X
1
2 X
2
X
X
1
2 X
2
H
0
ns
H
0
Xs
Xs
H
0
H
0
H
0
H
0
:
1
2
2
5 0
s
H
0
:
1
5
2
2
1
H
a
H
a
:
1
2
2
? 0
s
H
a
:
1
?
2
2
1
1
2
2
1
1
2
264 CHAPTER 12 / The Two-Sample t-Test
f
X
1
– X
2
X
1
– X
2
X
1
– X
2
X
1
– X
2
X
1
– X
2
X
1
– X
2
X
1
– X
2
X
1
– X
2
X
1
– X
2
Differences:
Values of t:
. . .. . .
–1 +1 +2 +3 +4 +5 +6 +7 +8–2–3–4–5–6–7–8 0
FIGURE 12.2
Sampling distribution of differences between means when H
0
:
1
2
0
Each symbolizes the difference between two sample means. Larger differences are less likely when is true.H
0
X
1
2 X
2
52
actual differences we might find. The mean of the sampling distribution is zero because,
most often, both sample means will equal the of the population of raw scores, so their
difference will be zero. However, sometimes is larger, so the difference will be
a positive or negative amount. Small negative or positive differences will occur relatively
frequently, but larger differences occur less frequently. The larger the difference between
the means, the farther into the tail of the distribution it lies.
To test , we determine where our difference between means lies on this sampling dis-
tribution. To do so, we compute a new version of but it provides information similar to
previous t-tests: A difference of zero between , located at the of the distribu-
tion, produces a of zero. A positive difference produces a positive and a negative
difference produces a negative . Larger differences between the means are further into a
tail of the distribution and have a larger . Therefore, if the difference between our sam-
ple means produces a close to the center of the distribution, then our difference occurs
frequently when is true: In our example, our two samples are likely to represent the
same population of recall scores. But, if places our difference beyond , far into a
tail of the sampling distribution, then this difference is unlikely when is true: Our two
samples are unlikely to represent the same population of recall scores.
So now we compute .
Computing the Independent-Samples t-Test
In the previous chapter, you computed by computing and then performing three
steps: (1) estimating the variance of the raw score population, (2) computing the esti-
mated standard error of the sampling distribution, and (3) computing . For the two-
sample t-test, after computing and , you perform three similar steps.
Estimating the Population Variance First, calculate for each condition, using
the formula
Each time, use the from only one condition, and is the number of scores in that
condition.
nXs
s
2
X
5
©X
2
2
1©X2
2
n
n 2 1
s
2
X
X
2
X
1
t
obt
Xt
obt
t
obt
H
0
t
crit
t
obt
H
0
t
obt
t
obt
t
obt
t
obt
t
obt
X
1
and X
2
t
obt
H
0
X
1
or X
2

The Independent-Samples t-Test 265
This will give us and , and each is an estimate of the population variance. How-
ever, each may contain sampling error. (Because of this, if does not equal , we
have not necessarily violated the assumption of homogeneity of variance.) To obtain
the best estimate, we compute a “weighted average” of the two variances. The
“weight” we give to each variance is based on the number of participants in a sample,
using each sample’s This weighted average is called the pooled variance, and its
symbol is .s
2
pool
df.
s
2
2
s
2
1
s
2
2
s
2
1
This says to multiply the from each sample times for that sample. Then add
the results together and divide by the sum of .
For example, say that the hypnosis study produced the results shown in Table 12.2.
Let’s label the hypnosis condition as condition 1, so it produces , and . The
no-hypnosis condition produces , , and . Filling in the above formula, we have
In the numerator, 16 times 9 is 144, and 14 times 7.5 is 105. In the denominator, 16 plus
14 is 30, so
Thus, we estimate that the variance of the population of recall scores represented by
our samples is 8.30.
Computing the Standard Error of the Difference The next step is to use
to compute the standard error of the sampling distribution. It is called the standard error
of the difference. The standard error of the difference is the estimated “standard
deviation” of the sampling distribution of differences between the means. The symbol
for the standard error of the difference is . (The subscript indicates that we are
dealing with differences between pairs of means.)
In the previous chapter, we computed the standard error by dividing the variance by
and then taking the square root. However, instead of dividing by , we can multiplyNN
s
˛˛X
1
2X
2
s
2
pool
s
2
pool
5
144 1 105
30
5
249
30
5 8.30
s
2
pool
5
117 2 129.0 1 115 2 127.5
117 2 121 115 2 12
n
2
s
2
2
X
2
n
1
s
2
1
X
1
1n
1
2 121 1n
2
2 12
n 2 1s
2
X
Condition 1: Condition 2:
Hypnosis No Hypnosis
Mean details recalled
Number of participants
Estimated variance s
2
2
5 7.5s
2
1
5 9.0
n
2
5 15n
1
5 17
X
2
5 20X
1
5 23
TABLE 12.2
Data from the Hypnosis
Study
The formula for the pooled variance is
s
2
pool
5
1n
1
2 12s
2
1
1 1n
2
2 12s
2
2
1n
1
2 121 1n
2
2 12

by . Then, for the two-sample t-test, we substitute the pooled variance and our two
, producing this formula:ns
1>N
266 CHAPTER 12 / The Two-Sample t-Test
To use this formula, first reduce the fractions and to decimals. Then add them
together and multiply the sum times . Then find the square root.
For the hypnosis study, is 8.30, is 17, and is 15. Thus:
First, is .059 and is .067. Their sum is .126. Then
Thus, is 1.023.
Computing In previous chapters we found how far the result of the study
was from the mean of the sampling distribution , measured in standard error
units. In general, this formula is
Now the “result of the study” is the difference between the two sample means, so in the
formula we will put in . Likewise, instead of one we have the difference
described by , so we put in Finally, we replace “standard error” with
All together we have
s
X
1
2X
2
.
1
2
2
.H
0
X
1
2 X
2
t
obt
5
1result of the study22 1mean of H
0
sampling distribution2
standard error
12H
0
1X2t
obt
s
X
1
2X
2
s
X
1
2X
2
5 18.31.12625 11.046 5 1.023
1>151>17
s
X
1
2X
2
5
B
8.3 a
1
17
1
1
15
b
n
2
n
1
s
2
pool
s
2
pool
1>n
2
1>n
1
Here, and are our sample means, is computed as above, and the value of
is the difference specified by the null hypothesis. This value is always 0
(unless you are testing for a nonzero difference.)
For the hypnosis study, our sample means were 23 and 20, the difference between
and is 0, and is 1.023. Therefore,
t
obt
5
123 2 2022 0
1.023
5
113.022 0
1.023
5
13.0
1.023
512.93
s
X
1
2X
2
2
1
1
2
2
s
X
1
2X
2
X
2
X
1
The formula for the standard error of the difference is
s
X
1
2X
2
5
B
1s
2
pool
2a
1
n
1
1
1
n
2
b
The formula for the independent-samples t
obt
is
t
obt
5
1X
1
2 X
2
22 1
1
2
2
2
s
X
1
2X
2

Our is . Thus, the difference of between our sample means is located at
something like a z-score of on the sampling distribution of differences produced
when both samples represent the same population.
12.93.
13.012.93t
obt
To compute the independent-samples :
■
Compute , and ; , and .
■
Then compute the pooled variance .
■
Then compute the standard error of the difference
.
■
Then compute .
MORE EXAMPLES
An independent-samples study produced the follow-
ing data: , , , ,
, and .
5
B
34.5 a
1
11
1
1
11
b5 2.506
s
X
1
2X
2
5
B
s
2
pool
a
1
n
1
1
1
n
2
b
5
110236 1 110233
10 1 10
5 34.5
s
2
pool
5
1n
1
2 12s
2
1
1 1n
2
2 12s
2
2
1n
1
2 121 1n
2
2 12
n
2
5 11s
2
2
5 33
X
2
5 21n
1
5 11s
2
1
5 36X
1
5 27
t
obt
1s
X
1
2X
2
2
1s
2
pool
2
n
2
s
2
2
X
2
n
1
s
2
1
X
1
t
obt
For Practice
We find , , , ,
and .
1. Compute the pooled variance .
2. Compute the standard error of the difference
.
3. Compute .
Answers
1.
2.
3. t
obt
5
133 2 2722 0
1.18
515.08
s
X
1
2X
2
5
B
14.5 a
1
21
1
1
21
b5 1.18
s
2
pool
5
120216 1 120213
20 1 20
5 14.5
t
obt
1s
X
1
2X
2
2
1s
2
pool
2
n
2
5 21s
2
2
5 13
X
2
5 27n
1
5 21s
2
1
5 16X
1
5 33
512.394
t
obt
5
1X
1
2 X
2
22 1
1
2
2
2
s
X
1
2X
2
5
127 2 2122 0
2.506
A QUICK REVIEW
Interpreting the Independent-Samples t-Test
To determine if is significant, we compare it to , which is found in the t-tables
(Table 2 in Appendix C). As usual, we obtain using degrees of freedom, but with
two samples, the are computed differently: Now the degrees of freedom equals
.
REMEMBER Critical values of for the independent-samples t-test are found
for .
Another way of expressing this is .
For the hypnosis study, and , so .
With alpha at , the two-tailed is Figure 12.3 locates these values on the
sampling distribution of differences.
The sampling distribution shows the frequency of various differences between sam-
ple means that occur when the samples really represent no difference in the population.
Our says that the difference between our sample means is merely a poor representa-
tion of no difference. But, looking at the sampling distribution, we see that our differ-
ence of hardly ever occurs when the samples represent no difference. In fact our t
obt
13
H
0
;2.042.t
crit
.05
df 5 117 2 121 115 2 125 30n
2
5 15n
1
5 17
df 5 1n
1
1 n
2
22 2
df 5 1n
1
2 121 1n
2
2 12
t
1n
1
2 121 1n
2
2 12
df
t
crit
t
crit
t
obt
The Independent-Samples t-Test 267