Heiman G. Basic Statistics for the Behavioral Sciences
Подождите немного. Документ загружается.


298 CHAPTER 13 / The One-Way Analysis of Variance
which produces a larger . Turning this around, the larger the , the more it
appears that is true. Putting this all together:
The larger the , the less likely it is that H
0
is true and the more likely it
is that H
a
is true.
If our is large enough to be beyond , we will conclude that is so unlikely to
be true that we will reject and accept .
REMEMBER If is true, should equal 1 or be close to 1. The larger the
, the less likely that is true and the more likely that is true.
Before moving on to the computations, we will briefly discuss the underlying com-
ponents that represents in the population.
The Theoretical Components of the F-ratio
To fully understand the -ratio, we need to understand what and represent
in the population. We saw that estimates the variance of individual scores in the
population Statisticians also call this variance the error variance, symbolized by
. Thus, the is an estimate of (The is also referred to as the “error
term” in the -ratio.)
When is true and we have only one population, the also estimates . We saw
that with one population, the variability of sample means depends on the variability of indi-
vidual scores. Thus, although is computed using sample means, it ultimately reflects
the variability among the scores, which is . Therefore, when is true, the reason that
should equal is because both reflect the error variance in that one population.
In symbols then, here is what the -ratio represents in the population when is true.
Both mean squares are merely estimates of the one value of , so they should be
equal, and so their ratio equals 1.
On the other hand, if is false and is true, then more than one population is
involved. By measuring the differences between the means of our conditions, will
measure this treatment effect. Statisticians refer to the differences between the popula-
tions produced by a factor as the treatment variance, which is symbolized as .
Thus, is an estimate of .
However, even if a factor does produce different populations, our samples will not
perfectly represent them because of sampling error. Therefore, to some extent, the dif-
ferences between our means, as measured by the , will still reflect the variability
in scores, which we call error variance. Thus, estimates both treatment variance
plus error variance. Altogether, here is what the -ratio represents in the population
when is false and is true.
Sample Estimates Population
F
obt
M
M
S
S
w
bn
n
→
→
F 1
In the denominator, the is still the same estimate of . In the numerator,
however, the larger the differences between the conditions, the larger is the σ
2
treat
σ
2
error
MS
wn
σ
2
error
1 σ
2
treat
σ
2
error
H
a
H
0
F
MS
bn
MS
bn
σ
2
treat
MS
bn
σ
2
treat
MS
bn
H
a
H
0
σ
2
error
Sample Estimates Population
F
obt
M
M
S
S
w
bn
n
→
→
σ
σ
2
e
2
e
r
r
r
r
o
o
r
r
1
H
0
F
MS
wn
.MS
bn
H
0
σ
2
error
MS
bn
σ
2
error
MS
bn
H
0
F
MS
wn
σ
2
error
.MS
wn
σ
2
error
1σ
2
X
2.
MS
wn
MS
wn
MS
bn
F
F
obt
H
a
H
0
F
obt
F
obt
H
0
H
a
H
0
H
0
F
crit
F
obt
F
obt
H
a
F
obt
F
obt
Performing the ANOVA 299
component, and so the larger will be . A larger numerator produces an that is
greater than 1. Thus, when is true, regardless of whether we have a positive, nega-
tive, or curvilinear relationship, simply will be larger than , so that is
greater than 1. This is why we test only two-tailed hypotheses. (Technically, this for-
mula is always used to describe what represents, even when is true. The
always estimates the amount of that is present, but when is true, this amount is
zero. This produces the equivalent of the previous formula where .)
REMEMBER An equal to (or less than) 1 indicates that is true. An
greater than 1 may result from sampling error, or it may indicate a treat-
ment effect in the population. A significant indicates that the means from
the conditions are likely to represent two or more .s
F
obt
F
obt
H
0
F
obt
F
obt
5 1
H
0
σ
2
treat
MS
bn
H
0
F
obt
F
obt
MS
wn
MS
bn
H
a
F
obt
MS
bn
■
The measures the differences among level
means (which may reflect treatment variance in the
population).
■
The measures the differences among individ-
ual scores (which reflects error variance in the pop-
ulation).
■
.
MORE EXAMPLES
In a study, , , and . The
equals the only when all samples belong
to the same population. Therefore, we retain the
that all conditions represent the same population. Say,
instead, that , , and .
Because is so much larger than , at least
two conditions might represent different populations
(with reflecting ). If is beyond ,
these results are unlikely to be due to sampling error,
so we accept the that at least two conditions repre-
sent different populations.
H
a
F
crit
F
obt
σ
2
treat
MS
bn
MS
wn
MS
bn
F
obt
5 4MS
wn
5 6MS
bn
5 24
H
0
MS
wn
MS
bn
F
obt
5 1MS
wn
5 6MS
bn
5 6
F
obt
5
MS
bn
MS
wn
MS
wn
MS
bn
For Practice
1. is the symbol for ____, and is the sym-
bol for _____.
2. Differences produced by the independent variable
are called the ____ effect, and in the population,
are measured as ____.
3. Differences among the scores in the data are meas-
ured by ____ in the sample to estimate the popula-
tion ____.
4. When is true, should equal ____.
5. When is false, will be ____.
Answers
1. mean square within groups; mean square between
groups
2. treatment; treatment variance or
3. ; error variance, or
4. 1 or close to 1
5. greater than 1
σ
2
error
MS
wn
σ
2
treat
F
obt
H
0
F
obt
H
0
MS
bn
MS
wn
A QUICK REVIEW
PERFORMING THE ANOVA
Now we can discuss the computations involved in performing the ANOVA. Recall from
the beginning of this chapter that we changed the formula for the variance into comput-
ing a mean square by dividing the sum of squares by the degrees of freedom. In sym-
bols, this is
MS 5
SS
df

300 CHAPTER 13 / The One-Way Analysis of Variance
Factor A: Perceived Difficulty
Level A
1
: Level A
2
: Level A
3
:
Easy Medium Difficult
941
12 6 3
484
825
7102 Totals
⌺X ⫽ 40 ⌺X ⫽ 30 ⌺X ⫽ 15 ⌺X
tot
⫽ 85
⌺X
2
⫽ 354 ⌺X
2
⫽ 220 ⌺X
2
⫽ 55 ⌺X
2
tot
⫽ 629
n
1
⫽ 5 n
2
⫽ 5 n
3
⫽ 5 N ⫽ 15
X
苶
1
⫽ 8 X
苶
2
⫽ 6 X
苶
3
⫽ 3 k ⫽ 3
TABLE 13.4
Data from Perceived
Difficulty Experiment
Adding subscripts, we will compute the mean square between groups by com-
puting the sum of squares between groups and dividing by the degrees of freedom
between groups . Likewise, we will compute the mean square within groups
by computing the sum of squares within groups and dividing by the degrees of
freedom within groups . Once we have and , we can compute .
If all this strikes you as the most confusing thing ever devised, you’ll find an ANOVA
summary table very helpful. Here is its general format:
Summary Table of One-Way ANOVA
Source Sum of Squares df Mean Square F
Between SS
bn
df
bn
MS
bn
F
obt
Within SS
wn
df
wn
MS
wn
Total SS
tot
df
tot
The source column identifies each source of variation, either between, within, or total.
In the following sections, we’ll compute the components for the other columns.
Computing the
Say that we performed the perceived difficulty study discussed earlier, telling partici-
pants that some math problems are easy, of medium difficulty, or difficult and then
measured the number of problems they solved. The data are presented in Table 13.4.
As shown in the following sections, there are four parts to computing , finding
(1) the sum of squares, (2) the degrees of freedom, (3) the mean squares, and (4)
So that you don’t get lost, fill in the ANOVA summary table as you complete each step.
(There will be a test later.)
Computing the Sums of Squares The first task is to compute the sum of squares.
Do this in four steps.
Step 1 Compute the sums and means. As in Table 13.4, compute , , and for
each level (each column). Then add together the from all levels to get the total, which
is . Also, add together the from all levels to get the total, which is .©X
2
tot
©X
2
s©X
tot
©Xs
X©X
2
©X
F
obt
.
F
obt
F
obt
F
obt
MS
wn
MS
bn
1df
wn
2
1SS
wn
2
1MS
wn
21df
bn
2
1SS
bn
2
1MS
bn
2

Performing the ANOVA 301
Step 2 Compute the total sum of squares .1SS
tot
2
The is the sum of all , and is the sum of all squared . is the total
in the study.
Using the data from Table 13.4, , , and , so
so
and
Step 3 Compute the sum of squares between groups .1SS
bn
2
SS
tot
5 629 2 481.67 5 147.33
SS
tot
5 629 2
7225
15
SS
tot
5 629 2
1852
2
15
N 5 15©X
tot
5 85©X
2
tot
5 629
NNXs©X
2
tot
Xs©X
tot
Back in Table 13.4, each column represents a level of the factor. Thus, find the
for a level, square the , and then divide by the in that level. After doing this
for all levels, add the results together and subtract the quantity Thus,
we have
so
and
SS
bn
5 545 2 481.67 5 63.33
SS
bn
5 1320 1 180 1 4522 481.67
SS
bn
5 a
1402
2
5
1
1302
2
5
1
1152
2
5
b2 a
1852
2
15
b
1©X
tot
2
2
>N.
n©X
©X
The formula for the total sum of squares is
SS
tot
5 ©X
2
tot
2 a
1©X
tot
2
2
N
b
The formula for the sum of squares between groups is
SS
bn
5 © a
1Sum of scores in the column2
2
n of scores in the column
b2 a
1©X
tot
2
2
N
b

302 CHAPTER 13 / The One-Way Analysis of Variance
In the example, is 147.33 and is 63.33, so
Filling in the first column of the ANOVA summary table, we have
Source Sum of Squares df Mean Square F
Between 63.33 df
bn
MS
bn
F
obt
Within 84.00 df
wn
MS
wn
Total 147.33 df
tot
As a double check, make sure that the total equals the between plus the within. Here,
.
Now compute the degrees of freedom.
Computing the Degrees of Freedom We compute , , and , so there
are three steps.
1. The degrees of freedom between groups equals , where is the number
of levels in the factor. This is because when computing we essentially
have a sample containing the means from our levels that we determine the vari-
ability of. For we reduce the number in the sample by 1, so out of means,
. In the example, with three levels of perceived difficulty, .
Thus, .
2. The degrees of freedom within groups equals , where is the total in the
experiment and is the number of levels in the factor. This is because when com-
puting we essentially find the estimated variance in each condition and pool
them. In each condition we compute the variance using , so out of the entire
experiment , we subtract one per condition, subtracting a total of In the
example, is 15 and is 3, so .
3. The degrees of freedom total equals , where is the total in the
experiment. This is because when computing the total we treat the experiment
as one sample. Then we have scores, so the is . In the example, is
15, so .
The Thus, to check our work, , which
equals 14, the .df
tot
df
bn
1 df
wn
5 2 1 12df
tot
5 df
bn
1 df
wn
.
df
tot
5 15 2 1 5 14
NN 2 1dfN
SS
NNN 2 1
df
wn
5 15–3 5 12kN
k.1N2
n 2 1
MS
wn
k
NNN 2 k
df
bn
5 2
k 5 3df 5 k 2 1
kdf
MS
bn
kk 2 1
df
tot
df
wn
df
bn
63.33 1 84.00 5 147.33
SS
wn
5 147.33–63.33 5 84.00
SS
bn
SS
tot
Step 4 Compute the sum of squares within groups . We use a shortcut to com-
pute . Mathematically, equals plus . Therefore, the total minus the
between leaves the within.
SS
wn
SS
bn
SS
tot
SS
wn
1SS
wn
2
The formula for the sum of squares within groups is
SS
wn
5 SS
tot
2 SS
bn

Performing the ANOVA 303
Adding the to the summary table, it looks like this:
Source Sum of Squares df Mean Square F
Between 63.33 2 MS
bn
F
obt
Within 84.00 12 MS
wn
Total 147.33 14
Now find each mean square.
Computing the Mean Squares You can work directly from the summary table to
compute the mean squares. Any mean square equals the appropriate sum of squares
divided by the corresponding . Thus,df
df
From the summary table, we see that
MS
bn
5
63.33
2
5 31.67
For the example,
Do not compute the mean square for because it has no use.
Now in the summary table we have
Source Sum of Squares df Mean Square F
Between 63.33 2 31.67 F
obt
Within 84.00 12 7.00
Total 147.33 14
SS
tot
MS
wn
5
84
12
5 7.00
The formula for the mean square between groups is
MS
bn
5
SS
bn
df
bn
The formula for the mean square within groups is
MS
wn
5
SS
wn
df
wn

304 CHAPTER 13 / The One-Way Analysis of Variance
Computing the F Finally, compute F
obt
.
Notice that in the formula, is “over” , and this is how they are positioned
in the summary table. In our example, is 31.67 and is 7.00, so
Now the completed ANOVA summary table is
Source Sum of Squares df Mean Square F
Between 63.33 2 31.67 4.52
Within 84.00 12 7.00
Total 147.33 14
The is always placed in the row labeled “Between” because the is testing
for significant differences between our conditions. Also, in the source column you
may see (1) the name of the factor at “Between,” and (2) the word “Error” in place of
“Within.”
Interpreting
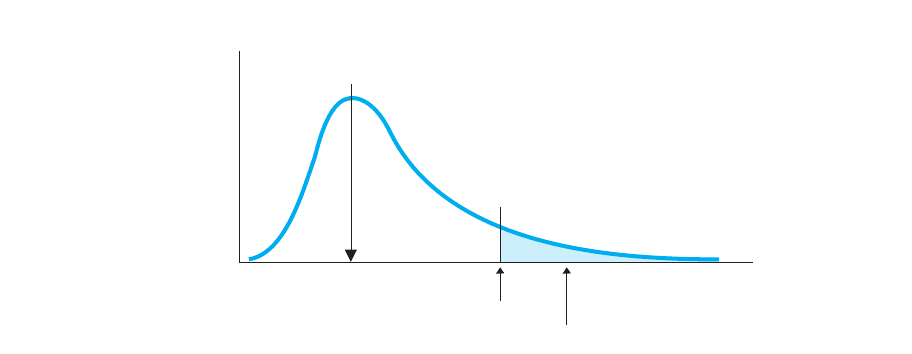
We interpret by comparing it to , and for that we examine the -distribution.
The F-distribution is the sampling distribution showing the various values of that
occur when is true and all conditions represent one population. To create it, it is as
if, using our and , we select the scores for all of our conditions from one raw score
population (like says we did in our experiment) and compute , and then
. We do this an infinite number of times, and plotting the , produce the sampling
distribution, as shown in Figure 13.1.
The -distribution is skewed because there is no limit to how large can be, but it
cannot be less than zero. The mean of the distribution is 1 because, most often when
is true, will equal , so will equal 1. The right-hand tail shows that
sometimes, by chance, is greater than 1. Because our can reflect a relationship in
the population only when it is greater than 1, the entire region of rejection is in this
upper tail of the -distribution. (That’s right, ANOVA involves two-tailed hypotheses,
but they are tested using only the upper tail of the sampling distribution.)
F
F
obt
F
FMS
wn
MS
bn
H
0
F
obt
F
FsF
obt
MS
bn
MS
wn
H
0
kns
H
0
F
FF
crit
F
obt
F
obt
F
obt
F
obt
F
obt
5
MS
bn
MS
wn
5
31.67
7.00
5 4.52
MS
wn
MS
bn
MS
wn
MS
bn
The formula for is
F
obt
5
MS
bn
MS
wn
F
obt
Performing the ANOVA 305
f
F
crit
= 3.88
α = .05
μ
F
0
1.0FFFF F FF F FFFF
F
obt
= 4.52
FIGURE 13.1
Sampling distribution of
F when H
0
is true for
df
bn
2 and df
wn
1255
There are actually many -distributions, each having a slightly different shape,
depending on our degrees of freedom. However, two values of determine the shape
of an -distribution: the used when computing the mean square between groups
and the used when computing the mean square within groups . There-
fore, to obtain , turn to Table 5 in Appendix C, entitled “Critical Values of .”
Across the top of the tables, the columns are labeled “Degrees of Freedom Between
Groups.” Along the left-hand side, the rows are labeled “Degrees of Freedom Within
Groups.” Locate the appropriate column and row, using the from your study. The
critical values in dark type are for , and those in light type are for . For
our example, and . For , the is 3.88. (If your are
not in the table, then for from 30 to 50, your is the average of the two critical
values shown for the bracketing that are given. For above 50, compare to the
two critical values for the in the table that bracket your , using the same strategy
we discussed for t-tests in Chapter 11.)
Thus, in our perceived difficulty study, is 4.52 and is 3.88 as above in Fig-
ure 13.1. Our says that is greater than 1 because of sampling error and that actu-
ally we are poorly representing no relationship in the population. However, our is
beyond , so we reject : Our is so unlikely to occur if our samples were rep-
resenting no difference in the population that we reject that this is what they represent.
Therefore, we conclude that the is significant and that the factor of perceived diffi-
culty produces a significant difference in mean performance scores.
Of course, had been less than , then the corresponding differences between
our means would not be too unlikely to occur when is true, so we would not reject
Then, as usual, we’d draw no conclusion about our independent variable, one way
or the other. We would also consider if we had sufficient power to prevent a Type II
error (missing the relationship). We increase the power of an ANOVA using the same
strategies discussed in previous chapters: maximize the differences in scores between
conditions, minimize variability within conditions, and maximize . (These strategies
also increase the power of post hoc comparisons.)
n
H
0
.
H
0
F
crit
F
obt
F
obt
F
obt
H
0
F
crit
F
obt
F
obt
H
0
F
crit
F
obt
dfdf
F
obt
dfdf
F
crit
df
df
wn
F
crit
5 .05df
wn
5 12df
bn
5 2
5 .01 5 .05
dfs
FF
crit
1df
wn
2df1df
bn
2
dfF
df
F

306 CHAPTER 13 / The One-Way Analysis of Variance
■
To compute , compute , , and and
, , and Dividing by gives
; dividing by gives Dividing
by gives Compare to
MORE EXAMPLES
We test participants under conditions and
46
58
39
58
1. Compute the sums of squares:
SS
wn
5 SS
tot
2 SS
bn
5 32 2 24.5 5 7.5
5 a
17
2
4
1
31
2
4
b2 a
48
2
8
b5 24.5
SS
bn
5 © a
1©X in column2
2
n in column
b2
1©X
tot
2
2
N
SS
tot
5 ©X
2
tot
2
1©X
tot
2
2
N
5 320 2 a
48
2
8
b5 32
N 5 8n
2
5 4n
1
5 4
©X
2
tot
5 320©X
2
5 245©X
2
5 75
©X
tot
5 48©X 5 31©X 5 17
X 5 7.75X
1
5 4.25
A
2
A
1
A
2
.A
1
F
crit
.F
obt
F
obt
.MS
wn
MS
bn
MS
wn
.df
wn
SS
wn
MS
bn
df
bn
SS
bn
df
wn
.df
bn
df
tot
SS
wn
SS
bn
SS
tot
F
obt
2. Compute the degrees of freedom:
3. Compute the mean squares:
4. Compute :
5. Compare to : With , ,
and , The is beyond
Therefore, the means of the conditions
differ significantly.
For Practice
1. What two components are needed to compute any
mean square?
2. For between groups, to compute ____ we divide
____ by ____. For within groups, to compute ____
we divide ____ by ____.
3. Finally, equals ____ divided by ____.
Answers
1. The sums of squares and the
2. , , ; , ,
3. , MS
wn
MS
bn
df
wn
SS
wn
MS
wn
df
bn
SS
bn
MS
bn
df
F
obt
F
crit
.
F
obt
F
crit
5 5.99.df
wn
5 6
df
bn
5 1 5 .05F
crit
F
obt
F
obt
5 MS
bn
>MS
wn
5 24.5>1.25 5 19.60
F
obt
MS
wn
5 SS
wn
>df
wn
5 7.5>6 5 1.25
MS
bn
5 SS
bn
>df
bn
5 24.5>1 5 24.5
df
tot
5 N 2 1 5 8 2 1 5 7
df
wn
5 N 2 k 5 8 2 2 5 6
df
bn
5 k 2 1 5 2 2 1 5 1
A QUICK REVIEW
PERFORMING POST HOC COMPARISONS
Because we rejected and accepted , we return to the means from the levels of our
factor:
Perceived Difficulty
Easy Medium Difficult
We are confident that these means represent a relationship in the population, in which
increasing perceived difficulty is associated with fewer problems solved. However,
we do not know whether every increase in difficulty produces a significant drop in
X
3
5 3X
2
5 6X
1
5 8
H
a
H
0

Performing Post Hoc Comparisons 307
performance. Therefore, we must determine which specific means differ significantly,
and to do that, we perform post hoc comparisons.
Statisticians have developed a variety of post hoc procedures that differ in how likely
they are to produce Type I or Type II errors. We’ll discuss two procedures that have
acceptably low error rates. Depending on whether or not your are equal, perform
either Fisher’s protected t-test or Tukey’s HSD test.
Fisher’s Protected t-Test
Perform Fisher’s protected t-test when the in all levels are not equal.ns
ns
This is a variation of the independent-samples -test. We are testing ,
where and are the means for any two levels of the factor and and are the
corresponding ns in those levels. The is from our ANOVA.
It is not incorrect to perform the protected -test even when all are equal. For
example, we can compare the mean from our easy level (8) to the mean from our diffi-
cult level (3). Each is 5, and our is 7. Filling in the formula gives
Then
Next, we compare to , which we obtain from the -tables (Table 2 in
Appendix C). The here equals the from the ANOVA. For the example, with
and , is . Because the of is beyond this , the
means from the easy and difficult levels differ significantly.
To complete these comparisons, perform the protected -test on all possible pairs of
means in the factor. Thus, we would also test the means from easy and medium, and
the means from medium and difficult.
If a factor contains many levels, the protected -test becomes very tedious. If you
think there must be an easier way, you’re right.
Tukey’s HSD Multiple Comparisons Test
Perform the Tukey HSD multiple comparisons test when the in all levels are equal.
The HSD is a rearrangement of the -test that computes the minimum difference between
two means that is required for the means to differ significantly (HSD stands for the hon-
estly significant difference). There are four steps to performing the HSD test.
t
ns
t
t
t
crit
12.99t
obt
;2.179t
crit
df
wn
5 12␣ 5 .05
df
wn
df
tt
crit
t
obt
t
obt
5
15
271.42
5
15
22.80
5
15
1.673
512.99
t
obt
5
8 2 3
B
7 a
1
5
1
1
5
b
MS
wn
n
nst
MS
wn
n
2
n
1
X
2
X
1
H
0
:
1
2
2
5 0t
The formula for Fisher’s protected t-test is
t
obt
5
X
1
2 X
2
B
MS
wn
a
1
n
1
1
1
n
2
b