Heiman G. Basic Statistics for the Behavioral Sciences
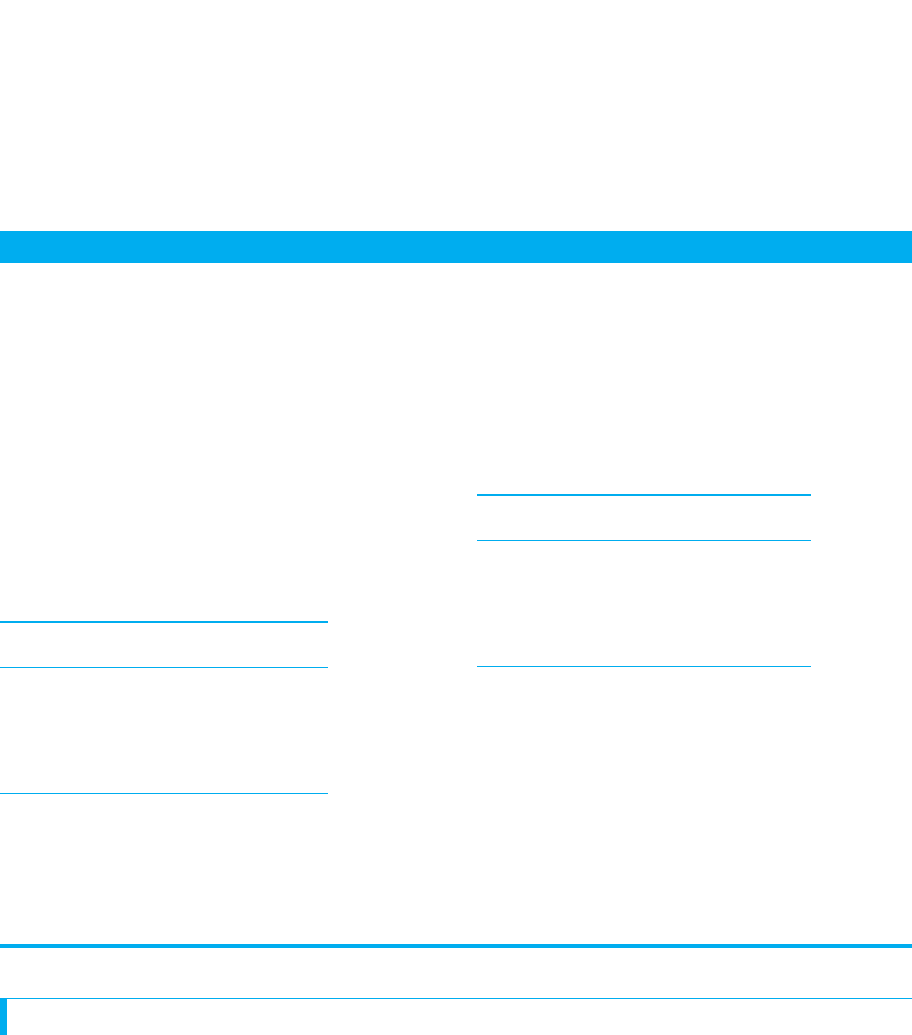
Подождите немного. Документ загружается.


Source Sum of Squares /dfⴝ Mean Square F
Between
Factor A SS
A
df
A
MS
A
⎯⎯⎯⎯→
F
A
(volume)
Factor B SS
B
df
B
MS
B
⎯⎯⎯⎯→
F
B
(gender)
Interaction SS
AB
df
AB
MS
AB
⎯⎯⎯→
F
AB
(vol gen)
Within SS
wn
df
wn
MS
wn
⎯⎯⎯
Total SS
tot
df
tot
TABLE 14.4
Summary Table of
Two-Way ANOVA
328 CHAPTER 14 / The Two-Way Analysis of Variance
The summary table in Table 14.4 shows the preceding components. (Notice that if a
component is not labeled “within” or “total,” then it is one of our many between-groups
components.) To complete the ANOVA, for factor A, divide by to produce
. For factor B, divide by to produce . For the interaction, divide
by to produce
The following sections show how to compute the above components.
Computing the Sums and Means
Your first step is to organize the data in each cell. Table 14.5 shows the persuasiveness
data, as well as the various components to compute.
Step 1 Compute and in each cell. For example, in the male–soft cell,
; Also note the of the cell
(here ) Then compute the mean for each cell (for the male–soft cell, ).
These are the interaction means.
Step 2 Compute vertically in each column. Sum the from the cells in a col-
umn (for example, for soft, ). Note the in each column (here )
and compute the mean for the scores in each column (for example, ). (Or aver-
age the cell means in the column.) These are the main effect means for factor A.
Step 3 Compute horizontally in each row. Sum the from the cells in a row
(for males, ). Note the in each row (here ) Com-
pute the mean of the scores in each row (for example, ). (Or average the
cell means in the row.) These are the main effect means for factor B.
Step 4 Compute . Sum the from the levels (columns) of factor A, so
. (Or add the from the levels of factor B.)
Step 5 Compute . Sum the from each cell, so
. Note the (here )
We will use the components from the previous five steps to compute the sums of
squares, then the degrees of freedom, then the mean squares, and finally the . To keep
track of your computations and prevent brain strain, fill in the ANOVA summary table
as you go along.
Fs
N 5 18.N56 1 470 1 116 5 2075
©X
2
tot
5 218 1 377 1 838 1©X
2
©X
2
tot
©X©X
tot
5 36 1 69 1 68 5 173
©X©X
tot
X
male
5 11.89
n 5 9.n©X 5 24 1 33 1 50 5 107
©Xs©X
X
soft
5 6
n 5 6n©X 5 24 1 12
©Xs©X
X 5 8n 5 3.
n©X
2
5 4
2
1 9
2
1 11
2
5 218.©X 5 4 1 9 1 11 5 24
©X
2
©X
F
A3B
.MS
wn
MS
A3B
F
B
MS
wn
MS
B
F
A
MS
wn
MS
A

Factor A: Volume
A
1
:A
2
:A
3
:
Soft Medium Loud
4818
912 17
B
1
:
11 13 15
Male X
苶
8 X
苶
11 X
苶
16.67 X
苶
male
11.89
©X 24 ©X 33 ©X 50 ©X 107
©X
2
218 ©X
2
377 ©X
2
838 n 9
n 3 n 3 n 3
Factor B:
Gender
29 6
610 8
B
2
:
417 4
Female X
苶
4 X
苶
12 X
苶
6 X
苶
fem
7.33
©X 12 ©X 36 ©X 18 ©X 66
©X
2
56 ©X
2
470 ©X
2
116 n 9
n 3 n 3 n 3
X
苶
soft
6 X
苶
med
11.5 X
苶
loud
11.33 ©X
tot
173
©X 36 ©X 69 ©X 68 ©X
2
tot
2075
n 6 n 6 n 6 N 18
Computing the Two-Way ANOVA 329
TABLE 14.5
Summary of Data for
3 2 ANOVA
Computing the Sums of Squares
First, compute the sums of squares.
Step 1 Compute the total sum of squares.
This says to divide by and then subtract the answer from .
From Table 14.5, , , and Filling in the formula
gives
Note: The quantity is also used when computing other sums of squares.
We call it the correction (here the correction equals 1662.72).
Step 2 Compute the sum of squares for factor A. As in the diagrams here, always have
factor A form your columns.
1©X
tot
2
2
>N
SS
tot
5 412.28
SS
tot
5 2075 2 1662.72
SS
tot
5 2075 2 a
11732
2
18
b
N 5 18.©X
2
tot
5 2075©X
tot
5 173
©X
2
tot
N1©X
tot
2
2
The formula for the total sum of squares is
SS
tot
5 ©X
2
tot
2 a
1©X
tot
2
2
N
b

330 CHAPTER 14 / The Two-Way Analysis of Variance
This says to square the in each column of factor A and divide by the in the
column. Then add the answers together and subtract the correction.
From Table 14.5, the three columns produced sums of 36, 69, and 68, and n was 6.
Filling in the above formula gives
Step 3 Compute the sum of squares for factor B. In your diagram, the levels of
factor B should form the rows.
SS
A
5 117.45
SS
A
5 1780.17 2 1662.72
SS
A
5 1216 1 793.5 1 770.6722 1662.72
SS
A
5 a
1362
2
6
1
1692
2
6
1
1682
2
6
b2 a
11732
2
18
b
n©X
This says to square the for each level of factor B and divide by the n in the level.
Then add the answers and subtract the correction.
In Table 14.5, the two rows produced sums of 107 and 66, and n was 9. Filling in the
formula gives
Step 4 Compute the sum of squares between groups for the interaction. This requires
two substeps. First, compute something called the total sum of squares between groups,
identified as .SS
bn
SS
B
5 93.39
SS
B
5 1756.11 2 1662.72
SS
B
5 a
1107
2
2
9
1
166
2
2
9
b2 1662.72
©X
The formula for the sum of squares between groups for
factor A is
SS
A
5 © a
1Sum of scores in the column2
2
n of scores in the column
b2 a
1©X
tot
2
2
N
b
The formula for the sum of squares between groups for
factor B is
SS
B
5 © a
1Sum of scores in the row2
2
n of scores in the row
b2 a
1©X
tot
2
2
N
b

Computing the Two-Way ANOVA 331
Find for each cell and divide by the n of the cell. Then add the answers together
and subtract the correction.
From Table 14.5,
The equals the sum of squares for factor A plus the sum of squares for factor B
plus the sum of squares for the interaction. Therefore, we find by subtracting
the and found above (in Steps 2 and 3) from the total Thus,SS
bn
.SS
B
SS
A
SS
A3B
SS
bn
SS
bn
5 313.61
SS
bn
5 1976.33 2 1662.72
SS
bn
5 a
1242
2
3
1
1332
2
3
1
1502
2
3
1
1122
2
3
1
1362
2
3
1
1182
2
3
b2 1662.72
1©X2
2
Above, , , and , so
Step 5 Compute the sum of squares within groups. The sum of squares within groups
plus the total sum of squares between groups equals the total sum of squares. There-
fore, subtract the total in Step 4 from the in Step 1 to obtain the .SS
wn
SS
tot
SS
bn
SS
A3B
5 102.77
SS
A3B
5 313.61 2 117.45 2 93.39
SS
B
5 93.39SS
A
5 117.45SS
bn
5 313.61
Above, and , so
The previous sums of squares are shown in Table 14.6.
Now determine the df.
SS
wn
5 98.67
SS
wn
5 412.28 2 313.61
SS
bn
5 313.61SS
tot
5 412.28
The formula for the total sum of squares between groups is
SS
bn
5 © a
1Sum of scores in the cell2
2
n of scores in the cell
b2 a
1©X
tot
2
2
N
b
The formula for the sum of squares between groups for the
interaction is
SS
A3B
5 SS
bn
2 SS
A
2 SS
B
The formula for the sum of squares within groups is
SS
wn
5 SS
tot
2 SS
bn

332 CHAPTER 14 / The Two-Way Analysis of Variance
Computing the Degrees of Freedom
1. The degrees of freedom between groups for factor A is , where is the
number of levels in factor A. (In our example, is the three levels of volume,
so )
2. The degrees of freedom between groups for factor B is , where is the num-
ber of levels in factor B. (In our example, is the two levels of gender, so )
3. The degrees of freedom between groups for the interaction is the for factor
multiplied times the for factor (In our example, and , so
)
4. The degrees of freedom within groups equals , where is the total of
the study and is the number of cells in the study. (In our example, is 18
and we have six cells, so )
5. The degrees of freedom total equals . Use this to check your previous calcu-
lations, because the sum of the above should equal (In our example
)
Place each in the ANOVA summary table as in Table 14.7. Perform the remainder
of the computations by working directly from this table. Next, we compute the mean
squares.
Computing the Mean Squares
Any mean square equals the appropriate sum of squares divided by the appropriate .
Therefore, for factor A,
df
df
df
tot
5 17.
df
tot
.dfs
N 2 1
df
wn
5 18 2 6 5 12.
Nk
A3B
NNN 2 k
A3B
df
A3B
5 2.
df
B
5 1df
A
5 2B.df
Adf
df
B
5 1.k
B
k
B
k
B
2 1
dk
A
5 2.
k
A
k
A
k
A
2 1
Source Sum of Squares df Mean Square F
Between
Factor A 117.45 df
A
MS
A
F
A
(volume)
Factor B 93.39 df
B
MS
B
F
B
(gender)
Interaction 102.77 df
AB
MS
AB
F
AB
(vol gen)
Within 98.67 df
wn
MS
wn
Total 412.28 df
tot
TABLE 14.6
Summary Table of Two-
Way ANOVA showing the
Sums of Squares
From Table 14.7 we find
MS
A
5
117.45
2
5 58.73
The formula for the mean square between groups for
factor A is
MS
A
5
SS
A
df
A

Computing the Two-Way ANOVA 333
Source Sum of Squares df Mean Square F
Between
Factor A 117.45 2 MS
A
F
A
(volume)
Factor B 93.39 1 MS
B
F
B
(gender)
Interaction 102.77 2 MS
AB
F
AB
(vol gen)
Within 98.67 12 MS
wn
Total 412.28 17
TABLE 14.7
Summary Table of
Two-Way ANOVA
with df and Sums
of Squares
From Table 14.7
MS
B
5
93.39
1
5 93.39
Using Table 14.7
MS
A3B
5
102.77
2
5 51.39
Table 14.7 gives
MS
wn
5
98.67
12
5 8.22
The formula for the mean square between groups for
factor B is
MS
B
5
SS
B
df
B
The formula for the mean square between groups for the
interaction is
MS
A3B
5
SS
A3B
df
A3B
The formula for the mean square within groups is
MS
wn
5
SS
wn
df
wn

334 CHAPTER 14 / The Two-Way Analysis of Variance
Putting the above values into the summary table gives Table 14.8.
Now, finally, compute the .
Computing F
Any equals the divided by the Therefore,MS
wn
.MS
bn
F
Fs
In our example, from Table 14.8 we have
F
A
5
58.73
8.22
5 7.14
Source Sum of Squares df Mean Square F
Between
Factor A 117.45 2 58.73 F
A
(volume)
Factor B 93.39 1 93.39 F
B
(gender)
Interaction 102.77 2 51.39 F
AB
(vol gen)
Within 98.67 12 8.22
Total 412.28 17
TABLE 14.8
Summary Table of Two-
Way ANOVA Showing
the Mean Squares, df,
and Sums of Squares
Thus, we have
F
B
5
93.39
8.22
5 11.36
The formula for F
A
for the main effect of factor A is
F
A
5
MS
A
MS
wn
The formula for F
B
for the main effect of factor B is
F
B
5
MS
B
MS
wn
The formula for F
AⴛB
for the interaction effect is
F
A3B
5
MS
A3B
MS
wn

Computing the Two-Way ANOVA 335
So
And now the finished summary table is in Table 14.9.
Interpreting Each F
Each is tested in the same way as in the previous chapter: The may be larger
than 1 because (1) is true but we have sampling error or (2) is false and at least
two means represent a relationship in the population. The larger an , the less likely
that is true. If is larger than , then we reject
To find the for a particular , in the -tables (Table 5 in Appendix ), use the
that you used in computing that and your Thus,
1. To find for testing , use as the between groups and In our
example, and So, for , the is 3.88.
2. To find for testing , use as the between groups and In our
example, and So, at , the is 4.75.
3. To find for the interaction, use as the between groups and In
our example, and Thus, at , the is 3.88.
Notice that because factors A and B have different between groups, they have dif-
ferent critical values.
Thus, we end up comparing the following:
df
F
crit
5 .05df
wn
5 12.df
A3B
5 2
df
wn
.dfdf
A3B
F
crit
F
crit
5 .05df
wn
5 12.df
B
5 1
df
wn
.dfdf
B
F
B
F
crit
F
crit
5 .05df
wn
5 12.df
A
5 2
df
wn
.dfdf
A
F
A
F
crit
df
wn
.F
obt
df
bn
CFF
obt
F
crit
H
0
.F
crit
F
obt
H
0
F
obt
H
0
H
0
F
obt
F
obt
F
A3B
5
51.39
8.22
5 6.25
Source Sum of Squares df Mean Square F
Between
Factor A 117.45 2 58.73 7.14
(volume)
Factor B 93.39 1 93.39 11.36
(gender)
Interaction 102.77 2 51.39 6.25
(vol gen)
Within 98.67 12 8.22
Total 412.28 17
TABLE 14.9
Completed Summary
Table of Two-Way
ANOVA
F
obt
F
crit
Main effect of volume (A) 7.14 3.88
Main effect of gender (B) 11.36 4.75
Interaction (A B) 6.25 3.88
By now you can do this with your eyes closed: Imagine a sampling distribution with
a region of rejection and in the positive tail. (If you can’t imagine this, look back
in Chapter 13 at Figure 13.1.) First, our of 7.14 is larger than the , so it lies in
the region of rejection. Therefore, we conclude that changing the volume of a message
produced significant differences in persuasiveness scores.
Likewise, the of 11.36 is significant, so we conclude that the males and females
in this study represent different populations of scores.
F
B
F
crit
F
A
F
crit
336 CHAPTER 14 / The Two-Way Analysis of Variance
Finally, the of 6.25 is significant, so we conclude that the effect that changing
volume has in the population depends on whether it is a population of males or a popula-
tion of females. Or we can say that the difference between the male and female popula-
tions we’d see depends on whether a message is played at soft, medium, or loud volume.
Note: It is just a coincidence of your particular data which will be significant: any
combination of the main effects and/or the interaction may or may not be significant.
Fs
F
A3B
■
A two-way ANOVA produces an for each main
effect and for the interaction.
■
Each equals the corresponding divided by
the .
■
Each equals the appropriate between
groups divided by the
MORE EXAMPLES
In a new study, our factor A tests the effect of three
doses of a smart pill (one, two, or three pills), and fac-
tor B tests two ages (10- or 20-year olds). We obtain
the and shown here.
Source SS df MS F
A(dose) 48 2 24 6.00
B (age) 8 1 8 2.00
Interaction 38 2 19 4.75
Within 72 18 4
Total 166
Then, is ; is ; is
; is . Then, is
; is ; is .
The for A is 3.55, so is significant: ChangingF
A
F
crit
19>4 5 4.75F
A3B
8>4 5 2.00F
B
24>4 5 6.00
F
A
72>18 5 4MS
wn
38>2 5 19
MS
A3B
8>1 5 8MS
B
48>2 5 24MS
A
dfsSSs
MS
wn
.
MSF
obt
df
SSMS
F
obt
dose influenced IQ. The for B is 4.41, so is not
significant. The for is 3.55, so it is signifi-
cant: The influence that changing dose had on IQ
depends on participants’ age.
For Practice
1. For this study, complete the summary table:
Source SS df MS F
A 108 3
____ ____
B 104 2 ____ ____
Interaction 252 6 ____ ____
Within 672 48 ____ ____
Total 536 59 ____ ____
2. The for is ____, the for is ____,
and the for is ____.
3. Which effects are significant?
Answers
1. , , , and ;
, , and
2. 2.80; 3.19; 2.30
3. The main effect of and the interaction effectB
F
A3B
5 3.00F
B
5 3.71F
A
5 2.57
MS
wn
5 14MS
A3B
5 42MS
B
5 52MS
A
5 36
F
A3B
F
crit
F
B
F
crit
F
A
F
crit
4 3 3
F
A3B
F
crit
F
B
F
crit
A QUICK REVIEW
INTERPRETING THE TWO-WAY EXPERIMENT
To understand and interpret the results of a two-way ANOVA, you should examine the
means from each significant main effect and interaction by graphing them and perform-
ing post hoc comparisons.
Graphing and Post Hoc Comparisons with Main Effects
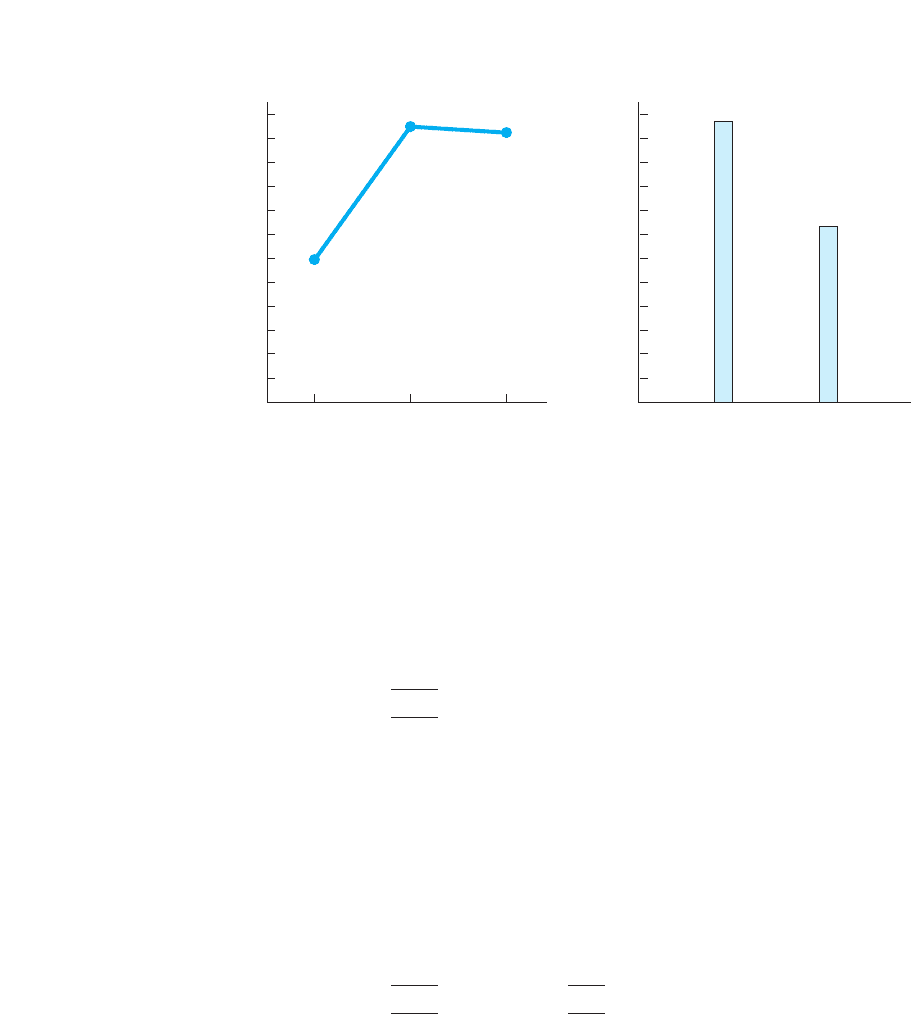
We graph each main effect separately, plotting all main effect means, even those that
the post hoc tests may indicate are not significant. As usual, label the axis as the mean
of the dependent scores and place the levels of the factor on the axis. For our volumeX
Y
Interpreting the Two-Way Experiment 337
factor, the main effect means were 6.00 for low, 11.50 for medium, and 11.33 for loud.
For gender, the means were 11.89 for males and 7.33 for females. Figure 14.1. shows
the resulting graphs. Volume is a continuous, ratio variable, so we create a line graph.
Gender is a discrete, nominal variable, so we create a bar graph.
To determine which main effect means differ significantly, we usually perform
Tukey’s HSD procedure because we usually have equal . (With unequal , perform
Fisher’s t-test, as in Chapter 13.) Recall that the formula for the HSD is
where is from the ANOVA, is from Table 6 in Appendix C for and
(where is the number of levels in the factor), and is the number of scores in a level.
But be careful here: Recall that the and were different for each main effect. In partic-
ular, the is always the number of scores used to compute each mean you are compar-
ing right now! Also, because depends on , when factors have a different , they have
different values of . Therefore, you will have a different HSD for each main effect
when or is different.
Our volume factor has three means, and each is 6. The . With ,
, and , the Thus,
The HSD for factor A is 4.41. The mean for soft (6.00) differs from the means for
medium (11.50) and loud (11.33) by more than 4.41. Thus, soft produces a significant
difference from the other volumes: increasing volume from soft to medium and from
soft to loud produced significant differences (increases) in scores. However, the means
for medium and loud differ by less than 4.41, so these conditions do not differ signifi-
cantly: Increasing volume from medium to loud did not produce a significant change in
scores.
After comparing the main effect means of factor A, we move on the main effect
means of factor B. When a factor contains only two levels (like our gender factor),
HSD 5 1q
k
2a
B
MS
wn
n
b5 13.772a
B
8.22
6
b5 4.41
q
k
5 3.77.df
wn
5 12k 5 3
5 .05MS
wn
5 8.22n
nk
q
k
kkq
k
n
nk
nk
kdf
wn
q
k
MS
wn
HSD 5 1q
k
2a
B
MS
wn
n
b
nsns
0
Volume
12
11
10
9
8
7
6
5
4
3
2
1
0
Male
Gender
12
11
10
9
8
7
6
5
4
3
2
1
Mean persuasiveness
Mean persuasiveness
Soft Medium Loud Female
Mean persuasiveness as
a function of volume
Mean persuasiveness as
a function of gender
FIGURE 14.1
Graphs showing main
effects of volume and
gender