Heiman G. Basic Statistics for the Behavioral Sciences
Подождите немного. Документ загружается.

348 CHAPTER 14 / The Two-Way Analysis of Variance
20. You conduct an experiment involving two levels of self-confidence ( is low and
is high) and examine participants’ anxiety scores after they speak to one of
four groups of differing sizes ( through represent speaking to a small,
medium, large, or extremely large group, respectively). You compute the follow-
ing sums of squares ( and ):
Source Sum of Squares df Mean Square F
Between
Factor A 8.42
㛬㛬㛬㛬㛬㛬 㛬㛬㛬㛬㛬㛬 㛬㛬㛬㛬㛬㛬
Factor B 76.79 㛬㛬㛬㛬㛬㛬 㛬㛬㛬㛬㛬㛬 㛬㛬㛬㛬㛬㛬
Interaction 23.71 㛬㛬㛬㛬㛬㛬 㛬㛬㛬㛬㛬㛬 㛬㛬㛬㛬㛬㛬
Within 110.72 㛬㛬㛬㛬㛬㛬 㛬㛬㛬㛬㛬㛬
Total 219.64 㛬㛬㛬㛬㛬㛬
(a) Complete the ANOVA summary table. (b) With , what do you conclude
about each ? (c) Compute the appropriate values of HSD. (d) For the levels of
factor B, the means are , , , and What
should you conclude about the main effect of B? (e) How important is the size of the
audience in determining a person’s anxiety score? How important is the person’s
self-confidence?
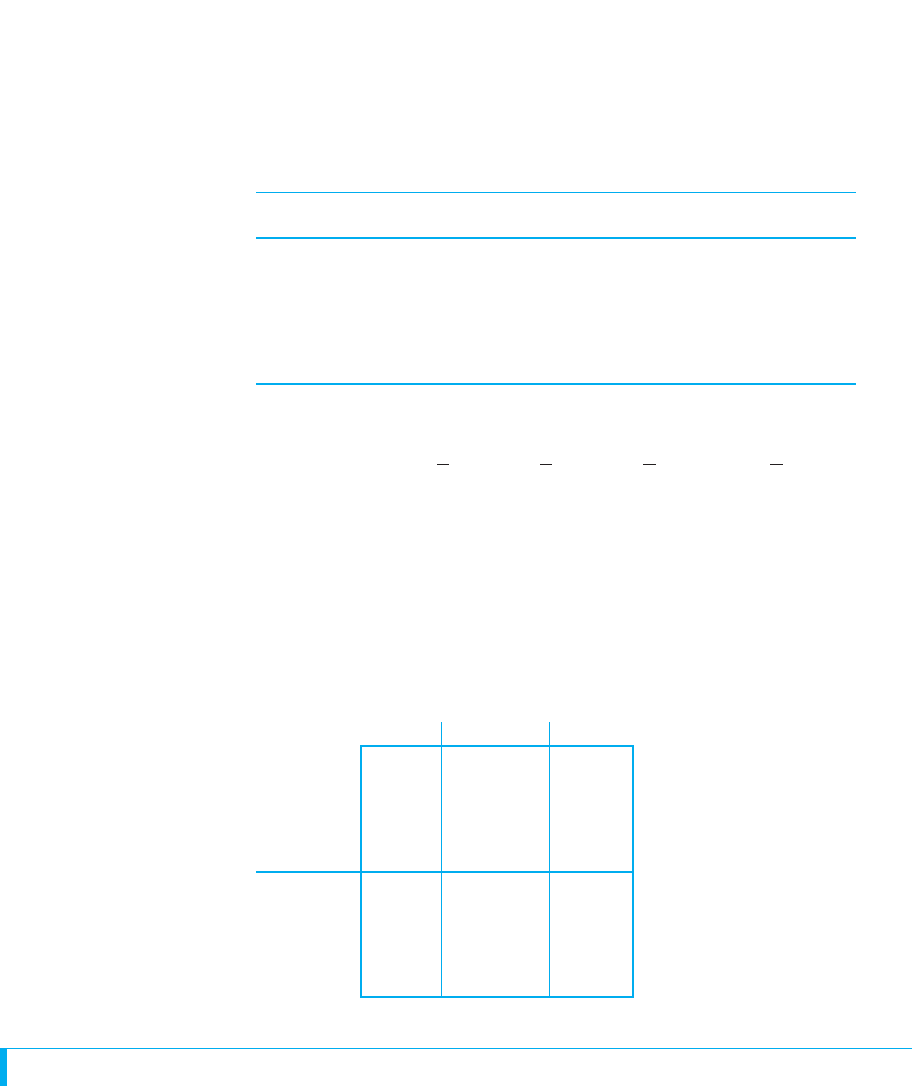
21. You measure the dependent variable of participants’ relaxation level as a function
of whether they meditate before being tested, and whether they were shown a film
containing a low, medium, or high amount of fantasy. Perform all appropriate sta-
tistical analyses, and determine what you should conclude about this study.
Amount of Fantasy
Low Medium High
57 9
Meditation 65 8
2610
2910
5510
No 10 2 5
Meditation 10 5 6
94 5
10 3 7
10 2 6
INTEGRATION QUESTIONS
22. What does a 95% confidence interval for indicate? (Ch.11)
23. What does “significant” indicate about the results of any study? (Ch. 10)
24. (a) How do you recognize the independent variable in a study? (b) How do you
recognize the levels in a study? (c) How do you recognize the dependent variable
in a study? (Chs. 2, 12, 13, 14)
25. To select a statistical procedure for an experiment, what must you ask about how
participants are selected? (Chs. 12, 13, 14)
X
4
5 28.3.X
3
5 24.6X
2
5 20.02X
1
5 18.36
F
obt
5 .05
N 5 32n 5 4
B
4
B
1
A
2
A
1

Integration Questions 349
26. (a) How do you recognize a two-sample t-test design? (b) What must be true
about the dependent variable? (c) Which versions of the t-test are available?
(Chs. 2, 10, 12)
27. (a) How do you recognize a correlational design? (b) To select a correlation coef-
ficient, what must you ask about the variables? (c) What is the parametric correla-
tion coefficient? (d) What is the nonparametric correlation coefficient? (Chs. 2, 7,
10, 11)
28. (a) How do you recognize a design that requires a one-way ANOVA? (b) What
must be true about the dependent variable? (c) Which versions of ANOVA are
available? (Chs. 10, 12 13)
29. (a) How do you recognize a design that fits a two-way ANOVA? (b) What must be
true about the dependent variable? (c) Which versions of ANOVA are available?
(Chs. 10, 12, 14)
30. For the following, identify the factor(s), the primary inferential procedure to
perform and the key findings we’d look for. If a correlational design, indicate the
predictor and criterion. If no parametric procedure can be used, indicate why.
(Chs. 7, 8, 10, 11, 12, 13, 14)
(a) We measure babies’ irritability when their mother is present and when she is
absent. (b) We test the driving ability of participants who are either high, medium,
or low in the personality trait of “thrill seeker.” For each type, we test some
participants who have had either 0, 1, or 2 oz. of alcohol. (c) Parents with
alcoholism may produce adult children who are more prone to alcoholism. We
compare the degree of alcoholism in participants with alcoholic parents to those
with nonalcoholic parents. (d) To study dark adaptation, participants were asked
to identify stimuli after sitting in a dim room for 1 minute, again after 15 minutes,
and again after 30 minutes. (e) We study whether people who smoke cigarettes are
more prone to be drug abusers. We identify participants who are smokers or non-
smokers, and for each, count the number who are high or low drug abusers. (f) To
test if creativity scores change with age, we test groups of 5-, 10-, or 15-year-olds.
We also identify them as Caucasian or non-Caucasian to determine if age-related
changes in creativity depend on race. (g) As in part (f) we measure the age scores
and creativity scores of all students in the school district, again separating
Caucasian and non-Caucasian. (Chs. 8, 12, 13, 14)
■ ■ ■ SUMMARY OF
FORMULAS
The general format for the summary table for a two-way, between-subjects ANOVA is
Summary Table of Two-Way ANOVA
Source Sum of Squares df Mean Square F
Between
Factor A SS
A
df
A
MS
A
F
A
Factor B SS
B
df
B
MS
B
F
B
Interaction SS
AB
df
AB
MS
AB
F
AB
Within SS
wn
df
wn
MS
wn
Total SS
tot
df
tot

350 CHAPTER 14 / The Two-Way Analysis of Variance
1. To perform the two-way, between-subjects ANOVA
a. Compute the sum of squares,
b. Compute the degrees of freedom,
i. The between groups for factor A
equals , where is the number of
levels in factor A.
ii. The df between groups for factor B
equals , where is the number of lev-
els in factor B.
iii. The df between groups for the interaction
equals multiplied times .
iv. The df within groups equals
, where is the total of the
study and is the total number of cells in
the study.
c. Compute the mean square,
MS
wn
5
SS
wn
df
wn
MS
A3B
5
SS
A3B
df
A3B
MS
B
5
SS
B
df
B
MS
A
5
SS
A
df
A
k
A3B
NNN 2 k
A3B
1df
wn
2
df
B
df
A
1df
A3B
2
k
B
k
B
2 1
1df
B
2
k
A
k
A
2 1
1df
A
2df
SS
wn
5 SS
tot
2 SS
bn
SS
A3B
5 SS
bn
2 SS
A
2 SS
B
SS
bn
5 © a
1Sum of scores in the row2
2
n of scores in the row
b2 a
1©X
tot
2
2
N
b
SS
B
5 © a
1Sum of scores in the row2
2
n of scores in the row
b2 a
1©X
tot
2
2
N
b
2 a
1©X
tot
2
2
N
b
SS
A
5 © a
1Sum of scores in the column2
2
n of scores in the column
b
SS
tot
5 ©X
2
tot
2 a
1©X
tot
2
2
N
b
d. Compute ,
Critical values of are found in Table 5 of
Appendix C.
2. The formula for Tukey’s HSD post hoc
comparisons is
a. For a significant main effect: Find in Table
6 in Appendix C for k equal to the number of
levels in the factor. In the formula, n is the
number of scores used to compute each main
effect mean in the factor.
b. For a significant interaction effect: Determine
the adjusted k using the small table at the top
of Table 6 in Appendix C. Find in Table 6
using the adjusted k. In the formula for HSD,
n is the number of scores in each cell.
3. The formula for eta squared is
2
5
Sum of squares between groups for the factor
SS
tot
q
k
q
k
HSD 5 1q
k
2a
B
MS
wn
n
. b
F
F
A3B
5
MS
A3B
MS
wn
F
B
5
MS
B
MS
wn
F
A
5
MS
A
MS
wn
F
obt

351
Chi Square and Other
Nonparametric Procedures
15
GETTING STARTED
To understand this chapter, recall the following:
■
From Chapter 2, the four types of measurement scales (nominal, ordinal,
interval, and ratio).
■
From Chapter 12, the types of designs that call for either the independent-
samples t-test or the related-samples t-test.
■
From Chapter 13, the one-way ANOVA, post hoc tests, and eta squared.
■
From Chapter 14, what a two-way interaction indicates.
Your goals in this chapter are to learn
■
When to use nonparametric statistics.
■
The logic and use of the one-way chi square.
■
The logic and use of the two-way chi square.
■
The nonparametric procedures corresponding to the independent-samples and
related-samples t-test and to the between-subjects and within-subjects ANOVA.
Previous chapters have discussed the category of inferential statistics called parametric
procedures. Now we’ll turn to the other category, called nonparametric procedures.
Nonparametric procedures are still inferential statistics for deciding whether the differ-
ences between samples accurately represent differences in the populations, so the logic
here is the same as in past procedures. What’s different is the type of dependent vari-
able involved. In this chapter, we will discuss (1) two common procedures used with
nominal scores called the one-way and two-way chi square and (2) review several less
common procedures used with ordinal scores.
WHY IS IT IMPORTANT TO KNOW ABOUT NONPARAMETRIC PROCEDURES?
Previous parametric procedures have required that dependent scores reflect an interval
or ratio scale, that the scores are normally distributed, and that the population variances
are homogeneous. It is better to design a study that allows you to use parametric proce-
dures because they are more powerful than nonparametric procedures. However, some-
times researchers don’t obtain data that fit parametric procedures. Some dependent
variables are nominal variables (for example, whether someone is male or female).
Sometimes we can measure a dependent variable only by assigning ordinal scores (for
example, judging this participant as showing the most of the variable, this one second-
most, and so on). And sometimes a variable involves an interval or ratio scale, but the

352 CHAPTER 15 / Chi Square and Other Nonparametric Procedures
populations are severely skewed and/or do not have homogeneous variance (for exam-
ple, previously we saw that yearly income forms a positively skewed distribution).
Parametric procedures will tolerate some violation of their assumptions. But if the
data severely violate the rules, then the result is to increase the probability of a Type I
error so that it is much larger than the alpha level we think we have.
Therefore, when data do not fit a parametric procedure, we turn to nonparametric
statistics. They do not assume a normal distribution or homogeneous variance, and the
scores may be nominal or ordinal. By using these procedures, we keep the probability of a
Type I error equal to the alpha level that we’ve selected. Therefore, it is important to know
about nonparametric procedures because you may use them in your own research, and you
will definitely encounter them when reading the research of others.
REMEMBER Use nonparametric statistics when dependent scores form very
nonnormal distributions, when the population variance is not homogeneous,
or when scores are measured using ordinal or nominal scales.
CHI SQUARE PROCEDURES
Chi square procedures are used when participants are measured using a nominal vari-
able. With nominal variables, we do not measure an amount, but rather we categorize
participants. Thus, we have nominal variables when counting how many individuals
answer yes, no, or maybe to a question; how many claim to vote Republican, Democra-
tic, or Socialist; how many say that they were or were not abused as children; and so
on. In each case, we count the number, or frequency, of participants in each category.
The next step is to determine what the data represent. For example, we might find
that out of 100 people, 40 say yes to a question and 60 say no. These numbers indicate
how the frequencies are distributed across the categories of yes/no. As usual, we want
to draw inferences about the population: Can we infer that if we asked the entire popu-
lation this question, 40% would say yes and 60% would say no? Or would the frequen-
cies be distributed in a different manner? To make inferences about the frequencies in
the population, we perform chi square (pronounced “kigh square”). The chi square
procedure is the nonparametric inferential procedure for testing whether the frequen-
cies in each category in sample data represent specified frequencies in the population.
The symbol for the chi square statistic is .
REMEMBER Use the chi square procedure when you count the number
of participants falling into different categories.
Theoretically, there is no limit to the number of categories—levels—you may have
in a variable and no limit to the number of variables you may have. Therefore, we
describe a chi square design in the same way we described ANOVAs: When a study has
only one variable, perform the one-way chi square; when a study has two variables,
perform the two-way chi square; and so on.
ONE-WAY CHI SQUARE
The one-way chi square is used when data consist of the frequencies with which
participants belong to the different categories of one variable. Here we examine the
relationship between the different categories and the frequency with which participants
1
2
2
2

One-Way Chi Square 353
fall into each. We ask, “As the categories change, do the frequencies in the categories
also change?”
Here is an example. Being right-handed or left-handed is related to brain organiza-
tion, and many of history’s great geniuses were left-handed. Therefore, using an IQ
test, we select a sample of 50 geniuses. Then we ask them whether they are left-
or right-handed (ambidextrous is not an option). The total numbers of left- and right-
handers are the frequencies in the two categories. The results are shown here:
Handedness
Left-Handers Right-Handers
f
o
10 f
o
40
k 2
N total f
o
50
Each column contains the frequency in that category. We call this the observed fre-
quency, symbolized by . The sum of the from all categories equals , the total
number of participants. Notice that stands for the number of categories, or levels, and
here .
Above, 10 of the 50 geniuses (20%) are left-handers, and 40 of them (80%) are right-
handers. Therefore, we might argue that the same distribution of 20% left-handers and
80% right-handers would occur in the population of geniuses. But, there is the usual
problem: sampling error. Maybe, by luck, the people in our sample are unrepresenta-
tive, so in the population of geniuses, we would not find this distribution of right- and
left-handers. Maybe our results poorly represent some other distribution.
What is that “other distribution” of frequencies that the sample poorly represents?
To answer this, we create a model of the distribution of the frequencies we expect to
find in the population when is true. The model describes the distribution of
frequencies in the population if there is not the predicted relationship. It is because
we test this model that the one-way chi square procedure is also called a goodness-
of-fit test. Essentially, we test how “good” the “fit” is between our data and the
model. Thus, the goodness-of-fit test is another way of asking whether sample data
are likely to represent the distribution of frequencies in the population as described
by .
Hypotheses and Assumptions of the One-Way Chi Square
The one-way tests only two-tailed hypotheses. Usually, researchers test the that
there is no difference among the frequencies in the categories in the population, mean-
ing that there is no relationship in the population. For the handedness study, for the
moment we’ll ignore that there are more right-handers than left-handers in the world.
Therefore, if there is no relationship in the population, then our is that the frequen-
cies of left- and right-handed geniuses are equal in the population. There is no conven-
tional way to write this in symbols, so simply write : all frequencies in the
population are equal. This implies that, if the observed frequencies in the sample are
not equal, it’s because of sampling error.
The alternative hypothesis always implies that the study did demonstrate the pre-
dicted relationship, so we have : not all frequencies in the population are equal. For
our handedness study, implies that the observed frequencies represent different fre-
quencies of left- and right-handers in the population of geniuses.
H
a
H
a
H
0
H
0
H
0
2
H
0
H
0
H
0
H
0
k 5 2
k
Nf
o
sf
o

354 CHAPTER 15 / Chi Square and Other Nonparametric Procedures
The one-way has five assumptions:
1. Participants are categorized along one variable having two or more categories, and
we count the frequency in each category.
2. Each participant can be in only one category (that is, you cannot have repeated
measures).
3. Category membership is independent: The fact that an individual is in a category
does not influence the probability that another participant will be in any category.
4. We include the responses of all participants in the study (that is, you would not
count only the number of right-handers, or in a different study, you would count
both those who do and those who do not agree with a statement).
5. For theoretical reasons, each “expected frequency” discussed below must be at
least 5.
Computing the One-Way Chi Square
The first step in computing is to translate into the expected frequency for each
category. The expected frequency is the frequency we expect in a category if the sam-
ple data perfectly represent the distribution in the population described by the null
hypothesis. The symbol for an expected frequency is . Our is that the frequencies
of left- and right-handedness are equal. If the sample perfectly represents this, then out
of our 50 participants, 25 should be right-handed and 25 should be left-handed. Thus,
the expected frequency in each category is .
Notice that, whenever we are testing the of no difference among the categories,
the will be the same for all categories, and it will always equal . Thus, above,
our . Also notice that sometimes may contain a decimal. For ex-
ample, if we included a third category, ambidextrous, then , and each would
be 16.67.
After computing each , the next step is to compute , which we call .
2
obt
2
f
e
f
e
k 5 3
f
e
f
e
5 50>2 5 25
N>kf
e
H
0
f
e
5 25
H
0
f
e
H
0
2
2
This says to find the difference between and in each category, square that differ-
ence, and then divide it by the for that category. After doing this for all categories,
sum the quantities, and the answer is .
For the handedness study, we have these frequencies:
Handedness
Left-Handers Right-Handers
f
o
10 f
o
40
f
e
25 f
e
25
2
obt
f
e
f
e
f
o
The formula for chi square is
χ
2
obt
5 © a
1f
o
2 f
e
2
2
f
e
b
One-Way Chi Square 355
Filling in the formula gives
In the numerator of each fraction, first subtract the from the , giving
Squaring each numerator gives
After dividing,
So our
Interpreting the One-Way Chi Square
If the sample perfectly represents the situation where is true, then each “should”
equal its corresponding . Then the difference between and should equal zero, and
so should equal zero. If not, says this is due to sampling error. However, the
larger the differences between and (and the larger the ), the harder it is for us to
accept that this is simply due to sampling error. At the same time, larger differences
between and are produced because of a larger observed frequency in one category
and a smaller one in another, so the more it looks like we are really representing a rela-
tionship. Therefore, the larger the , the less likely it is that is true and the more
likely it is that is true.
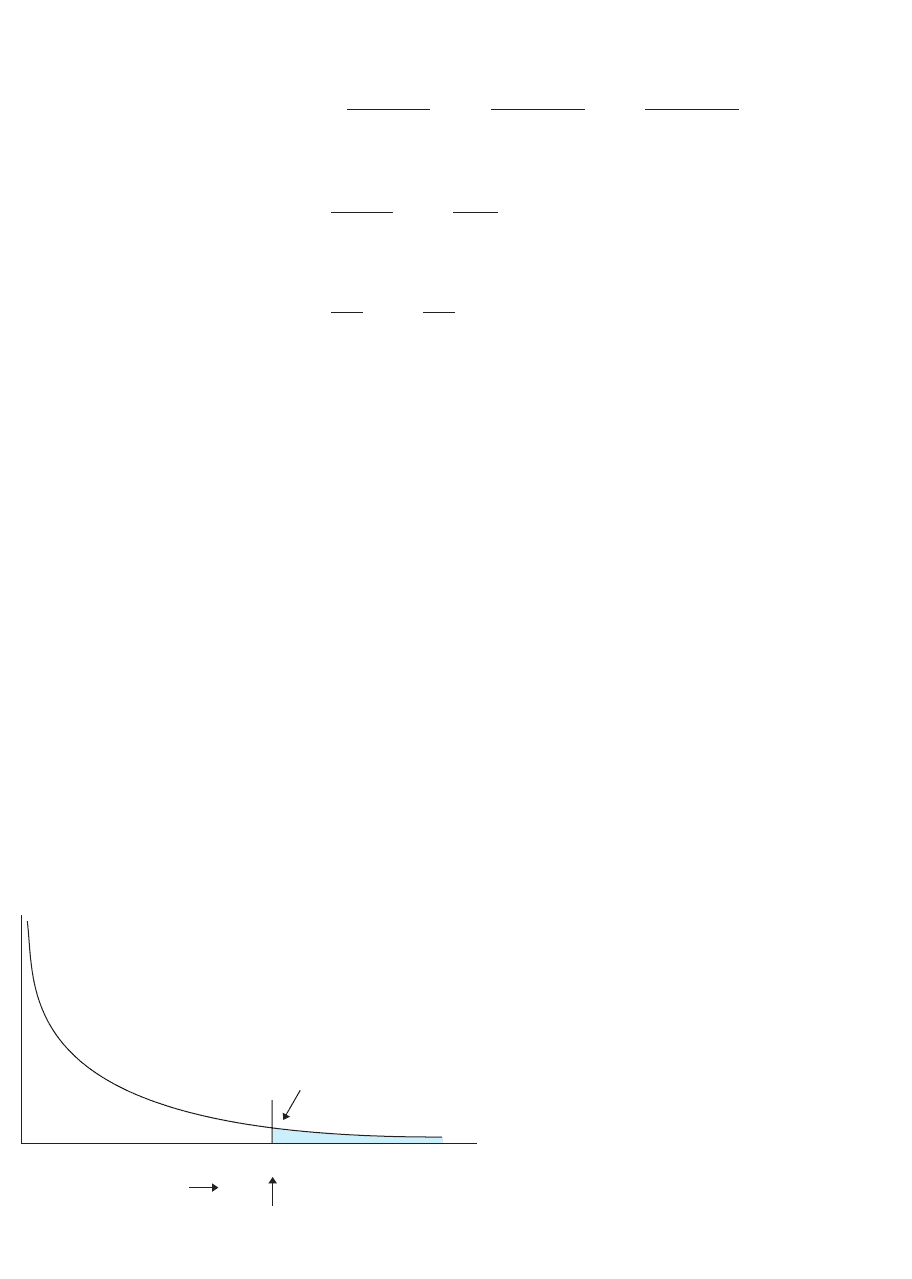
To determine if our is large enough, we examine the -distribution. Like previ-
ous sampling distributions, it is as if we have infinitely selected samples from the situa-
tion where is true. The -distribution is the sampling distribution containing all
possible values of when is true. Thus, for the handedness study, the -distribu-
tion is the distribution of all possible values of when there are two categories and the
frequencies in the two categories in the population are equal. You can envision the -
distribution as shown in Figure 15.1.
Even though the -distribution is not at all nor-
mal, it is used in the same way as previous sam-
pling distributions. Most often the data perfectly
represent the situation so that each equals its
, and then is zero. However, sometimes by
chance, the observed frequencies differ from the
expected frequencies, producing a greater than
zero. The larger the , the larger are the differ-
ences between the observed and the expected and
then the less likely they are to occur when
is true.
Because can only get larger, we again
have two-tailed hypotheses but one region of
rejection. To determine if is significant, we
2
obt
2
obt
H
0
2
2
2
f
e
f
o
H
0
2
2
2
2
H
0
2
2
H
0
2
2
obt
H
a
H
0
2
obt
f
o
f
e
2
obt
f
o
f
e
H
0
2
obt
f
o
f
e
f
e
f
o
H
0
2
obt
5 18.0
2
obt
5 9 1 9
2
obt
5 a
225
25
b1 a
225
25
b
2
obt
5 a
12152
2
25
b1 a
1152
2
25
b
f
o
f
e
2
obt
5 © a
1f
o
2 f
e
2
2
f
e
b5 a
110 2 252
2
25
b1 a
140 2 252
2
25
b
f
α = .05
0
χ
2
χ
2
greater than 0
χ
2
crit
χ
2
χ
2
χ
2
χ
2
χ
2
χ
2
χ
2
χ
2
Region of rejection
FIGURE 15.1
Sampling distribution of
2
when H
0
is true

compare it to the critical value, symbolized by . As with previous statistics, the
-distribution changes shape as the degrees of freedom change, so we must
first determine the degrees of freedom. Here, , where is the number of
categories.
REMEMBER In a one-way chi square, .
Find the critical value of in Table 7 in Appendix C, entitled “Critical Values of
Chi Square.” For the handedness study, , so , and with , the
. Our of 18.0 is larger than this , so the results are significant:
This indicates that the differences between our observed and expected frequen-
cies are very unlikely to occur if our data represent no relationship in the population.
Therefore we reject that this is what the data represent. We then accept the that
the sample represents frequencies in the population that are not equal. In fact, we
would expect to find about 20% left-handers and 80% right-handers in the popula-
tion of geniuses. We conclude that we have evidence of a relationship between hand-
edness and genius. Then, as usual, we interpret the relationship in terms of the
behaviors and variables involved.
If had not been significant, we would have no evidence—one way or the other—
regarding how handedness is distributed among geniuses.
Note: If a study involves three categories, a significant chi square is not followed by
post hoc comparisons. We simply assume that the observed frequency in each category
represents frequencies that would be found in the population. Also, there is no measure
of effect size for this design.
Testing Other Hypotheses with the One-Way Chi Square
The procedure can also be used to test an other than that there is no difference
among the categories. For example, only about 10% of the general population is actu-
ally left-handed, so we should test whether handedness in geniuses is distributed dif-
ferently than this. Our is that geniuses are like the general population, being 10%
left-handed and 90% right-handed. Our is that our data represent a population of
geniuses that does not have this distribution (or for simplicity, we can write as
“not ”).
Each is again based on our . Say that we test our previous 50 geniuses. Our
says that left-handed geniuses should occur 10% of the time: 10% of 50 is 5, so
. Right-handed geniuses should occur 90% of the time: 90% of 50 is 45, so
. We found for left-handers and for right-handers. We compute
using the previous formula, comparing the to for left-handers and the to
for right-handers.
With and , the critical value of is again 3.84. Because the of
5.56 is larger than , we reject and conclude that the observed frequencies are
significantly different from what we would expect if handedness in the population of
geniuses was distributed as it is in the general population. Instead, we estimate that in
the population of geniuses, 20% are left-handers and 80% are right-handers.
H
0
2
crit
2
obt
2
k 5 2 5 .05
2
obt
5 © a
1f
o
2 f
e
2
2
f
e
b5 a
110 2 52
2
5
b1 a
140 2 452
2
45
b5 5.56
f
o
f
e
f
o
f
e
2
obt
f
o
5 40f
o
5 10f
e
5 45
f
e
5 5
H
0
H
0
f
e
H
0
H
a
H
a
H
0
H
0
2
2
obt
H
a
2
obt
2
crit
2
obt
2
crit
5 3.84
5 .05df 5 1k 5 2
2
df 5 k 2 1
kdf 5 k 2 1
2
2
crit
356 CHAPTER 15 / Chi Square and Other Nonparametric Procedures
■
The one-way is used when counting the
frequency of category membership on one variable.
MORE EXAMPLES
Below are the number of acts of graffiti that occur on
walls painted white, painted blue, or covered with
chalkboard. is that there are no differences in the
population. With , for
each category.
White Blue Chalk
f
o
8 f
o
5 f
o
17
f
e
10 f
e
10 f
e
10
With and , ,
the wall coverings produce a significant difference in
2
crit
5 5.99 5 .05df 5 k 2 1 5 2
2
obt
5
4
10
1
25
10
1
49
10
5 7.80
2
obt
5
110 2 82
2
10
1
110 2 52
2
10
1
110 2 172
2
10
2
obt
5 © a
1f
e
2 f
o
2
2
f
e
b
f
e
5 N>k 5 30>3 5 10N 5 30
H
0
2
the frequency of graffiti acts. In the population, we
expect 27% of graffiti on white walls, 17% on blue
walls, and 57% on chalkboard walls.
For Practice
1. The one-way chi square is used when we count
the ____ with which participants fall into
different ____.
2. We find in category A and in cate-
gory B. is that the frequencies are equal. The
for A is ____, and the for B is ____.
3. Compute .
4. The is ____, so at , is ____.
5. The is ____, so in the population we expect
membership is around ____% in A and around
____% in B.
Answers
1. frequency; categories
2. Each
3.
4. 1; 3.84
5. significant; 35%; 65%
2
obt
5
130 2 212
2
30
1
130 2 392
2
30
5 5.40
f
e
5 60>2 5 30
2
obt
2
crit
5 .05df
2
obt
f
e
f
e
H
0
f
o
5 39f
o
5 21
A QUICK REVIEW
The Two-Way Chi Square 357
THE TWO-WAY CHI SQUARE
The two-way chi square procedure is used when you count the frequency of category
membership along two variables. (The assumptions of the two-way chi square are the
same as for the one-way chi square.) Here is an example. At one time, psychologists
claimed that someone with a Type A personality tends to be a very pressured, hostile
individual who never seems to have enough time. The Type B personality tends not to
be so time pressured and is more relaxed and mellow. A controversy developed over
whether Type A people are less healthy, especially when it comes to the “big one”—
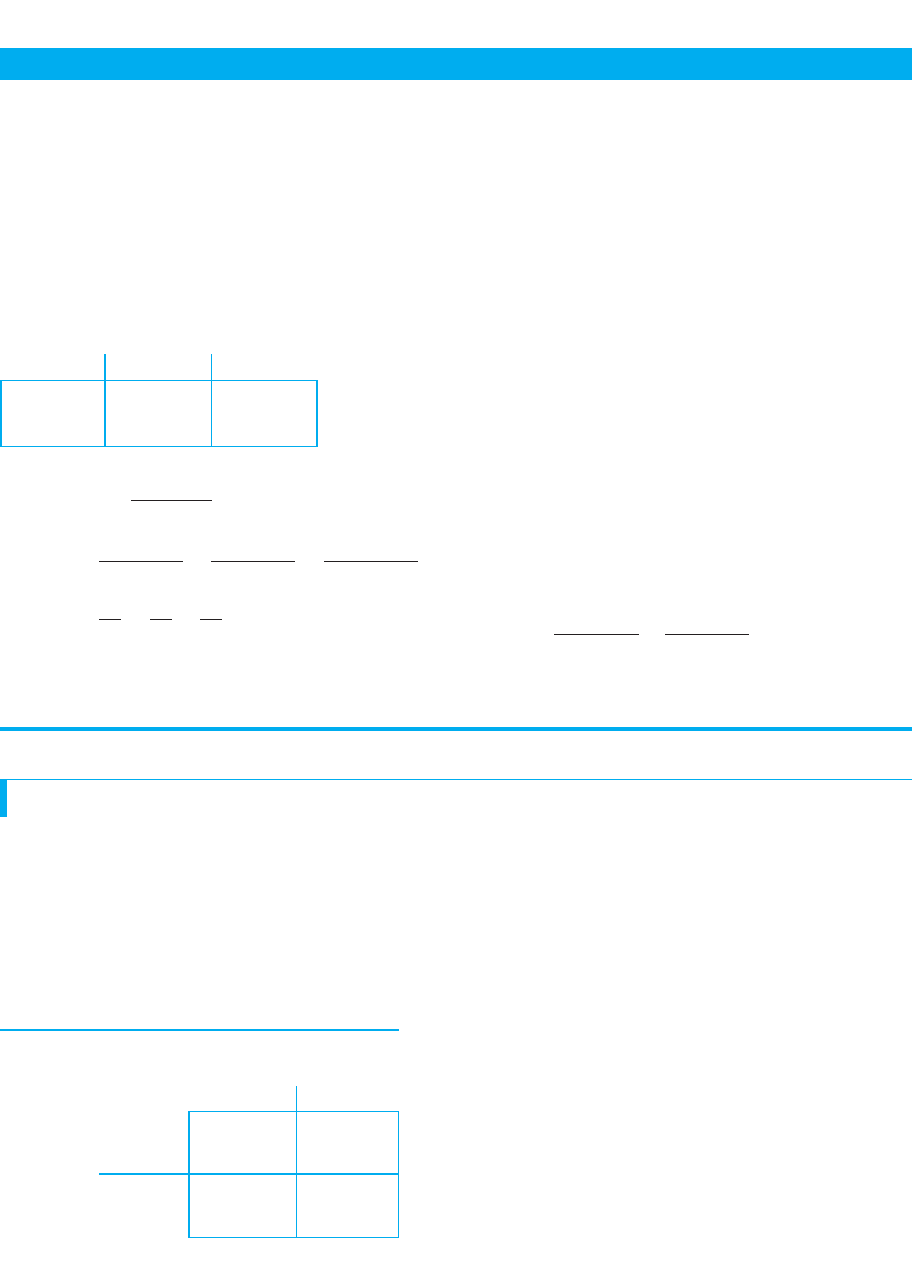
having heart attacks. Therefore, say that we select a sample of
80 people and determine how many are Type A and how
many Type B. We then count the frequency of heart attacks in
each type. We must also count how many in each type have
not had heart attacks (see our assumption 4). Therefore, we
have two categorical variables: personality type (A or B) and
health (heart attack or no heart attack). Table 15.1 shows the
layout of this study. Notice, this is a matrix, so it is
called a design. Depending on the number of categories
in each variable, a study might be a , a , and so on.3 3 42 3 3
2 3 2
2 3 2
Personality Type
Type A Type B
Heart
Attack
f
o
f
o
Health
No Heart
Attack
f
o
f
o
TABLE 15.1
A Two-Way Chi Square
Design Comparing
Participants’ Personality
Type and Health