Heiman G. Basic Statistics for the Behavioral Sciences
Подождите немного. Документ загружается.

Multiplying each times the paired , summing the products, and then dividing by
N produces the average correspondence between the scores.
Luckily, the computational formula for r does all of that at once. It is derived from
the above formula by replacing the symbols and with their formulas and then,
in each, replacing the symbols for the mean and standard deviation with their formu-
las. This produces a monster of a formula. After reducing it, we have the smaller mon-
ster below.
z
Y
z
X
z
Y
z
X
148 CHAPTER 7 / The Correlation Coefficient
The computational formula for the Pearson correlation
coefficient is
r 5
N1©XY22 1©X21©Y2
23N1©X
2
22 1©X2
2
43N1©Y
2
22 1©Y2
2
4
In the numerator, N (the number of pairs) is multiplied times . From this, sub-
tract the quantity obtained by multiplying times . In the denominator, in the
left brackets, multiply N times and from that subtract . In the right bracket,
multiply N times and from that subtract . Multiply the answers in the two
brackets together and find the square root. Then divide the denominator into the numer-
ator and, voilà, the answer is the Pearson r.
As an example, say that we ask ten people the number of times they visited a doctor
in the last year and the number of glasses of orange juice they drink daily. We obtain
the data in Figure 7.8. To describe the linear relationship between juice drinking and
doctor visits, (two ratio variables,) we compute r.
Table 7.1 shows a good way to organize your computations. In addition to the
columns for and , create columns containing , , and . Sum all columns.
Then square and .©Y©X
XYY
2
X
2
YX
1©Y2
2
©Y
2
1©X2
2
©X
2
1©X21©X2
©XY
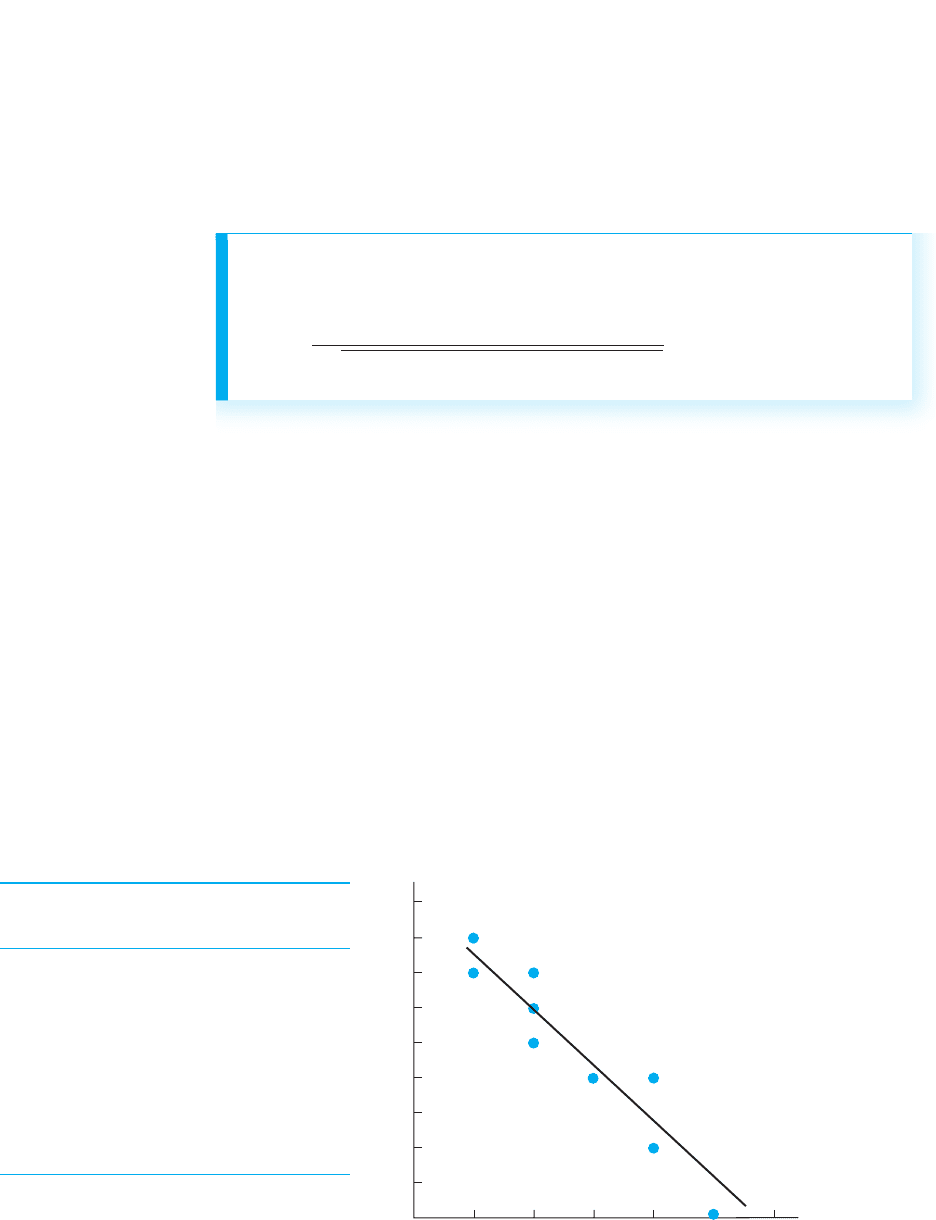
FIGURE 7.8
The relationship between number of glasses of orange juice consumed daily and number of yearly doctor visits.
Juice Scores: Doctor Visits:
Participant XY
108
207
317
416
515
624
724
834
932
10 4 0
9
8
102 543
Glasses of
j
uice
p
er da
y
Doctor visits per year
7
6
5
4
3
2
1

Putting these quantities in the formula for r we get
In the numerator, multiplying 10 times 52 is 520. Also, 17 times 47 is 799. Now we
have
Complete the numerator: 799 from 520 is 279. (Note the negative sign.)
In the denominator, first perform the operations within each bracket. In the left
bracket, 10 times 45 is 450. From that subtract 289, obtaining 161. In the right bracket,
10 times 275 is 2750. From that subtract 2209, obtaining 541. We have
Now multiply the quantities in the brackets together: 161 times 541 equals 87,101.
After taking the square root we have
Divide and there you have it:
Thus, the correlation coefficient between orange juice drinks and doctor visits is
(Note: We usually round the coefficient to two decimals.) Had this been a posi-
tive relationship, r would not be negative and we would include the sign. Instead, on
a scale of 0 to , a indicates that this is an extremely strong, negative linear re-
lationship. Therefore, we envision a very narrow, downward slanting scatterplot like
that back in Figure 7.8. We know that each amount of orange juice is associated with a
very small range of doctor visits, and as juice scores increase, doctor visits consistently
decrease. Further, based on participants’ juice scores, we can very accurately predict
their doctor visits. (Orange juice is an extremely good “predictor” of doctor visits,
2.95;1
1
2.95.
r 52.95.
r 5
2279
295 .129
r 5
2279
23161435414
2
r 5
520 2 799
231014522 2894310127522 22094
5
1015222 11721472
231014522 2894310127522 22094
r 5
N1©XY22 1©X21©Y2
23N1©X
2
22 1©X2
2
43N1©Y
2
22 1©Y2
2
4
The Pearson Correlation Coefficient 149
Glasses of Juice per Day Doctor Visits per Year
Participant
1 0 0 8 64 0
2 0 0 7 49 0
3 1 1 7 49 7
4 1 1 6 36 6
5 1 1 5 25 5
6 2 4 4 16 8
7 2 4 4 16 8
8 3 9 4 16 12
9392 4 6
10 4 16 0 0 0
17 45 47 275 52
1©Y2
2
5 22091©X2
2
5 289
©XY 5©Y
2
5©Y 5 ©X
2
5©X 5 N 5 10
XYY
2
YX
2
X
TABLE 7.1
Sample Data for
Computing the r
Between Orange Juice
Consumed (the
X variable) and Doctor
Visits (the Y variable)

accounting for a substantial portion of the variance in these scores.) Of course if the
correlation were this large in real life, we’d all be drinking a lot more orange juice,
incorrectly thinking that this would cause fewer doctor visits.
REMEMBER Compute the Pearson correlation coefficient to describe the lin-
ear relationship between interval and/or ratio variables.
Recognize that this correlation coefficient describes the relationship in our sample.
Ultimately we will want to describe the laws of nature, inferring the correlation coeffi-
cient we would expect to find if we could measure everyone in the population. How-
ever, before we can do this, we must perform the appropriate inferential procedure
(discussed in Chapter 11). Only if our sample correlation coefficient passes the infer-
ential test will we then talk about how this relationship occurs in nature.
Y
150 CHAPTER 7 / The Correlation Coefficient
A QUICK REVIEW
■
The Pearson correlation coefficient (r) describes the
linear relationship between two interval and/or ratio
variables.
MORE EXAMPLES
XY
13
12
24
25
35
36
To compute r for the above scores:
,,,,
, , and
In the numerator, 6 times 56 is 336, and 12 times 25 is
300, so
r 5
136
23612822 144436111522 6254
r 5
336 2 300
231612822 144436111522 6254
r 5
615622 11221252
23612822 144436111522 6254
r 5
N1©XY22 1©X21©Y2
23N1©X
2
22 1©X2
2
43N1©Y
2
22 1©Y2
2
4
N 5 6©XY 5 56©Y
2
5 1551©Y2
2
5 625
©Y 5 25©X
2
2 281©X2
2
5 144©X 5 12
In the denominator, 6 times 28 is 168; 6 times 115
is 690, so
For Practice
Compute r for the following:
XY
11
13
22
24
34
Answer
5
114
231443344
51.64
r 5
512822 1921142
23511922 8143514622 1964
r 5
136
21560
5
136
39.497
51.91
r 5
136
23168 2 14443690 2 6254
5
136
232443654
THE SPEARMAN RANK-ORDER CORRELATION COEFFICIENT
Another very common correlation coefficient is used when we have ordinal scores
(when we have the equivalent of 1st, 2nd, 3rd, etc., on each variable). The Spearman
rank-order correlation coefficient describes the linear relationship between two vari-
ables when measured by ranked scores. The symbol for the Spearman correlation coef-
ficient is . (The subscript s stands for Spearman.)
Sometimes we compute because we have initially assigned each participant a rank
on each of two variables. Or, if we want to correlate one ranked variable with one inter-
val or ratio variable, we transform the interval or ratio scores into ranked scores (we
might give the participant with the highest score a 1, the next highest score is ranked 2,
and so on). Either way that we obtain the ranks, tells us the extent to which the ranks
on one variable consistently match the ranks on the other variable to form a linear rela-
tionship. If every participant has the same rank on both variables, will equal 1. If
everyone’s rank on one variable is the opposite of his or her rank on the other variable,
will equal 1. With only some degree of consistent pairing of the ranks, will be
between 0 and 1. If there is no consistent pairing, will equal 0.
Ranked scores often occur in behavioral research because a variable is difficult to
measure quantitatively. Instead we must evaluate participants by asking observers to
make subjective judgments that are then used to rank order the participants. For exam-
ple, say that we ask two observers to judge how aggressively children behave while
playing. Each observer assigns the rank of 1 to the most aggressive child, 2 to the sec-
ond-most aggressive child, and so on. Because describes the consistency with which
rankings match, one use of is to determine the extent to which the two observers’
rankings agree.
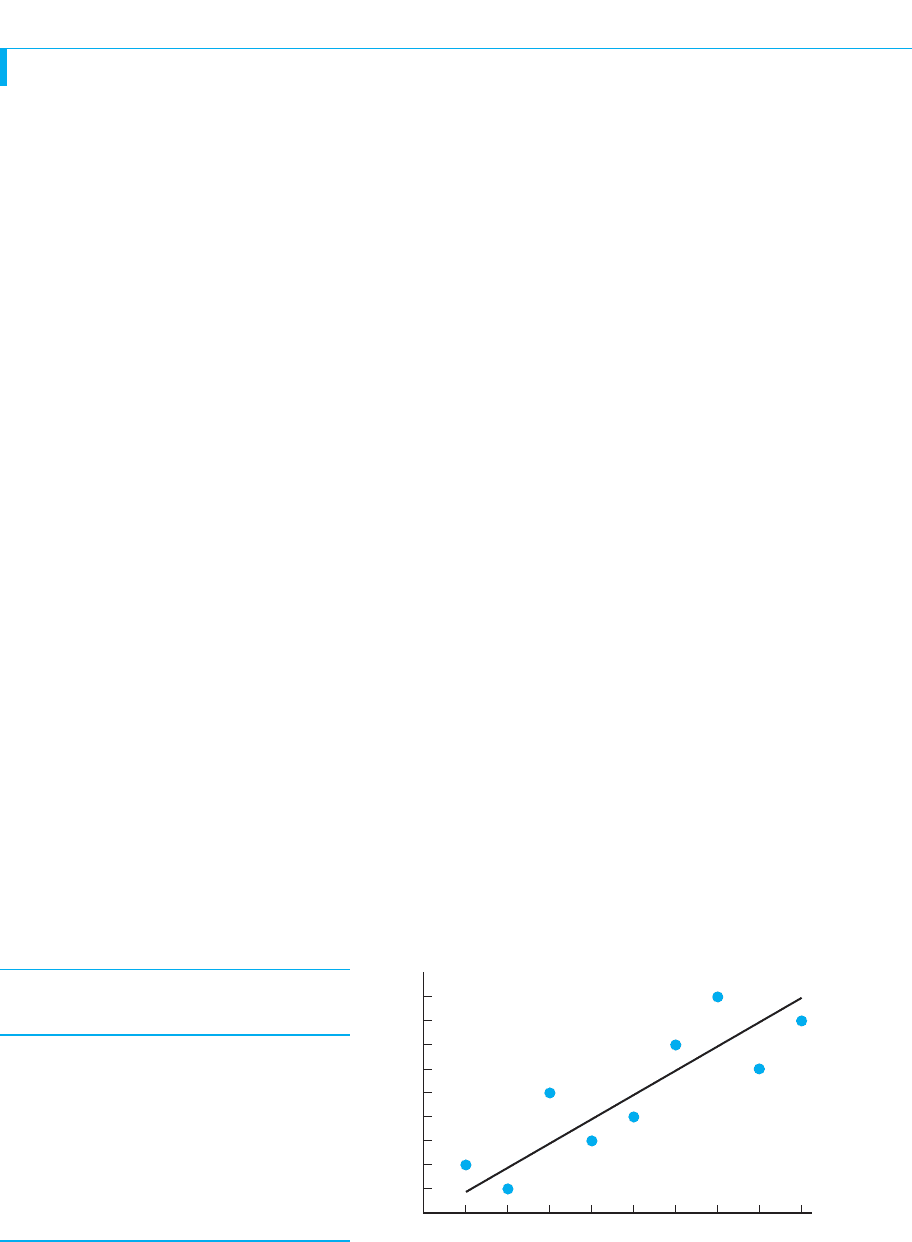
Figure 7.9 shows the ranked scores and the resulting scatterplot that the two ob-
servers might produce for nine children. Notice that we treat each observer as a vari-
able. Judging from the scatterplot, it appears that they form a positive relationship. To
describe this relationship, we compute .
Note: If you have any “tied ranks” (when two or more participants receive the same
score on the same variable) you must first adjust them as described in the section
“Resolving Tied Ranks” in Chapter 15.
r
S
r
S
r
S
r
S
;
r
S
2r
S
1r
S
r
S
r
S
r
S
The Spearman Rank-Order Correlation Coefficient 151
FIGURE 7.9
Sample data for computing r
S
between rankings assigned to children by observer A and observer B
Observer A: Observer B:
Participant XY
143
212
398
486
535
654
767
821
979
0
Observer A’s rankings
9
8
7
6
5
4
3
2
1
Observer B’s rankings
12 90876543

The logic of the formula here is similar to that in the previous Pearson formula, ex-
cept that accommodates the peculiarities of ranks (e.g., zero cannot occur). This is
why the formula always contains the 6 in the numerator. The D in the numerator stands
for the difference between the two ranks in each X–Y pair, and N is the number of pairs
of ranks. Note that after dealing with the fraction, the final step is to subtract from 1.
A good way to organize your computations is shown in Table 7.2. For the column
labeled , either subtract every from its paired or, as shown, every from its .
Then compute by squaring the difference in each pair. Finally, determine the sum of
the squared differences, (here is 18). You will also need , the number of
X–Y pairs (here 9), and (here 81). Filling in the formula gives
In the numerator, 6 times 18 is 108. In the denominator, is 80, and 9 times 80 is
720. Now
After dividing
Subtracting yields
r
S
51.85
r
S
5 1 2 .15
r
S
5 1 2
108
720
81 2 1
r
S
5 1 2
61©D
2
2
N1N
2
2 12
5 1 2
61182
9181 2 12
N
2
N©D
2
©D
2
D
2
XYYXD
r
S
152 CHAPTER 7 / The Correlation Coefficient
TABLE 7.2
Data Arrangement
for Computing r
S
Observer A: Observer B:
Participant XYD
14311
212 1
39811
48624
535 4
65411
767 1
82111
979 4
2
5 18©D
22
21
22
21
D
2
The computational formula for the Spearman rank-order
correlation coefficient is
r
S
5 1 2
61©D
2
2
N1N
2
2 12
Here is the formula for .r
S

THE RESTRICTION OF RANGE PROBLEM
As you learn about conducting research, you’ll learn of potential mistakes to avoid that
otherwise can lead to problems with your statistical conclusions. One important
mistake to avoid with all correlation coefficients is called the restriction of range
problem. It occurs when we have data in which the range between the lowest and high-
est scores on one or both variables is limited. This will produce a correlation coefficient
that is smaller than it would be if the range were not restricted. Here’s why.
The Restriction of Range Problem 153
■
The Spearman correlation coefficient describes
the type and strength of the linear relationship
between two sets of ranks.
MORE EXAMPLES
To determine for the following ranks, find the D of
each X–Y pair, and then D
2
and N.
XY D
11 0 0
22 0 0
43 1 1
36 9
65 1 1
54 1 1
5 1 2
72
210
5 1 2 .343 51.66
r
s
5 1 2
61©D
2
2
N1N
2
2 12
5 1 2
61122
6136 2 12
N 5 6
©D
2
5 12
5
5
235
5
5
5
D
2
r
S
1r
S
2
For Practice
1. When do we compute ?
2. The first step in computing is to compute each
____?
For the ranks:
XY
12
21
33
45
54
3. The ____ and _____?
4. The ____?
Answers
1. When we have ordinal scores.
2. D
3.
4.
r
S
51.80
©D
2
5 4; N 5 5
r
S
5
N 5©D
2
5
r
S
r
S
A QUICK REVIEW
Thus, on a scale of 0 to , these rankings form a consistent linear relationship to
the extent that . This tells us that a child receiving a particular rank from
one observer tended to receive very close to the same rank from the other observer.
Therefore, the data form a rather narrow scatterplot that tends to hug the regression
line. (The must also pass the inferential test in Chapter 11 before we can draw any
inferences about it.)
REMEMBER Compute the Spearman correlation coefficient to describe the
linear relationship between two ordinal variables.
r
S
r
S
5
1
.85
;1
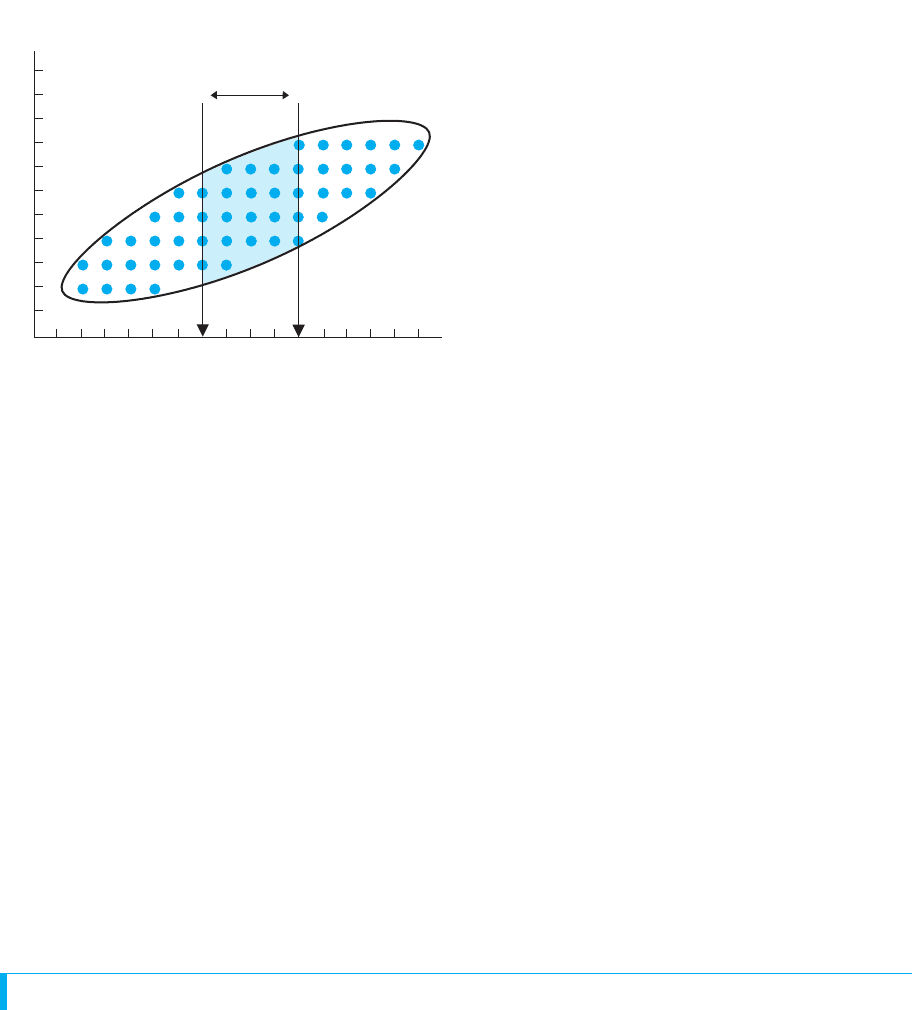
In Figure 7.10, first consider the entire scatterplot
showing the full (unrestricted) range of and scores.
We see a different batch of similar scores occurring
as increases, producing an elongated, relatively nar-
row ellipse that clearly slants upwards. Therefore, the
correlation coefficient will be relatively large, and we
will correctly conclude that there is a strong linear
relationship between these variables.
However, say that instead we restricted the range of
when measuring the data, giving us only the scatter-
plot located between the lines labeled A and B in
Figure 7.10. Now, we are seeing virtually the same
batch of scores as these few scores increase. This
produces a scatterplot that looks relatively fat and more
horizontal. Therefore, the correlation coefficient from
these data will be very close to 0, so we will conclude that there is a very weak—if
any—linear relationship here. This would be wrong, however, because without us
restricting the range, we would have seen that nature actually produces a much stronger
relationship. (Because either variable can be the or variable, restricting the range of
has the same effect.)
REMEMBER Restricting the range of or scores leads to an underestimate
of the true strength of the relationship between the variables.
How do you avoid restricting the range? Generally, restriction of range occurs
when researchers are too selective when obtaining participants. Thus, if you study
the relationship between participants’ high school grades and their subsequent
salaries, don’t restrict the range of grades by testing only honor students: Measure all
students to get the entire range of grades. Or, if you’re correlating personality types
with degree of emotional problems, don’t study only college students. People with
severe emotional problems tend not to be in college, so you won’t have their scores.
Instead, include the full range of people from the general population. Likewise, any
task you give participants should not be too easy (because then everyone scores in a
narrow range of very high scores), nor should the task be too difficult (because then
everyone obtains virtually the same low score). In all cases, the goal is to allow a
wide range of scores to occur on both variables so that you have a complete descrip-
tion of the relationship.
STATISTICS IN PUBLISHED RESEARCH: CORRELATION COEFFICIENTS
In APA-style publications, the Pearson correlation coefficient is symbolized by r,
and the Spearman coefficient is symbolized by . Later we’ll also see other coeffi-
cients that are designed for other types of scores, and you may find additional, ad-
vanced coefficients in published research. However, all coefficients are interpreted
in the same ways that we have discussed: the coefficient will have an absolute value
between 0 and 1, with 0 indicating no relationship and 1 indicating a perfectly con-
sistent relationship.
In real research, however, a correlation coefficient near simply does not occur.
Recall from Chapter 2 that individual differences and extraneous environmental vari-
ables produce inconsistency in behaviors, which results in inconsistent relationships.
;1
r
S
YX
Y
YX
XY
X
X
Y
YX
154 CHAPTER 7 / The Correlation Coefficient
Restricted range
AB
Y scores
X scores
FIGURE 7.10
Scatterplot showing
restriction of range in
X scores

Therefore, adjust your expectations: Most research produces coefficients with absolute
values in the neighborhood of only .30 to .50. Thus, coefficients below .20 tend to be
considered very weak and often negligible. Coefficients around .40 are described as
strong and coefficients above .60 are uncommon and considered very strong. A corre-
lation near 1 is most likely a computational error.
Chapter Summary 155
It should be obvious why you should compute a correlation coefficient whenever you
have a relationship to summarize. It is the one number that allows you to envision and
summarize the important information in a scatterplot. For example, in our study on nerv-
ousness and the amount of coffee consumed, say that I tell you that the r in the study
equals .50. Without even seeing the data, you know this is a positive linear relationship
such that as coffee consumption increases, nervousness also tends to increase. Also, you
know that it is a rather consistent relationship so there are similar scores paired with an
, producing a narrow, elliptical scatterplot that hugs the regression line. And, you know
that coffee consumption is a reasonably good predictor of nervousness so, given some-
one’s coffee score, you’ll have considerable accuracy in predicting his or her nervousness
score. No other type of statistic so directly summarizes a relationship. Therefore, as you’ll
see in later chapters, even when you conduct an experiment, always think “correlation co-
efficient” to describe the strength and type of relationship you’ve observed.
Using the SPSS Appendix As shown in Appendix B.4, the SPSS program will calcu-
late the Pearson r, as well as computing the mean and standard deviation of the
scores and of the scores. SPSS will also compute the Spearman (even if your data
contains tied ranks.) Also, you may enter interval or ratio scores and the program will
first convert them to ranks and then compute .
CHAPTER SUMMARY
1. A scatterplot is a graph that shows the location of each pair of X–Y scores in the
data. An outlier is a data point that lies outside of the general pattern in the
scatterplot. It is produced when a participant has an unusual or score.
2. The regression line summarizes a relationship by passing through the center of the
scatterplot.
3. In a linear relationship, as the scores increase, the scores tend to change in
only one direction. In a positive linear relationship, as the scores increase, the
scores tend to increase. In a negative linear relationship, as the scores increase,
the scores tend to decrease. In a nonlinear, or curvilinear, relationship, as the
scores increase, the scores do not only increase or only decrease.
4. Circular or elliptical scatterplots that produce horizontal regression lines indicate
no relationship. Scatterplots with regression lines sloping up as increases indi-
cate a positive linear relationship. Scatterplots with regression lines sloping down
as increases indicate a negative linear relationship. Scatterplots producing wavy
regression lines indicate curvilinear relationships.
5. A correlation coefficient describes the type of relationship (the direction scores
change) and the strength of the relationship (the extent to which one value of is
consistently paired with one value of ).X
Y
Y
X
X
Y
XY
X
YX
YX
YX
r
S
r
S
Y
X
X
Y
1
PUTTING IT
ALL TOGETHER

6. A smaller absolute value of the correlation coefficient indicates a weaker, less
consistent relationship, with greater variability in scores at each , greater
vertical spread in the scatterplot, and less accuracy in predicting scores based
on correlated scores.
7. The Pearson correlation coefficient (r) describes the type (either positive or nega-
tive) and the strength of the linear relationship between two interval and/or ratio
variables.
8. The Spearman rank-order correlation coefficient ( ) describes the type and
strength of the linear relationship between two ordinal variables.
9. The restriction of range problem occurs when the range of scores from one or
both variables is limited. Then the correlation coefficient underestimates the
strength of the relationship that would be found if the range were not restricted.
10. Because a stronger relationship allows for greater accuracy in predicting scores,
researchers say the variable is a better predictor of scores, allowing us to ac-
count for more variance in .Y
YX
Y
r
S
X
Y
XY
156 CHAPTER 7 / The Correlation Coefficient
r
correlation coefficient 136
curvilinear relationship 141
linear relationship 139
negative linear relationship 141
nonlinear relationship 141
outlier 138
Pearson correlation coefficient 147
r
S
©XY
positive linear relationship 140
regression line 140
restriction of range 153
scatterplot 138
Spearman rank-order correlation
coefficient 152
strength of a relationship 142
type of relationship 139
KEY TERMS
REVIEW QUESTIONS
(Answers for odd-numbered questions are in Appendix D.)
1. What is the difference between an experiment and a correlational study in terms
of how the researcher (a) collects the data? (b) examines the relationship?
2. (a) You have collected data that you think show a relationship. What do you do
next? (b) What is the advantage of computing a correlation coefficient? (c) What
two characteristics of a linear relationship are described by a correlation
coefficient?
3. What are the two reasons why you can’t conclude you have demonstrated a causal
relationship based on correlational research?
4. (a) When do you compute a Pearson correlation coefficient? (b) When do you
compute a Spearman coefficient?
5. (a) What is a scatterplot? (b) What is an outlier? (c) What is a regression line?
6. Why can’t you obtain a correlation coefficient greater than ?;1

7. (a) Define a positive linear relationship. (b) Define a negative linear relationship.
(c) Define a curvilinear relationship.
8. As the value of r approaches , what does it indicate about the following?
(a) The consistency in the X–Y pairs; (b) the variability of the scores at each ;
(c) the closeness of scores to the regression line; (d) the accuracy with which we
can predict if is known.
9. What does a correlation coefficient equal to 0 indicate about the four characteris-
tics in question 8?
10. (a) What is the restriction of range problem? (b) What produces a restricted
range? (c) How is it avoided?
11. (a) What does a researcher mean when he states that a particular variable is a
“a good predictor?” (b) What does a researcher mean when she says an variable
accounts for little of the variance in ?
APPLICATION QUESTIONS
12. For each of the following, indicate whether it is a positive linear, negative linear,
or nonlinear relationship: (a) Quality of performance increases with increased
arousal up to an optimal level; then quality of performance decreases with
increased arousal. (b) Overweight people are less healthy . (c) As number
of minutes of exercise increases each week , dieting individuals lose more
pounds . (d) The number of bears in an area decreases as the area becomes
increasingly populated by humans .
13. Poindexter sees the data in question 12d and concludes, “We should stop people
from moving into bear country so that we can preserve our bear population.”
What is the problem with Poindexter’s conclusion?
14. For each of the following, give the symbol for the correlation coefficient you
should compute. You measure (a) SAT scores and IQ scores; (b) taste rankings of
tea by experts and those by novices; (c) finishing position in a race and amount of
liquid consumed during the race.
15. Poindexter finds that between the variables of number of hours
studied and number of errors on a statistics test (Y). He also finds that
between the variables of time spent taking the statistics test and
the number of errors on the test. He concludes that the time spent taking a test
forms a stronger relationship with the number of errors than does the amount
of study time. (a) Describe the relative shapes of the two scatterplots.
(b) Describe the relative amount of variability in scores at each in each
study. (c) Describe the relative closeness of scores to the regression line
in each study. (d) Is Poindexter correct in his conclusion? If not, what’s his
mistake?
16. In question 15, (a) which variable is a better predictor of test errors and how do
you know this? (b) Which variable accounts for more of the variance in test errors
and how do you know this?
17. Foofy and Poindexter study the relationship between IQ score and high school
grade average, measuring a large sample of students from PEST (the Program
for Exceptionally Smart Teenagers), and compute . They conclude
that there is virtually no relationship between IQ and grade average. Should
you agree or disagree with this conclusion? Is there a problem with their study?
r 51.03
Y
XY
r 51.36
1X2
r 52.40
1X2
1Y21Y2
1X2
1Y21X2
1X2
1Y2
Y
X
XY
Y
XY
;1
Application Questions 157