Heiman G. Basic Statistics for the Behavioral Sciences
Подождите немного. Документ загружается.


19. You want to know if a nurse’s absences from work in one month can be
predicted by knowing her score on a test of psychological “burnout” .
What do you conclude from the following ratio data?
1X2
1Y2
158 CHAPTER 7 / The Correlation Coefficient
Errors Satisfaction
Participant XY
193
282
348
465
574
6102
757
Burnout Absences
Participant XY
124
217
326
439
546
648
777
8710
9811
20. In the following data, the scores reflect participants’ rankings in a freshman
class, and the scores reflect their rankings in a sophomore class. To what extent
do these data form a linear relationship?
Y
X
Fresh. Soph.
Participant XY
123
297
312
459
531
678
744
865
986
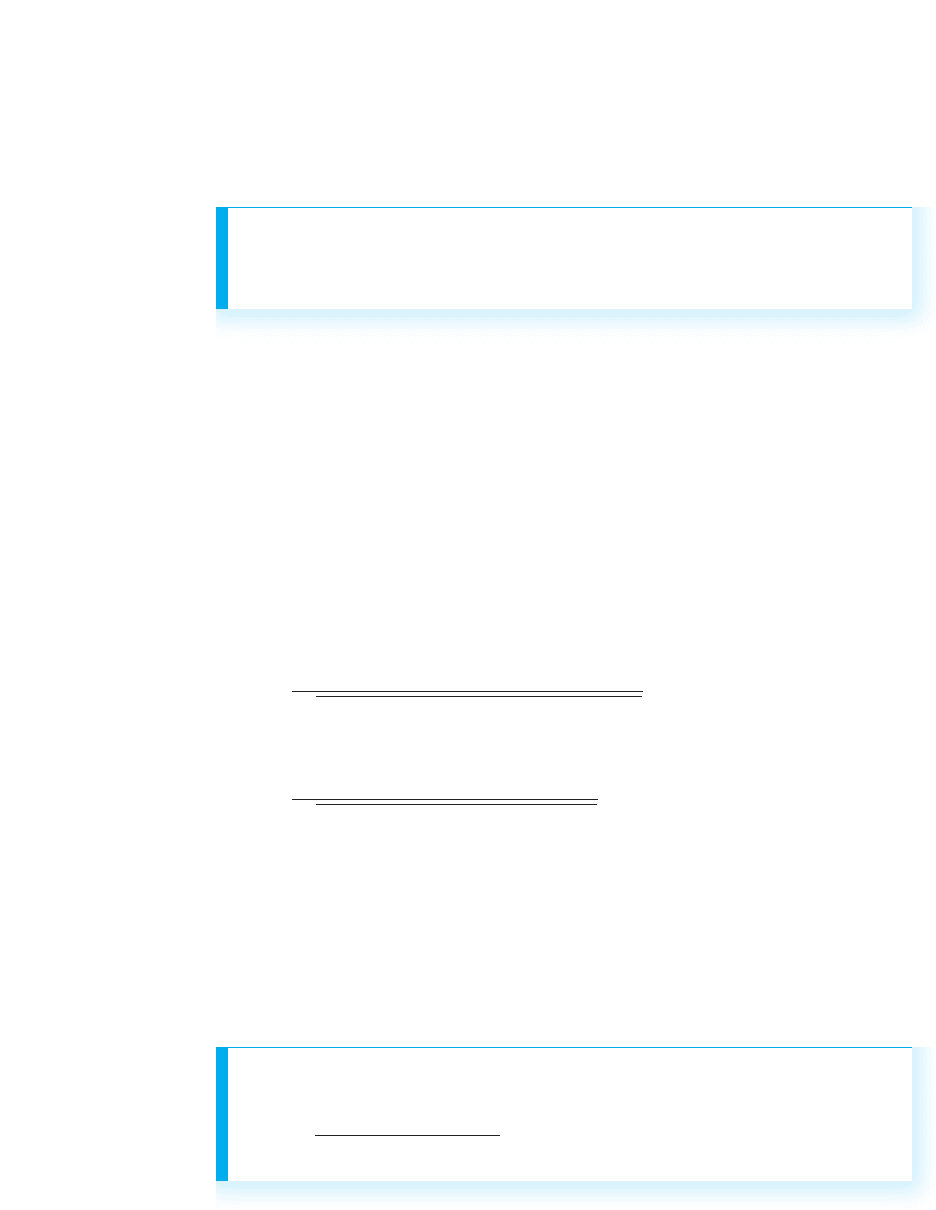
18. A researcher measures the following scores for a group of people. The
variable is the number of errors on a math test, and the variable is the
person’s level of satisfaction with his/her performance. (a) With such
ratio scores, what should the researcher conclude about this relationship?
(Hint: Compute something!) (b) How well will he be able to predict satisfac-
tion scores using this relationship?
Y
X
INTEGRATION QUESTIONS
22. In an experiment, (a) which variable is assumed to be the causal variable? (b)
Which variable is assumed to be caused? (c) Which variable does the researcher
manipulate? (d) Which variable occurs first? (Ch. 2)
23. In a correlational study, we measure participants’ creativity and their intelligence.
(a) Which variable does the researcher manipulate? (b) Which variable is the
causal variable? (c) Which variable occurred first? (d) Which variable is called the
independent variable? (Chs. 2, 7)
24. In question 23, (a) How would you determine which variable to call ? (b) In a
different study, my title is “Creativity as a function of Intelligence.” Which
variable is my variable? Why? (Ch. 2)
25. Indicate which of the following is a correlational design and the correlation coeffi-
cient to compute. (a) We measure participants’ age and their daily cell phone us-
age. (b) We separate participants into three age groups, and then observe their cell
phone usage during a one hour period. (c) A teacher uses students’ grades on their
first exam to predict their final exam grades. (d) We ask whether a website rated
as most attractive has more visitors than one rated as second most attractive, and
so on, for the top ten websites. (e) We compare performance on an attention test
of people who were and were not given an energy drink. (Chs. 2, 7)
X
X
Integration Questions 159
21. A researcher observes the behavior of a group of monkeys in the jungle. He deter-
mines each monkey’s relative position in the dominance hierarchy of the group
(1 being most dominant) and also notes each monkey’s relative weight (1 being
the lightest). What is the relationship between dominance rankings and weight
rankings in these data?
Dominance Weight
Participant XY
1110
228
356
447
595
673
739
864
981
10 10 2
■ ■ ■ SUMMARY OF
FORMULAS
1. The formula for the Pearson r is
r 5
N1©XY22 1©X21©Y2
23N1©X
2
22 1©X2
2
43N1©Y
2
22 1©Y2
2
4
2. The formula for the Spearman is
r
S
5 1 2
61©D
2
2
N1N
2
2 12
r
S

Recall that, in a relationship, particular scores are naturally paired with certain
scores. Therefore, if we know an individual’s score and the relationship between
and , we can predict the individual’s score. The statistical procedure for making
such predictions is called linear regression. In the following sections, we’ll examine
the logic behind regression and see how to use it to predict scores. Then we’ll look at
ways of measuring the errors in prediction.
NEW STATISTICAL NOTATION
We use the following symbols for distinguishing participants’ actual scores from the scores
that we predict for them: As usual, stands for a participant’s actual score. The symbol
for a predicted score is . The “ ” is called prime, so this symbol is pronounced
“ prime.”
Also, for a sample of scores, we will discuss the mean , sample variance ,
and sample standard deviation . These involve the same formulas we used previ-
ously, except now we plug in scores.
Thus,
and and
S
Y
5
R
©Y
2
2
1©Y2
2
N
N
S
2
Y
5
©Y
2
2
1©Y 2
2
N
N
Y 5
©Y
N
Y
1S
Y
2
1S
2
Y
21Y2Y
Y
¿Y¿Y
Y
YY
XX
XY
GETTING STARTED
To understand this chapter, recall the following:
■
From Chapter 5, that when the mean is the predicted score, the variance
reflects the “average error” in predictions.
■
From Chapter 7, that the larger an , the more consistent the relationship, so the
closer the scores are to each other at an , and the closer they are to the
regression line. Also, the larger an , the better we can predict scores and
“account for variance.”
Your goals in this chapter are to learn
■
How a regression line summarizes a scatterplot.
■
How the regression equation is used to predict the Y scores at a given X.
■
How the standard error of the estimate measures the errors in prediction.
■
How the strength of the relationship determines our accuracy in predicting
Y scores.
■
What the proportion of variance accounted for tells us and how to compute it.
Yr
XY
r
Linear Regression
8
160
WHY IS IT IMPORTANT TO KNOW ABOUT LINEAR REGRESSION?
A goal of research is to be able to predict when different behaviors will occur. This
translates into predicting when someone has one score on a variable and when they
have a different score. We use relationships to make these predictions. It’s important
that you know about linear regression because it is the statistical procedure for using a
relationship to predict scores. Linear regression is commonly used in basic and applied
research, particularly in educational, industrial and clinical settings. For example, the
reason that students take the Scholastic Aptitude Test (SAT) when applying to some
colleges is because, from previous research we know that SAT scores are somewhat
positively correlated with college grades. Therefore, through regression techniques, the
SAT scores of applying students are used to predict their future college performance. If
the predicted grades are too low, the student is not admitted to the college. This
approach is also used when people take a test when applying for a job so that the
employer can predict who will be better workers, or when clinical patients are tested to
identify those at risk of developing emotional problems.
REMEMBER The importance of linear regression is that it is used to predict
unknown scores based on the scores from a correlated variable.
UNDERSTANDING LINEAR REGRESSION
Regression procedures center around drawing the linear regression line, the summary
line drawn through a scatterplot. We use regression procedures in conjunction with the
Pearson correlation. While is the statistic that summarizes the linear relationship, the
regression line is the line on the scatterplot that summarizes the relationship. Always
compute first to determine whether a relationship exists. If the correlation coefficient
is not 0 and passes the inferential test, then perform linear regression to further summa-
rize the relationship.
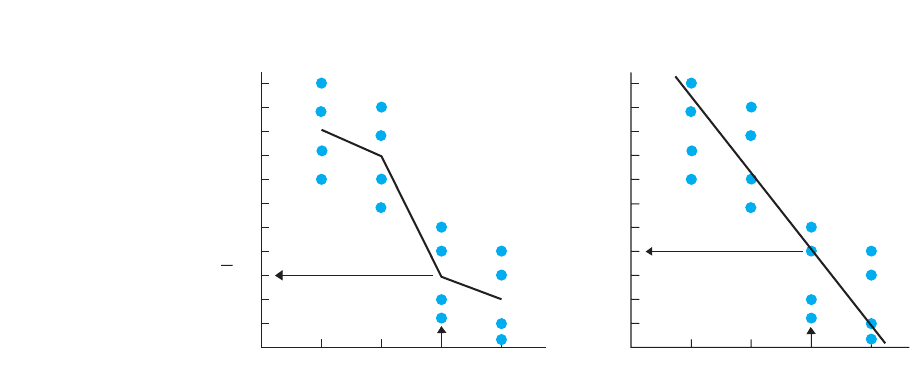
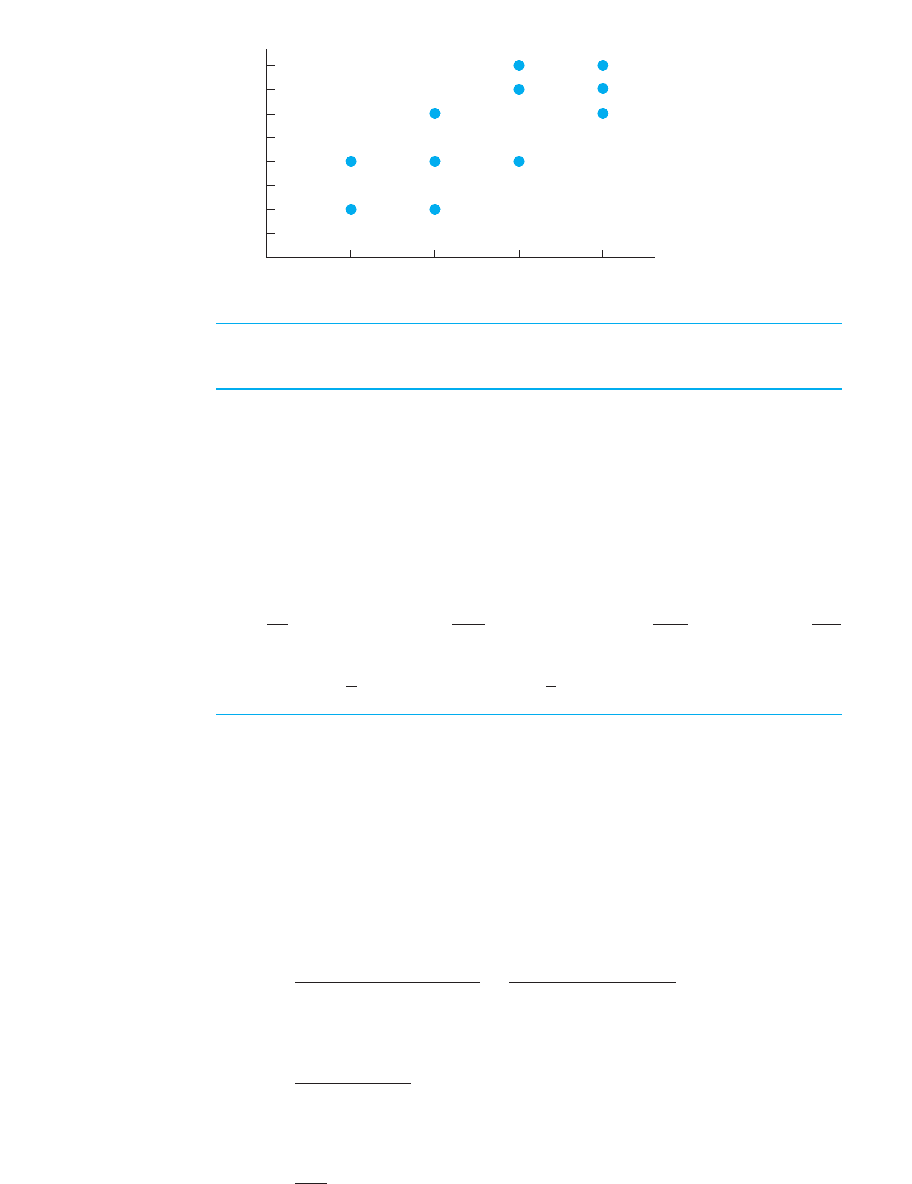
An easy way to understand a regression line is to compare it to a line graph of an
experiment. In Chapter 4, we created a line graph by plotting the mean of the scores
for each condition—each —and then connecting adjacent data points with straight
lines. The left-hand graph in Figure 8.1 shows the scatterplot and line graph of an
experiment containing four conditions. Thus, for example, the arrows indicate that the
mean of at is 3. Because the mean is the central score, we assume that those
participants at scored around a of 3, so (1) 3 is our best single description of their
scores, and (2) 3 is our best prediction for anyone else at that
It is difficult, however, to see the linear (straight-line) relationship in these data
because the means do not fall on a straight line. Therefore, as in the right-hand graph in
Figure 8.1, we summarize the linear relationship by drawing a regression line. Think of
the regression line as a straightened-out version of the line graph: It is drawn so that it
comes as close as possible to connecting the mean of at each while still producing a
straight line. Although not all means are on the line, the distance that some means are
above the line averages out with the distance that other means are below the line. Thus,
the regression line is called the best-fitting line because “on average” it passes through
the center of the various means. Because each mean is located in the center of the cor-
responding scores, the regression line also passes through the center of the scores.
Thus, the linear regression line is the straight line that summarizes the linear relation-
ship in a scatterplot by, on average, passing through the center of the scores at each .XY
YY
YY
XY
X.
YX
3
X
3
Y
X
Y
r
r
XY
Understanding Linear Regression 161
162 CHAPTER 8 / Linear Regression
As usual, this is another descriptive procedure that allows us to summarize and envi-
sion data. Think of the regression line as reflecting the linear relationship hidden in the
data. Because the actual scores fall above and below the line, the data only more or
less fit this line. But we have no system for drawing a “more or less” linear relation-
ship. Therefore, the regression line is how we envision what a perfect version of the
linear relationship in the data would look like.
You should read the regression line in the same way that you read any graph: Travel
vertically from an until you intercept the regression line. Then travel horizontally
until you intercept the axis. For example, the arrows in the right-hand graph of
Figure 8.1 show that the value of at is now 4. The symbol for this value is and
it is our predicted score. A is a summary of the scores for that , based on the
entire linear relationship. Therefore, considering the entire relationship in Figure 8.1,
those participants at scored around 4, so 4 is our best prediction for anyone scoring
that . Likewise, any is our best prediction of the scores at a corresponding ,
based on the linear relationship that is summarized by the regression line.
Recognize that the at any is the value of falling on the regression line. The
regression line therefore consists of the data points formed by pairing each possible
value of with its corresponding value of . If you think of the line as reflecting a per-
fect version of the linear relationship hidden in the data, then each is the score
everyone would have at a particular if a perfect relationship were present.
REMEMBER The linear regression line summarizes the linear relationship in
a sample and is used to obtain the at any .
Now you can see how regression techniques are used to predict unknown scores.
First, we establish the relationship in a sample. Then we use the regression line to
determine the for each . This is the around which everyone scored when at an
in our sample. For anyone else at that , we’d assume they too would score around
that Therefore, we can measure the scores of individuals who were not in our
sample, and the corresponding is our best prediction of their scores.
The emphasis on prediction in correlation and regression leads to two important
terms. We’ll discuss using the variable to predict scores. (There are procedures out
there for predicting scores from .) Therefore, as mentioned in the previous chapter,
the variable is called the predictor variable. The variable is called the criterion
variable. Thus, when SAT scores are used to predict a student’s future college grades,
YX
YX
YX
YY¿
XY¿.
X
XYXY¿
XY¿
X
YY¿
Y¿X
YXY¿
XYY¿X
X
3
XYY¿Y
Y¿X
3
Y
Y
X
Y
FIGURE 8.1
Comparison of a line
graph and a regression
line
Each data point is formed
by an X–Y pair. Each
asterisk (*) indicates the
mean score at an .XY
11
10
9
8
7
6
5
4
Y = 3
2
1
✻
11
10
9
8
7
6
5
Y ′ = 4
3
2
1
Line graph
✻
✻
✻
✻
✻
✻
✻
0
0
Regression line
X
1
X
2
X
3
X
4
X
1
X
2
X
3
X
4
The Linear Regression Equation 163
SAT scores are the predictor variable, and college grade average is the criterion vari-
able. (To remember criterion, remember that your predicted grades must meet a certain
criterion for you to be admitted to the college.)
The first step in using regression techniques is to create the regression line. For that
we use the linear regression equation.
THE LINEAR REGRESSION EQUATION
To draw a regression line, we don’t simply eyeball the scatterplot and sketch in some-
thing that looks good. Instead, we use the linear regression equation. The linear
regression equation is the equation for a straight line that produces the value of at
each and thus defines the straight line that summarizes a relationship. When we plot
the data points formed by the X–Y pairs and draw a line connecting them, we have the
regression line. The regression equation describes two characteristics of the regression
line: its slope and its intercept.
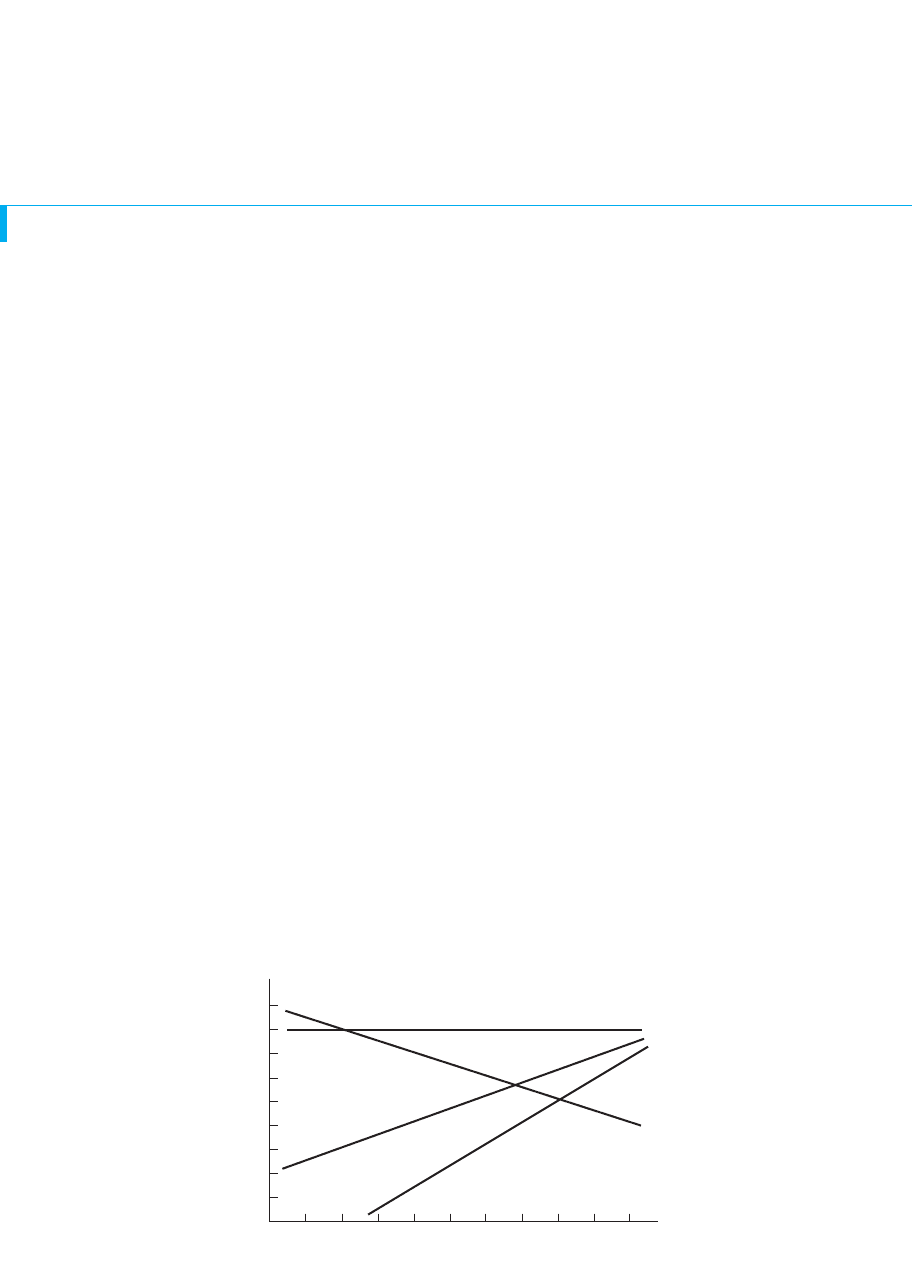
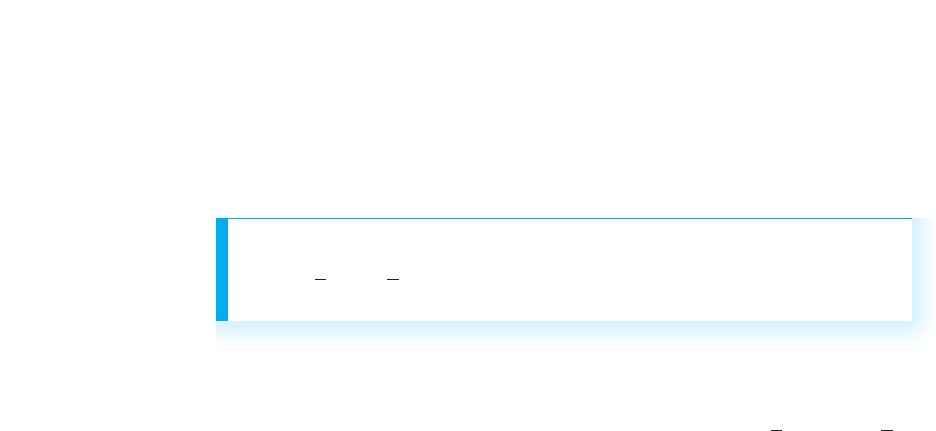
The slope is a number that indicates how slanted the regression line is and the direc-
tion in which it slants. Figure 8.2 shows examples of regression lines having different
slopes. When no relationship is present, the regression line is horizontal, such as line A,
and the slope is zero. A positive linear relationship produces regression lines such as
B and C; each of these has a slope that is a positive number. Because line C is steeper,
its slope is a larger positive number. A negative linear relationship, such as line D, yields
a slope that is a negative number.
The intercept is the value of at the point where the regression line intercepts, or
crosses, the axis. In other words, the intercept is the value of when equals 0. In
Figure 8.2, line B intercepts the axis at , so the intercept is . If we extended
line C, it would intercept the axis at a point below the axis, so its intercept is a
negative score. Because line D reflects a negative relationship, its intercept is the
relatively high score of 9. Finally, line A exhibits no relationship, and its intercept
equals . Notice that here the predicted score for every is always .
When there is no relationship, the regression line is flat and every
equals the intercept.
The regression equation works like this: The slope indicates the direction in which
the change as increases and the rate at which they change. In Figure 8.2, the
steeply sloped line C reflects a relatively large increase in for each increase in , asXY
XYs
Y
Y¿
18XY18
YY
YY
YXY
12Y12Y
XY¿Y
YY
Y
¿
X
Y¿
FIGURE 8.2
Regression lines having
different slopes and
Y intercepts
Line A indicates no relation-
ship, lines B and C indicate
positive relationships having
different slopes and inter-
cepts, and line D indicates a
negative relationship.
Y
0
1
9
8
7
6
5
4
3
2
1
A
D
B
C
2345678910
X scores
Y scores
164 CHAPTER 8 / Linear Regression
compared to, line B. The intercept indicates the starting point from which the
scores begin to change. Thus, together, the slope and intercept describe how, starting at
a particular score, the scores tend to change by a specific amount as the scores
increase. The summary of the new scores at each is
The symbol for the slope of the regression line is . The symbol for the intercept
is . Thena
Yb
Y¿.XY
XYY
YY
This formula says that to find the value of for a given , multiply the slope (b) times
and then add the intercept (a).
As an example, say that we have developed a test to identify (predict) those indi-
viduals who will be good or bad workers at a factory that makes “widgets.” The first
step is to determine the relationship between test scores and “widget-making.”
Therefore, say that we give the test to an unrealistically small of 11 people and
then measure the number of widgets each makes in an hour. Figure 8.3 shows the
raw scores and resulting scatterplot. The predictor (X) variable is participants’
scores on the widget test, and the criterion (Y) variable is the number of widgets
they produced.
The first step is to find :
so
The result is . This is a very strong, positive linear relationship, and so the test
will be what researchers call “a good predictor” of widget-making. Therefore, the next
step is to compute the linear regression equation. To do that, we compute the slope and
the intercept.
Compute the slope first.
Computing the Slope
Y
r 51.74
r 5
11117122 12921582
231118922 8414311135422 33644
r 5
N1©XY22 1©X21©Y2
23N1©X
2
22 1©X2
2
43N1©Y
2
22 1©Y2
2
4
r
N
YX
XY¿
The linear regression equation is
Y¿ 5 bX 1 a
The formula for the slope of the linear regression line is
b 5
N1©XY22 1©X21©Y2
N1©X
2
22 1©X2
2
is the number of pairs of scores in the sample, and and are the scores in the
sample. This is not a difficult formula because we typically compute the Pearson
first. The numerator of the formula for is the same as the numerator in the
formula for , and the denominator of the formula for is the left-hand quantity in
the denominator of the formula for . [An alternative formula for the slope is
For the widget study, substituting the appropriate values into the formula gives
After multiplying and subtracting in the numerator,
After completing the denominator,
b 5
199
138
511.44
b 5
199
1118922 841
b 5
N1©XY22 1©X21©Y2
N1©X
2
22 1©X2
2
5
11117122 12921582
1118922 841
b 5 1r21S
Y
>S
X
2.4
r
br
b
r
YXN
The Linear Regression Equation 165
0
Widget test scores
8
7
6
5
4
3
2
1
Widgets per hour
1234
FIGURE 8.3
Scatterplot and data
for widget study
Widget Test Score: Widgets per Hour:
Participant XYXY
11 22
21 44
32 48
42 612
52 24
63 412
73 721
83 824
94 624
10 4 8 32
11 4 7 28
Y 5 58>11 5 5.27 X 5 29>11 5 2.64
1©Y2
2
5 3364 1©X2
2
5 841
©Y
2
5 354 ©X
2
5 89
©XY 5 171 ©Y 5 58 ©X 5 29N 5 11
166 CHAPTER 8 / Linear Regression
Thus, the slope of the regression line for the widget study is . This positive slope
indicates a positive relationship, which fits with the positive of . Had the rela-
tionship been negative, the formula would have produced a negative number here.
We are not finished yet. Now compute the intercept.
Computing the Y Intercept
Y
1.74r
11.44
The formula for the Y intercept of the linear regression line is
a 5 Y 2 1b21X2
First, multiply the mean of all scores times the slope of the regression line. Then
subtract that quantity from the mean of all scores.
For the widget study, is , and from the data in Figure 8.3, is 5.27 and is
2.64. Filling in the above formula gives
After multiplying,
Thus, the intercept of the regression line for the widget study is .
We’re still not finished!
Describing the Linear Regression Equation
Once you have computed the intercept and the slope, rewrite the regression equation,
substituting the computed values for and . Thus, for the widget study,
This is the finished regression equation that describes the linear regression line for the
relationship between widget test scores and widgets-per-hour scores.
We’re still not finished. Next we plot the regression line.
Plotting the Regression Line
We use the finished regression equation to plot our linear regression line. To draw a
line, we need at least two data points, so choose a low and high score, insert each into
the regression equation, and compute the for that . (Or, an easy low to use is 0
because then equals the intercept.) We’ll use the widget test scores of 1 and 4. We
begin with our finished regression equation:
For , we have
Multiplying times 1 and adding 1.47 yields a of 2.91. Likewise, for
.Y¿ 511.441421 1.47 5 5.76 1 1.47 5 7.23
X 5 4,Y¿11.44
Y¿ 511.441121 1.47 5 2.91
X 5 1
Y¿ 511.44X 1 1.47
YY¿
XXY¿
X
Y¿ 511.44X 1 1.47
ba
Y
11.47Y
a 5 5.27 2 113.802511.47
a 5 5.27 2 111.44212.642
X
Y11.44b
Y
X
The Linear Regression Equation 167
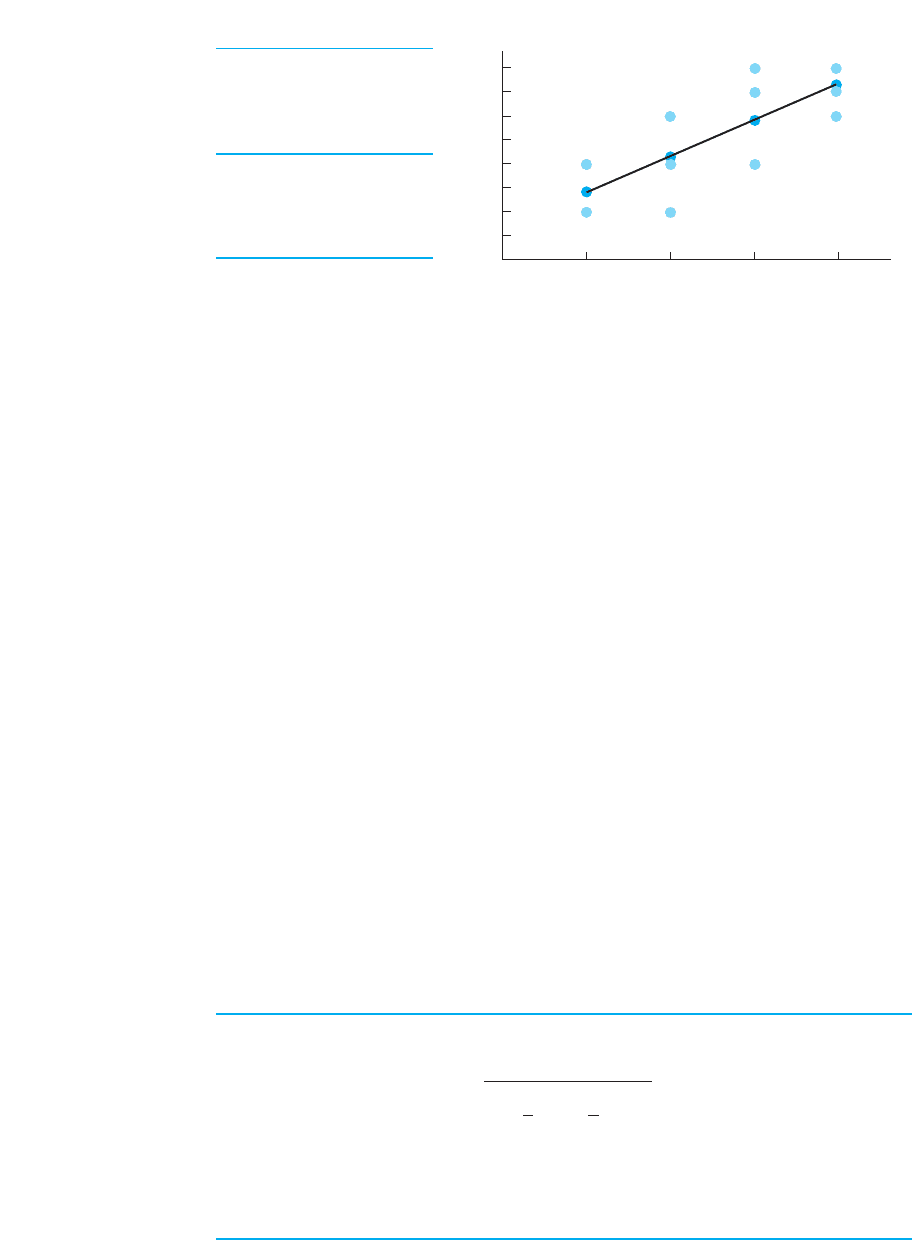
To graph the regression line, plot the data points for the previous X–Y pairs and
draw the line. As shown in Figure 8.4, our widget regression line passes through the
center of the original scatterplot, showing the straight-line relationship hidden in the
data.
(We’re almost there!)
Computing Predicted Y Scores
Remember that the regression line consists of all possible X–Y pairs. Therefore, we
also use the finished regression equation to predict anyone’s score if we know their
score. Thus, as we computed above, we will predict a of 2.91 for anyone scoring
an of 1, and a of 7.23 for anyone scoring an of 4. Likewise, for the test scores of
2 and 3, we compute the scores of 4.35 and 5.79, respectively. As shown in Figure
8.4, these data points also fall on the regression. In fact, computing any using the
equation is the equivalent of going to the graph and traveling vertically from the
score up to the regression line and then left to the value of on the axis.
We can compute for any value of that falls within the range of in our data,
even if it’s a score not found in the original sample: No one scored an of 1.5, but
entering this in the regression equation yields a predicted score of 3.63. Do not, how-
ever, make predictions using scores beyond the original scores. Our regression equa-
tion is based only on widget test scores between 1 and 4, so we shouldn’t predict a
for an of, for example, 6. This is because we can’t be sure what the nature of the
relationship is at 6—maybe it’s curvilinear or has a steeper slope.
Now we are finished (really). Putting all of this together, the preceding computations
are summarized in Table 8.1.
X
Y
X
Y
X
XsXY¿
YY¿X
Y¿
Y¿
XY¿X
Y¿X
Y
¿
¿
1. Compute .
2. Compute the slope, , where
3. Compute the intercept, , where
4. Substitute the values of a and b into the formula for the regression equation:
5. Plot the regression line.
6. Compute the predicted score for any . XY¿
Y¿ 5 1b21X21 a
a 5 Y
2 1b21X2aY
b 5
N1©XY22 1©X21©Y2
N1©X
2
22 1©X2
2
b
r
TABLE 8.1
Summary of steps in
Linear Regression
0
8
7
6
5
4
3
2
1
Widget test scores
1234
Widgets per hour
FIGURE 8.4
Regression line for
widget study
Widget Predicted
Test Widgets
Scores: per Hour:
XY
1 2.91
2 4.35
3 5.79
4 7.23