Heiman G. Basic Statistics for the Behavioral Sciences
Подождите немного. Документ загружается.


168 CHAPTER 8 / Linear Regression
DESCRIBING ERRORS IN PREDICTION
Not all relationships are the same and so not all variables are “good predictors.” There-
fore, a complete description of a relationship includes the descriptive statistics that sum-
marize the error we have when using the relationship to predict scores. To describe the
amount of prediction error we expect when predicting unknown scores, we first determine
how well we can predict the actual scores in our sample: We pretend we don’t know
the scores, predict them, and then compare the predicted scores to the actual scores.
The error in a single prediction is the amount that a participant’s score differs from
the corresponding predicted score: In symbols this is , and it is literally the dif-
ference between the score a participant got and the score we predict he or she got. The
predictions for some participants will be closer to their actual scores than for others,
so we would like to compute something like the average error across all predictions.
To find the average error, we first compute for everyone in the sample and sub-
tract their from their actual score. Statisticians equate errors with deviations, soYY¿
Y¿
Y
Y 2 Y¿Y¿
Y
YY¿
Y
Y
X
■
The linear regression equation is used to predict
scores based on scores from a correlated
variable and to draw the linear regression line.
■
The regression equation is , where is
the slope and is the intercept.
MORE EXAMPLES
To use to predict in these scores,
XY
13
12
24
25
35
36
Compute b:
and .
Compute , , and .
After rounding Y¿ 511.5X 1 1.17.
a 5 Y
2 1b21X25 4.167 2 111.521225 1.167
Y 5 4.167X 5 2a: b 511.5
5
336 2 300
168 2 144
511.5
b 5
N1©XY22 1©X21©Y2
N1©X
2
22 1©X2
2
5
615622 11221252
612822 1122
2
N 5 6©XY 5 56,
©X
2
5 28,©Y 5 25,©X 5 12,
YX
Ya
bY¿ 5 bX 1 a
XY¿
Say we want to predict for when . The is
.
For Practice
1. We use linear regression when we want to ______.
2. The components of the regression equation to
compute first are the ______ and ______.
3. Compute b for the following scores:
XY
15
13
24
23
32
41
4. Compute for these scores.
5. What is the predicted score for an of 2?
Answers
1. predict scores using the relationship with
2. slope and intercept
3.
4.
5. Y¿ 2 121.02421221 5.219 513.171
5 3 2 122.2.192515.219
a 5 Y
2 1b21X25 3 2 121.024212.1672
b 5
613222 11321182
613522 1132
2
521.024
Y
XY
XY
a
Y¿ 511.51221 1.17 5 3 1 1.17 5 4.17
Y¿X 5 2Y
A QUICK REVIEW

Describing Errors in Prediction 169
equals the amount that deviates from To get the average error, we would
like to simply sum these deviations and then find the average, but we cannot. Recall
that the regression line is in the center of the scatterplot. Therefore, the are equally
spread out around their scores, in the same way that previously we saw that are
spread out around their Because of this, like with the mean, the positive and nega-
tive deviations with Y will cancel out, always producing a sum equal to zero. Therefore,
the average deviation—the average error—will always equal zero.
To solve this problem, we square each deviation. The sum of the squared deviations
of is not necessarily zero, so neither is the average squared deviation. (Does this
sound familiar?) When we find the average of the squared deviations, the answer is a
type of variance that describes the “average” spread of the actual scores around—
above and below—their predicted scores.
Computing the Variance of the Y Scores Around Y
The variance of the scores around is the average squared difference between the
actual scores and their corresponding predicted scores. The symbol for this sam-
ple variance is . The indicates sample variance or error, and the subscript indi-
cates that it is the error associated with using to predict scores. The formula that
defines the variance of the scores around is
Like other definitional formulas we’ve seen, this formula is important because it shows
the core calculation involved: We subtract the predicted for each participant from his
or her actual score giving us a measure of our error. Then we square each deviation,
sum the squared deviations, and divide by . The answer is one way to measure roughly
the “average” amount of error we have when we use linear regression to predict scores.
Note: Among the approaches we might use, the regression procedures described in
this chapter produce the smallest error in predictions possible, thereby producing the
smallest sum of squared deviations possible. Researchers call this regression technique
the “least-squares method.” To get this name, they shorten “sum of squared deviations”
to squares, and this method produces a sum that is the least it can be.
REMEMBER The variance of the scores around is one way to
describe the average error when using linear regression to predict scores.
Using the above definitional formula for is very time consuming. Thankfully,
there is a better way. In the defining formula, we can replace with the formulas for
finding (for finding a, b, and so on). Among all of these formulas we’ll find the com-
ponents for the following computational formula.
Y¿
Y¿
S
2
Y
¿
Y
1S
2
Y
¿
2Y¿Y
Y
N
Y
Y¿
S
2
Y
¿
5
©1Y 2 Y¿2
2
N
Y¿Y
YY¿
Y¿S
2
S
2
Y
¿
Y¿Y
Y¿Y
9
Y¿
Y
Y 2 Y¿
X.
XsY¿
Ys
Y¿.YY 2 Y¿
The computational formula for the variance of the Y scores
around Y is
S
2
Y
¿
5 S
2
Y
11 2 r
2
2
9
Much better! This formula uses (which we compute before doing regression anyway)
and, in computing , we compute the and needed for finding the variance in©Y
2
©Yr
r

170 CHAPTER 8 / Linear Regression
the scores. Therefore, finish the computations of using the formula at the begin-
ning of this chapter. Then this formula says to square and subtract the answer from 1.
Multiply the result times . The answer is .
In the widget study, the data back in Figure 8.3 produced , with
, and Therefore, we find that is
Then the above formula gives
After squaring and subtracting the result from 1, we have
Thus, we are “off” by something like an “average” of 2.01 when we predict partici-
pants’ widget-per-hour scores (Y) based on their widget test scores (X).
Although this variance is a legitimate way to compute the error in our predictions, it
is only somewhat like the “average” error, because of the usual problems when
interpreting variance. First, squaring each difference between and produces an
unrealistically large number, inflating our error. Second, squaring produces error that is
measured in squared units, so our predictions above are off by 2.01 squared widgets.
(This must sound familiar!) The solution is to find the square root of the variance, and
the result is a type of standard deviation. To distinguish the standard deviation found in
regression, we call it the standard error of the estimate.
Computing the Standard Error of the Estimate
The standard error of the estimate is similar to a standard deviation of the scores
around their scores. It is the clearest way to describe the “average error” when using
to predict scores. The symbol for the standard error of the estimate is . (Remem-
ber, measures the error in the sample, and is our estimate of a participant’s
score.) The definitional formula for the standard error of the estimate is
This is the same formula used previously for the variance of scores around , except
with the added square root sign. By computing the square root, the answer is a more
realistic number and we are no longer dealing with a squared variable. The core calcu-
lation, however, is still to find the error between participants’ actual scores and their
predicted scores, and this is as close as we will come to computing the “average
error” in our predictions.
To create a computational formula for the standard error of the estimate, we find the
square root of each component of the previous computational formula for the variance
of around and haveY¿Y
Y¿
Y
Y¿Y
S
Y
¿
5
B
©1Y 2 Y¿2
2
N
Y
Y¿S
S
Y¿
YY¿
Y¿
Y
Y¿Y
S
2
Y
¿
5 4.3801.45825 2.01
1.736
S
2
Y
¿
5 4.38011 2 .736
2
2
S
2
Y
5
©Y
2
2
1©Y2
2
N
N
5
354 2
1582
2
11
11
5
354 22305.818
11
5 4.380
S
2
Y
N 5 11.©Y
2
5 354
©Y 5 58,r 51.736
S
2
Y
¿
S
2
Y
r
S
2
Y
Y
The computational formula for the standard error of the
estimate is
S
Y
¿
5 S
Y
21 2 r
2
Describing Errors in Prediction 171
Here we first compute the standard deviation of all scores using the formula at
the beginning of this chapter. Then we find the square root of the quantity and
then multiply it times the standard deviation of all scores.
For the widget study, we computed that was and that the variance of all
scores was 4.380. The standard deviation of the scores is the square root of
the variance, so Filling in the above formula gives
Squaring yields , which subtracted from 1 gives . The square root of
is . Thus,
The standard error of the estimate is 1.42. Therefore, we conclude that when using the
regression equation to predict the number of widgets produced per hour based on a per-
son’s widget test score, when we are wrong, we will be wrong by an “average” of about
widgets per hour.
REMEMBER The standard error of the estimate is interpreted as describing
the “average error” in our predictions when we use to predict scores.
It is appropriate to compute the standard error of the estimate anytime you compute
a correlation coefficient, even if you do not perform regression—it’s still important to
know the average prediction error that your relationship would produce.
YY¿
1S
Y
¿
2
1 .42
S
Y
¿
5 2.0931.67725 1.42
.677.458
.458.5421.736
S
Y
¿
5 2.09321 2 .736
2
S
Y
5 24.380 5 2.093.
Y1S
2
Y
2Y
1.736r
Y
1 2 r
2
1S
Y
2Y
■
The variance of the scores around and the
standard error of the estimate measure the
errors in prediction when using regression, which
are the differences between participants’ and
scores.
MORE EXAMPLES
To compute first compute and . Say that
and . Then
Using this relation-
ship produces an “average error” of 3.16. The variance
of the scores around is , or 9.986.13.162
2
S
2
Y
¿
Y¿Y
5 13.621.87725 3.1572 5 3.16.
3.62.76963.621 2 .2304 53.621 2 12.48
2
25
S
Y
¿
5 S
Y
21 2 r
2
5r 52.48S
Y
5 3.6
rS
Y
S
Y
¿
Y¿
Y
1S
Y¿
2
1S
2
Y¿
2Y¿Y
For Practice
1. The symbol for the variance of the scores around
is ______.
2. The symbol for the standard error of the estimate
is ______.
3. The statistic we interpret as the “average error” in
our predictions when using regression is ______.
4. If and , then equals ______.
Answers
1.
2.
3. The standard error of the estimate,
4. S
Y
¿
5 2.821 2 1.34
2
25 2.82.8844 5 2.63
S
Y
¿
S
Y
¿
S
2
Y
¿
S
Y
¿
r 51.34S
Y
5 2.8
Y¿
Y
A QUICK REVIEW
Interpreting the Standard Error of the Estimate
In order for (and ) to accurately describe our prediction error, and for to accu-
rately describe the relationship, you should be able to assume that your data generally
meet two requirements.
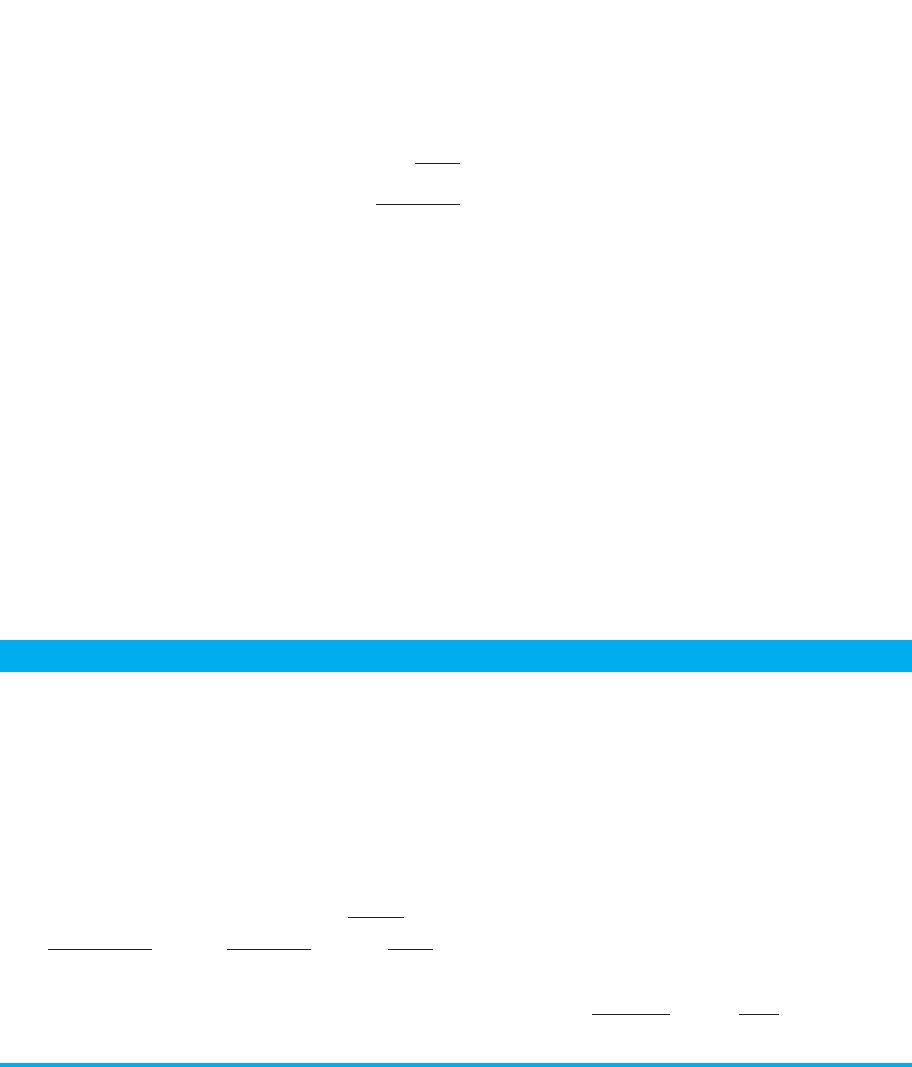
First, we assume homoscedasticity. Homoscedasticity occurs when the scores are
spread out to the same degree at every . The left-hand scatterplot in Figure 8.5 showsX
Y
rS
2
Y¿
S
Y¿
172 CHAPTER 8 / Linear Regression
homoscedastic data. Because the vertical spread of the scores is constant at every ,
the strength of the relationship is relatively constant at both low and at high , so
will accurately describe the relationship for all . Further, the vertical distance sepa-
rating a data point above or below the regression line on the scatterplot is a way to
visualize the difference between someone’s and the we predict. When the spread
is constant, the standard error of the estimate will accurately describe our average
error, regardless of whether predictions are based on low or high .
Conversely, the right-hand scatterplot in Figure 8.5 shows an example of het-
eroscedastic data. Heteroscedasticity occurs when the spread in is not equal
throughout the relationship. Now part of the relationship is very strong (forming a nar-
row ellipse) while part is much weaker (forming a fat ellipse). Therefore, will not
accurately describe the strength of the relationship for all . Likewise the will not
accurately describe our average error for predictions from both low and high
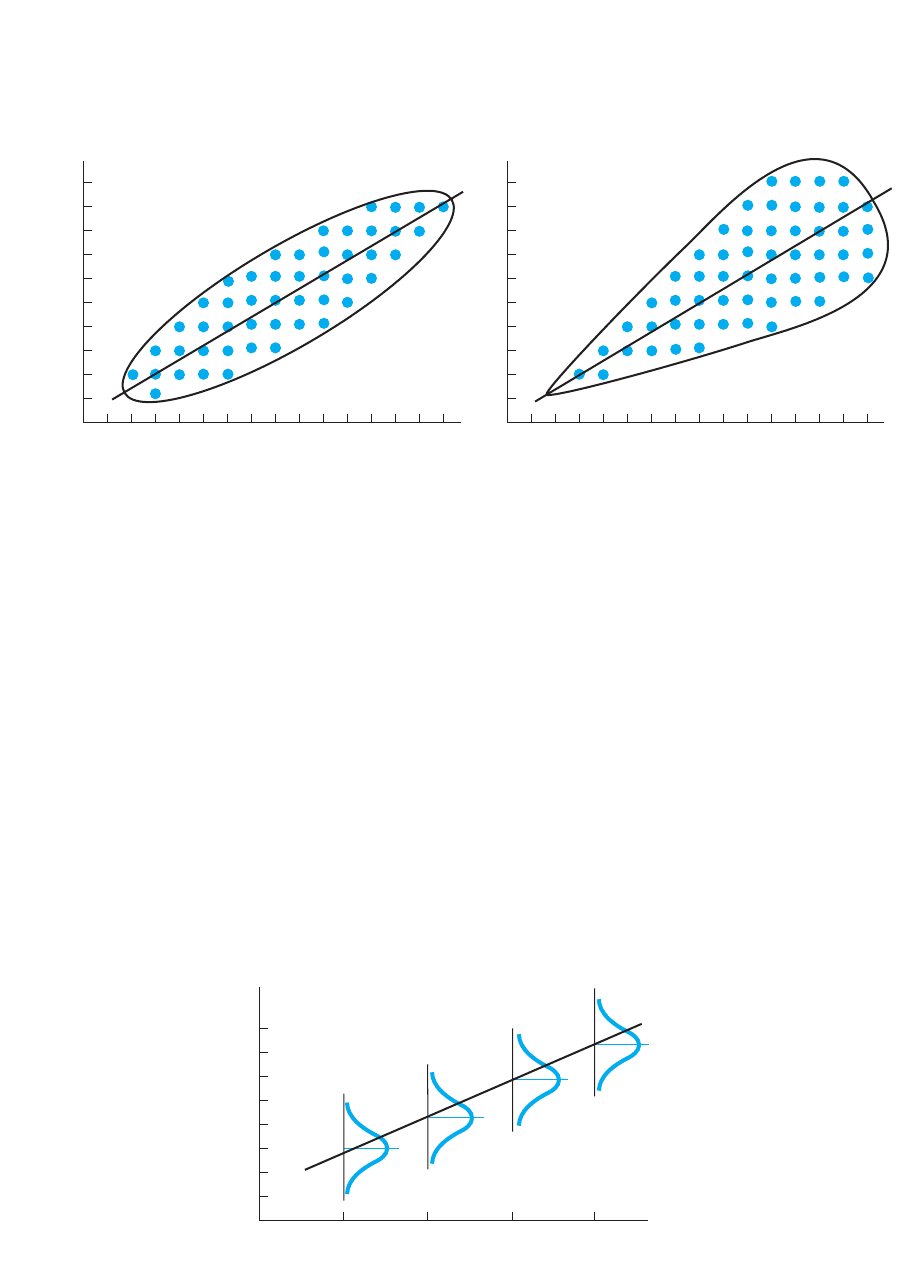
Second, we assume that the scores at each form an approximately normal distri-
bution. That is, if we constructed a frequency polygon of the scores at each , we
should have a normal distribution centered around Figure 8.6 illustrates this for the
widget study. Meeting this assumption is important because is like a standard devi-
ation. Recall that in a normal distribution approximately 68% of the scores fall between
standard deviation from the mean. Therefore, approximately 68% of all scoresY;1
S
Y
¿
Y¿.
XY
XY
Xs.
S
Y
¿
Xs
r
Y
Xs
1S
Y
¿
2
Y¿Y
Xs
rXsXs
XY
FIGURE 8.5
Illustrations of homoscedastic and heteroscedastic data
On the left, the have the same spread at each ; on the right they do not.XYs
X scores
Homoscedastic
Y scores
Heteroscedastic
X scores
Y scores
FIGURE 8.6
Scatterplot showing
normal distribution of
Y scores at each X
At each , there is a normal
distribution of scores
centered around Y¿.
Y
X
0
Widget test scores
8
7
6
5
4
3
2
1
Widgets per hour
1234
Describing Errors in Prediction 173
will be between from the regression line. In the widget study, is 1.42, so we
expect approximately 68% of the actual scores to be between from each value
of . Thus, we know the size of over two-thirds of our errors.
The Strength of a Relationship and Prediction Error
Finally, although the standard error of the estimate is the way to quantify our “average”
prediction error, be sure you understand why this error is communicated by the size
of A larger indicates a stronger relationship and the strength of a relationship
determines the amount of prediction error that occurs. This is because the strength of a
relationship is the amount of variability—spread—in the scores at each For exam-
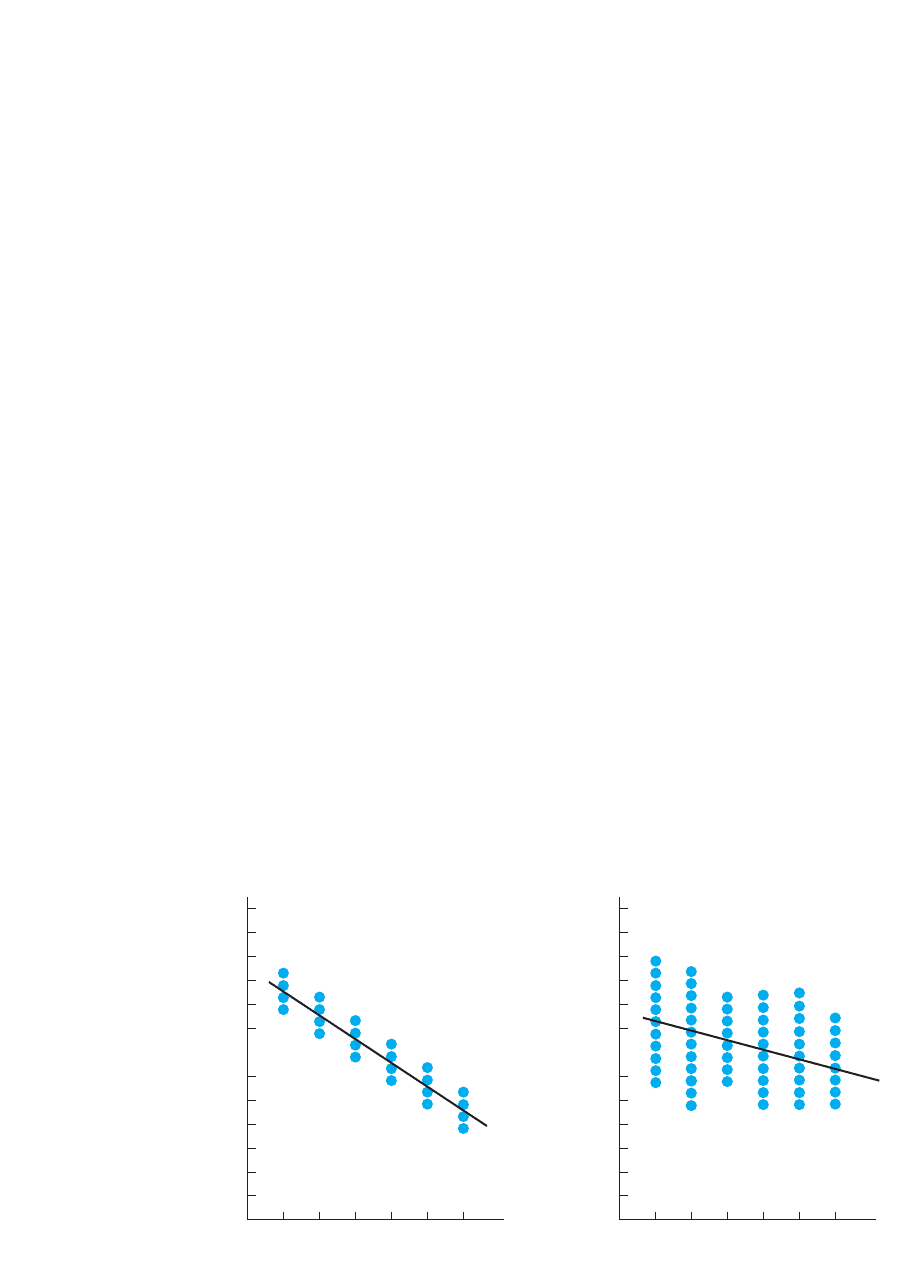
ple, the left-hand scatterplot in Figure 8.7 shows a relatively strong relationship, with
close to Thus, there is small vertical spread in the at each , so the data points
are close to the regression line. When the data points are close to the regression line it
means that participants’ actual scores are relatively close to their corresponding
scores. Therefore, we will find relatively small differences between the participants’
scores and the we predict for them, so we will have small error, and and
will be small.
Conversely, the right-hand scatterplot in Figure 8.7 shows a weaker relationship,
with closer to 0. This indicates that the scores are more spread out vertically around
the regression line. Therefore, more often, participants’ actual scores are farther from
their scores, so we will have greater error, and and will be larger.
Thus, the size of and is inversely related to the size of . This is why, as we
saw in the previous chapter, the size of allows us to describe the variable as a good
or poor “predictor” for predicting scores. When is large, our prediction error, as
measured by or is small, and so the variable is a good predictor. However,
when is smaller, our error and or will be larger, so the variable is a poorer
predictor.
REMEMBER As the strength of the relationship increases, the actual scores
are closer to their corresponding scores, producing less prediction error
and smaller values of and .S
2
Y
¿
S
Y
¿
Y¿
Y
XS
2
Y
¿
S
Y
¿
r
XS
2
Y
¿
S
Y
¿
rY
Xr
rS
2
Y
¿
S
Y
¿
S
2
Y
¿
S
Y
¿
Y¿
Y
Yr
S
2
Y
¿
S
Y¿
Y¿Y
Y¿
Y
XYs21.
r
X.Y
rr.
Y¿
;1.42Y
S
Y¿
;1S
Y¿
0 0
r closer to –1.0
r closer to 0.0
Y scores
Y scores
X scores
123456
X scores
123456
FIGURE 8.7
Scatterplots of strong
and week relationships
174 CHAPTER 8 / Linear Regression
In science we need to be more precise than using only terms such as good or poor
predictor. The next section shows how we can quantify how effective a predictor vari-
able is by computing the statistic with the strange name of the “proportion of variance
accounted for.”
COMPUTING THE PROPORTION OF VARIANCE ACCOUNTED FOR
The proportion of variance accounted for is the proportional improvement in the ac-
curacy of our predictions produced by using a relationship to predict scores, compared
to our accuracy when we do not use the relationship to predict scores. Understand that
the term proportion of variance accounted for is a shortened version of “the proportion
of variance in scores that is accounted for by the relationship with .” We “account”
for variance in to the extent that the relationship allows us to accurately predict when
different scores occur, resulting in less prediction error. Therefore, we will compute
our “average” prediction error when we use regression and the relationship with to
predict scores as we’ve discussed. We will compare this error to our “average” error
when we do not use regression and the relationship with to predict .
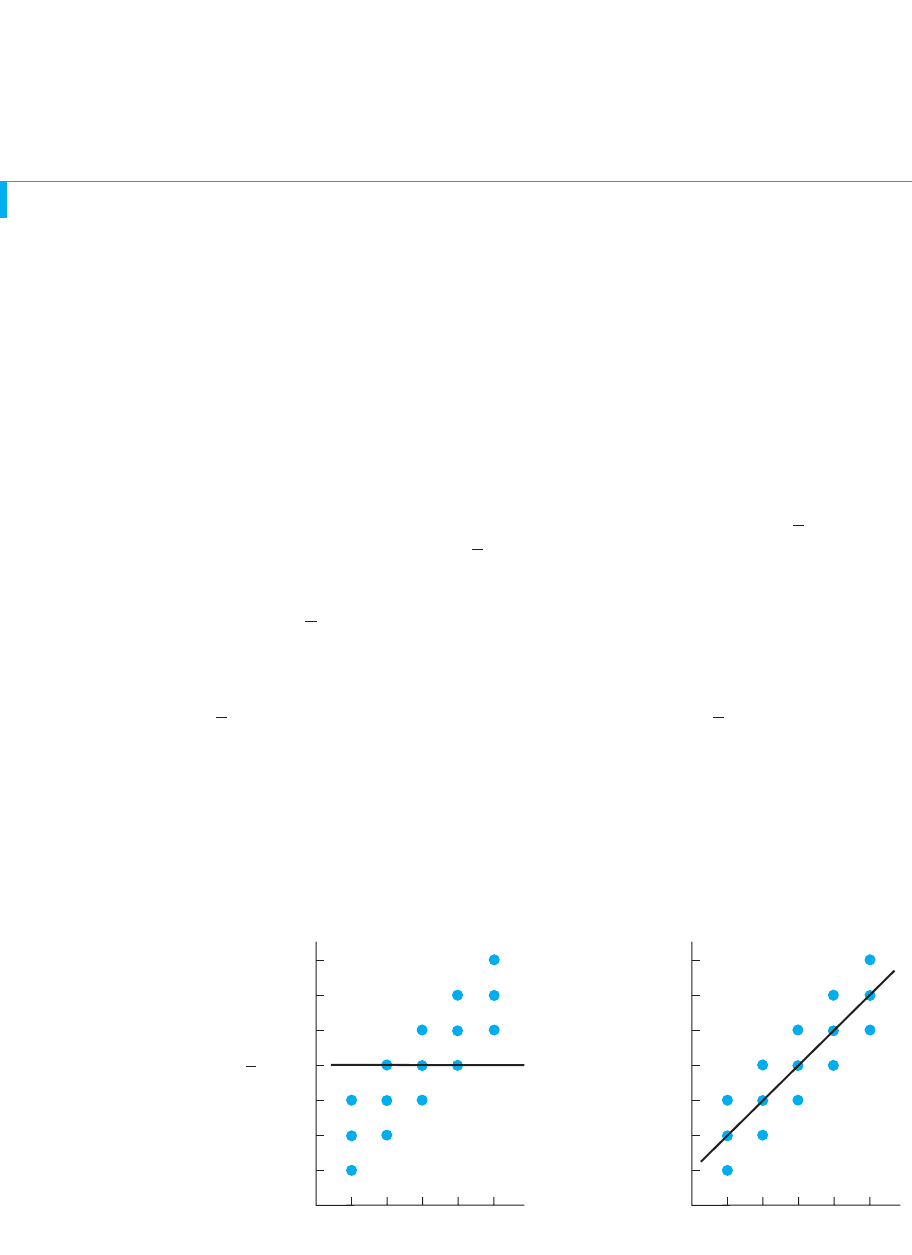
To understand this, consider the scatterplots in Figure 8.8. In the graph on the left,
we’ll ignore that there is relationship with for the moment. Without the relationship,
our fall-back position is to compute the overall mean of all scores and predict
it as everyone’s score. Here . On the graph, the mean is centered vertically
among all scores, so it is as if we have the horizontal line shown: At any , we travel
vertically to the line and then horizontally to the predicted score, which in every case
will be the of 4.
In Chapter 5 we saw that when we predict the mean score for everyone in a sample,
our error in predictions is measured by computing the sample variance. Our error in
one prediction is the difference between the actual score a participant obtains and the
that we predict was obtained. In symbols, this error is . Then the sample vari-
ance of the scores is somewhat like the average error in these predictions. On
the left-hand graph in Figure 8.8, each error is the vertical distance a data point is above
or below the horizontal line. The distance that all scores are spread out above and
below the horizontal line determines the size of Researchers can always measure a
sample of scores, compute the mean, and use it to predict scores. Therefore, the
is the largest error we are forced to accept. Because this variance is the worst that we
S
2
Y
S
2
Y
.
Y
1S
2
Y
2Y
Y 2 YY
Y
Y
Y
XY
Y 5 4Y
1Y2Y
X
YX
Y
X
Y
Y
XY
Y
Y
FIGURE 8.8
Scatterplots showing
predictions when using
and not using a
relationship.
On the left, when a relation-
ship is ignored, the mean of
is always predicted; on the
right, when using the
relationship, the scores
are predicted.
Y¿
Y
1 2543
Widget test scores
7
6
5
4
3
2
1
0
Y ⫽ 4
Widgets per hour
1 2543
Widget test scores
7
6
5
4
3
2
1
0
Widgets per hour

Computing the Proportion of Variance Accounted For 175
can do, anything that improves the accuracy of our predictions is measured relative to
this variance. This is the variance we “account for.”
REMEMBER When we do not use the relationship to predict scores, our error
is which is computed by finding each , the difference between the
score a participant actually obtained and the score we predict is obtained.
Now, let’s use the relationship with to predict scores, as in the right-hand scatter-
plot back in Figure 8.8. Here, we have the actual regression line and, for each , we
travel up to it and then over to the score. Now our error is the difference between the
actual scores that participants obtained and the that we predict they obtained. In
symbols, this is for each participant. Based on this, as we saw earlier in this
chapter, a way to measure our “average error” is the variance of scores around or
In the graph, our error will equal the distance the scores are vertically spread out
around each on the regression line.
REMEMBER When we do use the relationship to predict scores, our error is
, which is computed by finding each , the difference between the
score a participant actually obtained and the we predict is obtained.
Notice that our error when using the relationship is always less than the error when
we don’t use the relationship. When we do not use the relationship, we cannot predict
any of the differences among the scores, because we continuously predict the same
for everyone. Our error is always smaller when we use the relationship because then
we predict different scores for different participants: We can, at least, predict a lower
score for those who tend to have lower , a medium score for those scoring medium,
and so on. Therefore, to some extent, we’re closer to predicting when participants have
one score and when they have different scores. You can see this in Figure 8.8
because most data points tend to be vertically closer to the actual regression line (and
closer to their ) than to the horizontal line that represents predicting the of 4 each
time. Further, the stronger the relationship, the closer the scores will be to the regres-
sion line so the greater the advantage of using the relationship to predict scores. There-
fore, the stronger the relationship, the greater the proportion of variance accounted for.
We compute the proportion of variance accounted for by comparing the error
produced when using the relationship (the ) to the error produced when not using
the relationship (the ). First, we will do this using the definitional formula. The defi-
nitional formula for the proportion of variance accounted for is
The formula says to first make a ratio of . From the widget-making data back
in Table 8.3, we know that when we predict the overall mean of for participants, our
“average error” is the of 4.38. But, when we predict for participants, the “average
error” is the of 2.01. Forming this ratio gives
As shown, this is the ratio of our error when using the relationship to predict scores com-
pared to our error when not using the relationship. The resulting proportion indicates
S
2
Y
¿
S
2
Y
5
error when using the relationship
error when not using the relationship
5
2.01
4.38
5 .46
S
2
Y
¿
Y¿S
2
Y
Y
S
2
Y
¿
>S
2
Y
Proportion of variance accounted for 5 1 2 a
S
2
Y
¿
S
2
Y
b
S
2
Y
S
2
Y
¿
Y
YY¿
YY
YYs
Y
Y
Y
Y¿
YY 2 Y
¿
S
2
Y
¿
Y¿
YS
2
Y
¿
.
Y¿Y
Y 2 Y¿
Y¿Y
Y¿
X
X
Y
YY 2 YS
2
Y

176 CHAPTER 8 / Linear Regression
how much of the error that occurs when not using the relationship is still present when
we use the relationship. Here, of the error remains when we use the relationship.
But, if of the error remains, then using the relationship eliminates of the error
that occurs when not using the relationship. As in the formula, this proportion is found
by subtracting the ratio from 1. Altogether,
Thus, using this relationship eliminates .54, or 54%, of the error that we’d have when
not using the relationship, so we are 54% more accurate with it. Essentially, this tells
us that, in the graphs back in Figure 8.8, the data points are, on average, 54% closer to
the regression line (and ) than they are to the horizontal line (and ). Therefore, if we
know participants’ score and use this relationship to predict their scores, we are
“on average” 54% closer to their actual scores than if we don’t use this relationship.
In statistical terms, we describe this as the proportion of variance accounted for, and so
here we account for of the variance in widget-making (Y) scores.
REMEMBER The proportion of variance accounted for is the proportional
improvement in accuracy when using the relationship with to predict
scores, compared to our accuracy when using the to predict scores.
Using r to Compute the Proportion of Variance Accounted For
Using the above definitional formula is rather time consuming. However, we’ve seen
that the size of is related to the error in our predictions by the formula for the stan-
dard error of the estimate:
In fact, this formula contains all of the components of the previous definitional formula
for the proportion of variance accounted for. Rearranging them gives
On the right is the definitional formula for the proportion of variance accounted for, so
r
2
5 1 2
S
2
Y
¿
S
2
Y
S
2
Y
¿
5 S
2
Y
11 2 r
2
2
r
YY
YX
.54
Y
YX
YY¿
1 2
2.01
4.38
5 1 2 .46 5 .54
.54.46
.46
The computational formula for the proportion of variance
accounted for is
Proportion of variance accounted for 5 r
2
Not too tough! All you do is compute (which you would anyway) and then square it.
This gives you the proportion of variance in scores that is accounted for by the rela-
tionship with
In the widget study, the was . Therefore, the proportion of variance
accounted for is , which is again .
Thus, although describes the overall consistency with which the scores are paired
with the scores, is slightly different. It reflects how much the differences amongr
2
X
Yr
.541.7362
2
1.736r
X.
Y
r

Computing the Proportion of Variance Accounted For 177
the scores match with the different scores, showing how much closer we get to
knowing each different score when we know a participant’s . The can be as low
as 0 (when ), indicating that the relationship in no way helps us to predict
scores. Or, may be as high as 1 (when ), indicating that, whatever our errors
might be without the relationship, 100% of that error is eliminated when using the rela-
tionship, because then we predict scores with 100% accuracy.
REMEMBER Compute whenever you find a relationship. This indicates the
proportion of variance accounted for, which is the proportional improvement
in accuracy achieved by using the relationship to predict scores, compared
to not using the relationship.
Note: Sometimes is called the coefficient of determination. The proportion of
variance not accounted for is called the coefficient of alienation.
r
2
Y
r
2
Y
r 5 ;1r
2
Yr 5 0
r
2
XY
XY
The computational formula for the proportion of variance
not accounted for is
Proportion of variance not accounted for 5 1 2 r
2
This is the proportion of the error we have without using the relationship that still
remains when we use the relationship. In the widget study, , so we still cannot
account for of the variance in the scores.
Notice that describes the proportion of variance accounted for by the sample rela-
tionship. If the passes the inferential statistical test, then is a rough estimate of the
proportion of variance accounted for by the relationship in the population. Thus, we’d
expect to be roughly 54% more accurate if we use the relationship and widget test
scores to predict any other, unknown widget-making scores in the population.
Applying the Proportion of Variance Accounted For
The reason we make such a big deal out of the proportion of variance accounted for is
that it is the statistical measure of how “important” a particular relationship is. Remem-
ber that scores reflect behavior, so when we accurately predict different score, we are
actually predicting different behaviors. The goal of behavioral research is to understand
and predict differences in behavior. Therefore, the greater the proportion of variance
accounted for, the more that the relationship enables us to do this, so the more scientif-
ically important and informative the relationship is.
Thus, we can now complete our evaluation of the widget-making relationship,
where was and was 1.42. With equal to , we are , or 54%, better off
using this relationship than if we did not. And, our average prediction error of 1.42 is
54% less than we’d have without using this relationship. This would be deemed an
especially useful relationship in real research because, as we discussed in Chapter 7,
we usually find between to . Squaring these translates into accounting for
between only and of the variance. Therefore, is very large, so this is an
important relationship, and the widget test should prove valuable for identifying
successful widget makers.
.54.25.09
;.50;.30rs
.54.54r
2
S
Y¿
1 .74r
Y
r
2
r
r
2
Y1 2 .54 5 .46
r
2
5 .54