Heiman G. Basic Statistics for the Behavioral Sciences
Подождите немного. Документ загружается.


98 CHAPTER 5 / Measures of Variability: Range, Variance, and Standard Deviation
In the final analysis, you can think of as simply a correction factor. Because
is a smaller number than , dividing by produces a slightly larger answer.
Over the long run, this larger answer will prove to be a more accurate estimate of the
population variability.
Computing the Estimated Population Variance
and Standard Deviation
The only difference between the computational formula for the estimated population
variance and the previous computational formula for the sample variance is that here
the final division is by .N 2 1
N – 1NN – 1
N – 1
The computational formula for the estimated population
variance is
S
2
X
5
ΣX
2
–
1ΣX2
2
N
N – 1
Notice that in the numerator we still divide by .
In previous examples, our age scores of 3, 5, 2, 4, 6, 7, and 8 produced ,
and . The was 7 so equals 6. Putting these quantities into the above
formula gives
Work through this formula the same way you did for the sample variance: is
1225, and 1225 divided by 7 equals 175, so
Now 203 minus 175 equals 28, so
and the final answer is
This answer is slightly larger than the sample variance for these age scores, which
was . Although 4 accurately describes the sample, we estimate the variance of
the population is 4.67. In other words, if we could compute the true population vari-
ance, we would expect to be 4.67.
A standard deviation is always the square root of the corresponding variance. There-
fore, the formula for the estimated population standard deviation involves merely
adding the square root sign to the previous formula for the variance.
σ
2
X
S
2
X
5 4
S
2
X
5 4.67
s
2
X
5
28
6
s
2
X
5
203 – 175
6
35
2
s
2
X
5
ΣX
2
–
1ΣX2
2
N
N – 1
5
203 –
1352
2
7
6
N – 1NΣX 5 35
ΣX
2
5 203
N

The Population Variance and the Population Standard Deviation 99
The computational formula for the estimated population
standard deviation is
s
X
5
R
©X
2
–
1©X2
2
N
N – 1
For our age scores, the estimated population variance was . Then, is s
X
s
2
X
5 4.67
which is 2.16. Thus, if we could compute the standard deviation using the en-
tire population of scores, we would expect to be 2.16.
Interpreting the Estimated Population Variance
and Standard Deviation
Interpret the estimated population variance and standard deviation in the same way as
and , except that now they describe how much we expect the scores to be spread
out in the population, how consistent or inconsistent we expect the scores to be, and
how accurately we expect the population to be summarized by .
Notice that, assuming a sample is representative, we have pretty much reached our
ultimate goal of describing the population of scores. If we can assume that the distribu-
tion is normal, we have described its overall shape. The sample mean provides a
good estimate of the population mean . So, for example, based on a statistics class
with a mean of 80, we’d infer that the population would score at a µ of 80. The size of
(or ) estimates how spread out the population is, so if turned out to be 6, we’d
expect that the “average amount” the individual scores deviate from the of 80 is
about 6. Further, we’d expect about 34% of the scores to fall between 74 and 80 (be-
tween and the score at ) and about 34% of the scores to fall between 80 and 86
(between and the score at 1 ) for a total of 68% of the scores between 74 and 86.
With this picture in mind, and because scores reflect behaviors, we have a good idea of
how most individuals in the population behave in this situation (which is why we con-
duct research the first place).
s
X
1
21s
X
s
X
s
2
X
s
X
12
1X2
S
X
S
2
X
σ
X
24.67
A QUICK REVIEW
■
The symbols and refer to the estimated popula-
tion standard deviation and variance, respectively.
When computing them, the final division involves
.
MORE EXAMPLES
For the scores 5, 6, 7, 8, 9, to estimate the population
variability:
; . , so .N – 1 5 4N 5 5©X
2
5 255©X 5 35
N – 1
s
2
X
s
X
continued
s
2
X
5
10
4
5 2.50
s
2
X
5
255 –
112252
5
4
5
255 – 245
4
s
2
X
5
©X
2
–
1©X2
2
N
N – 1
5
255 –
1352
2
5
4

100 CHAPTER 5 / Measures of Variability: Range, Variance, and Standard Deviation
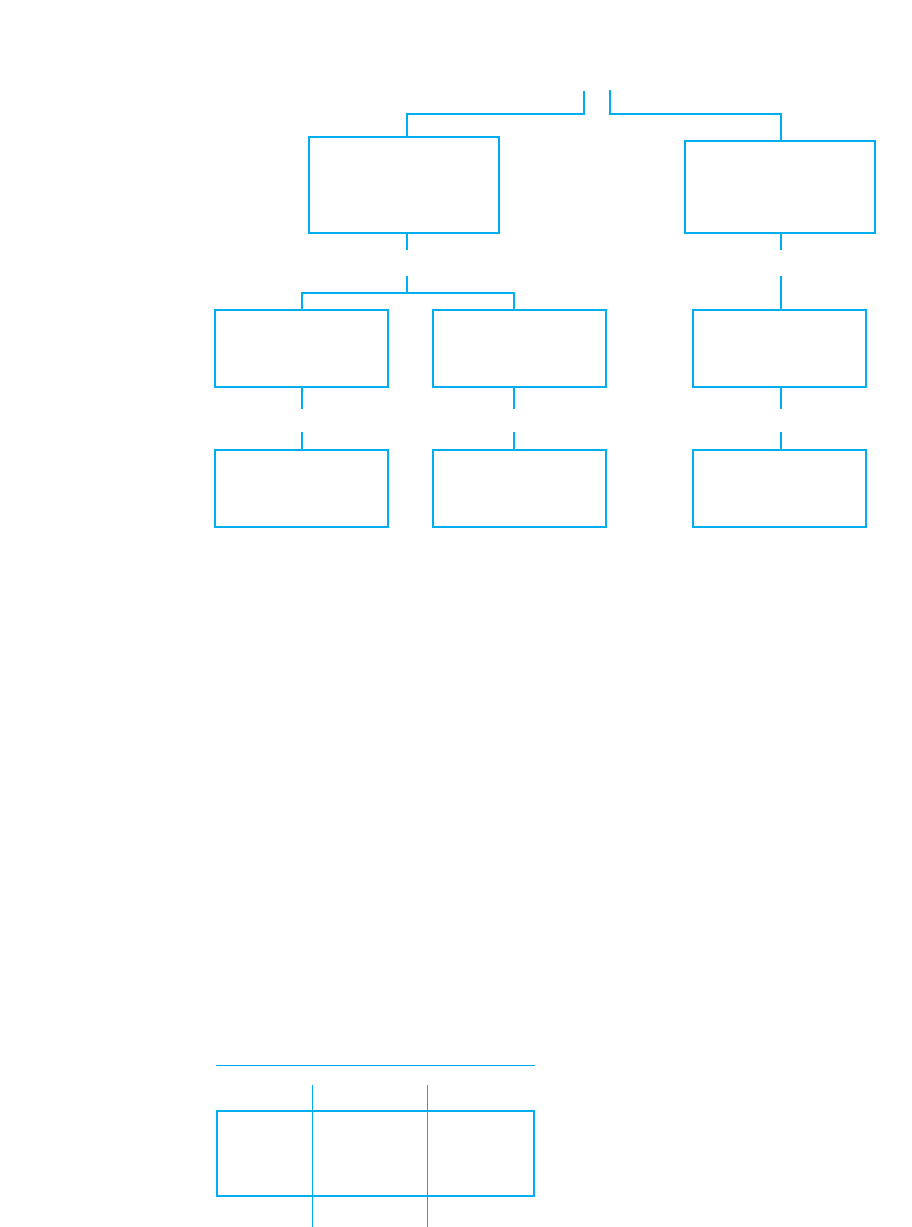
A SUMMARY OF THE VARIANCE AND STANDARD DEVIATION
To keep track of all of the symbols, names, and formulas for the different statistics
you’ve seen, remember that variability refers to the differences between scores and that
the variance and standard deviation are two methods for describing variability. In
every case, we are finding the difference between each score and the mean and then cal-
culating an answer that is somewhat like the “average deviation.”
Organize your thinking about measures of variability using Figure 5.4. Any standard
deviation is merely the square root of the corresponding variance. We compute the de-
scriptive versions when the scores are available: When describing the sample, we cal-
culate and . When describing the population we calculate and . When the
population of scores is unavailable, we infer the variability of the population based on
a sample by computing the unbiased estimators, and . These “inferential” formu-
las require a final division by instead of by .
With these basics in hand, you are now ready to apply the variance and standard de-
viation to research.
APPLYING THE VARIANCE AND STANDARD DEVIATION TO RESEARCH
As we’ve seen, we usually summarize data by computing the mean to describe the typ-
ical score and the standard deviation to describe how consistently close the other scores
were to it. Thus, the mean from a study might describe the number of times that partic-
ipants exhibited a particular behavior, but a small standard deviation indicates that they
consistently did so. Or, in a survey, the mean might describe the typical opinion held
by participants, but a large standard deviation indicates substantial disagreement
among them.
We also compute the mean and standard deviation in each condition of an experi-
ment. For example, in Chapter 4 we tested the influence of recalling a 5- 10- or
15- item list. Say that we obtained the recall scores in Table 5.4. In published research
you would not see the individual scores, so you would know only that, for example, a
NN 2 1
s
X
s
2
X
σ
X
σ
2
X
S
X
S
2
X
The standard deviation is the square root of the vari-
ance, so
For Practice
1. The symbols for the biased population estimators
are ____ and ____.
2. The symbols for the unbiased population
estimators are ____ and ____.
3. When do you compute the unbiased estimators?
s
X
5
R
255 –
1352
2
5
4
5 22.50 5 1.58
4. When do you compute the biased estimators?
5. Compute the estimated population variance and
standard deviation for the scores 1, 2, 2, 3, 4, 4,
and 5.
Answers
1. ;
2. ;
3. To estimate the population standard deviation and
variance
4. To describe the sample standard deviation and variance
5. ; S
X
5 22.00 5 1.41s
2
X
5
75 –
1212
2
7
6
5 2.00
s
X
s
2
X
S
X
S
2
X
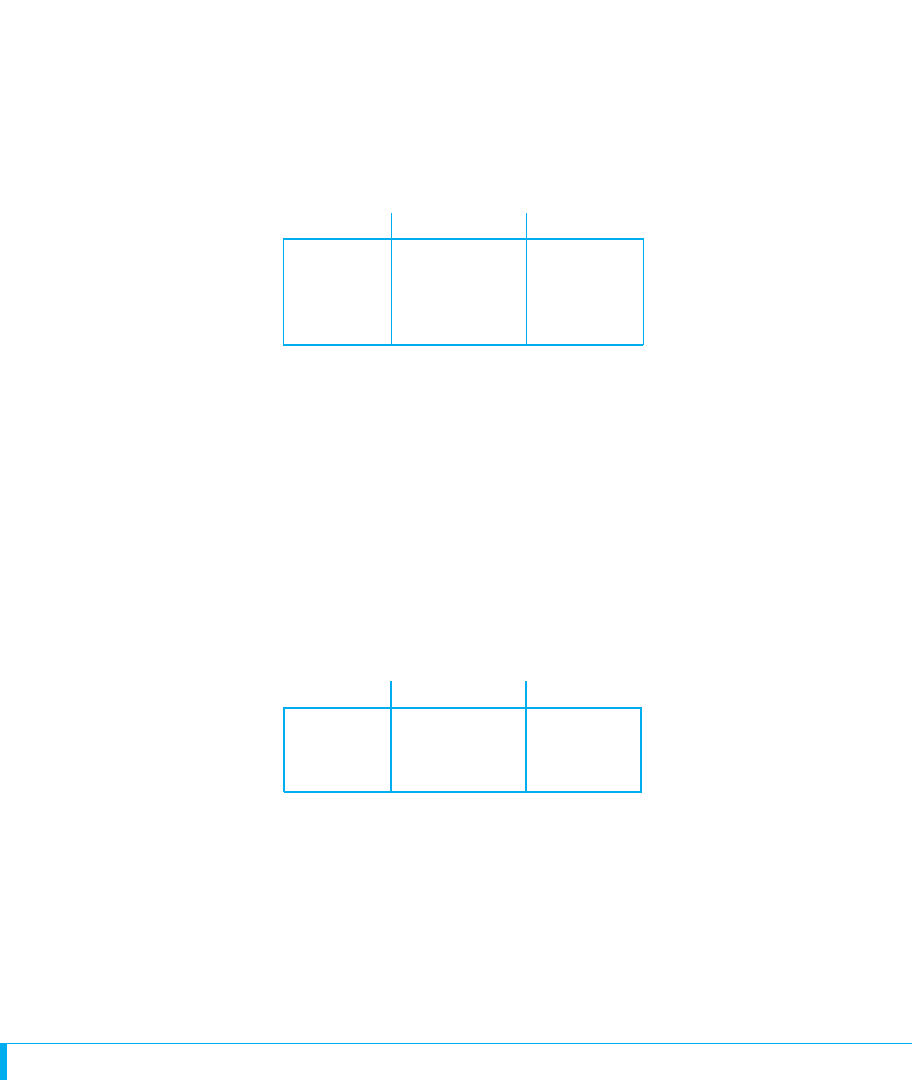
5-item list produced scores around the mean of 3. By also considering the variability,
you would also know that these scores differed from this mean by an “average” of only
.82. In the 15-item condition, however, scores were spread out by almost twice as
much, differing from the mean by 1.63. Therefore, we know that scores were closer to
the mean in the 5-item condition, so 3 is a more accurate summary here than 9 is for
the 15-item condition. Also, because these recall scores reflect a behavior, we know
that memory behavior is more consistent when people recall a 5-item list, with rela-
tively large differences in their behavior when recalling a 15-item list.
Variability and the Strength of a Relationship
Measures of variability also tell us about the strength of the overall relationship that an
experiment demonstrates. Recall from Chapter 2 that a stronger relationship is more
consistent. In an experiment, this translates into everyone in a condition having the
same score or close to the same score. In other words, using the terminology of this
chapter we would say that a strong relationship occurs when there is little variability
among the scores within each condition. For example, all three standard deviations in
Table 5.4 are relatively small. This indicates that, as shown, the raw scores within each
condition are relatively close to each other. Therefore, the overall relationship between
list length and recall scores is rather strong.
Conversely, larger standard deviations per
condition (say in the neighborhood of 3 or
4) would indicate that a particular list length
produced a wide variety of recall scores that
are much more spread out around their
mean. Therefore, we would describe this as
a less consistent, weaker relationship.
Applying the Variance and Standard Deviation to Research 101
FIGURE 5.4
Organizational chart
of descriptive and
inferential measures
of variability
To estimate
population variance
To describe
population variance
Describing variability
(differences between scores)
In formulas final division uses N
In formulas final division uses N – 1
Taking square root gives Taking square root gives Taking square root gives
Estimated population
standard deviation
Population
standard deviation
Sample
standard deviation
S
X
X
s
X
Descriptive measures
are used to describe a
known sample
Inferential measures
are used to estimate
the population based
To describe
sample variance
5-Item List 10-Item List 15-Item List
35 9
4511
28 7
X
苶
3 X
苶
6 X
苶
9
S
X
.82 S
X
1.41 S
X
1.63
TABLE 5.4
Mean and Standard
Deviation in Each
Condition of Recalling
5-, 10-, or 15-Item Lists
σ

102 CHAPTER 5 / Measures of Variability: Range, Variance, and Standard Deviation
Later we’ll see more objective techniques for describing the strength of a relation-
ship in experiments (and in correlational studies). For now:
REMEMBER The strength of a relationship is determined by the variability of
the dependent scores (the scores) that are paired with each condition (each
score).
A third use of variability is that it communicates the amount of error we have when
predicting participants’ scores.
Variability and Errors in Prediction
You know that the mean is the best score to predict as any participant’s score, so, for
example, we’d predict a recall score of 3 for anyone in the 5-item condition. How-
ever, sometimes our predictions will be wrong. To determine our errors when predict-
ing unknown scores, we determine how well we can predict the known scores in the
data. As in Chapter 4, the amount of error in one prediction is the difference between
what someone actually gets and what we predict he or she gets (the ). This dif-
ference is , a deviation. Because some predictions will contain more error than
others, we want to find the average error, so we need the “average deviation.” As
you’ve seen, the closest we get to the average deviation is to compute the variance
and standard deviation.
Thus, we have a novel way to view and : Because they measure the difference
between each score and the mean, they also measure the “average” error in our pre-
dictions when we predict the mean for all participants. For example, back in Table 5.4,
the mean in the 15-item condition is 9 and the standard deviation is 1.63. This indicates
that the scores differ from the mean by an “average” of 1.63, so if we predict that all
participants in this condition score 9, on average we’ll be “off” by about 1.63. If was
larger, at say 4, then we’d know that participants’ scores are farther from the mean, so
we’d have greater error when predicting that they scored at 9.
Similarly, the sample variance is somewhat like the average deviation, although less
directly. This is too bad because, technically, variance is the proper way to measure
the errors in our prediction. In fact, variance is sometimes called error or error vari-
ance. Thus, when , the variance is , which is 2.66. This indicates that
when we predict that participants in the 15-item condition scored 9, our “average
error”—as measured by the variance—is about 2.66. Although this number may seem
strange, simply remember that the larger the variance, the larger the error, and the
smaller the variance, the smaller the error.
REMEMBER When we predict that participants obtained the mean score, our
“average error” is measured by the variance.
The same logic applies to the population. If the population is known, then we’ll
predict anyone’s score is , and our errors in prediction equal . Or, if we must es-
timate the population using the sample, then we’ll use the sample mean to estimate
the we predict for everyone, and we estimate that our errors in prediction will
equal .
REMEMBER Summarizing data using the standard deviation and variance
indicates the consistency of the scores and behavior, the strength of the rela-
tionship, and the “average error” when using the mean to predict scores.
s
2
X
σ
2
X
1.63
2
S
X
5 1.63
S
X
S
2
X
S
X
X – X
X1X2
X
Y

Accounting for Variance
Finally, we have one other use of the term variance. In research reports you will en-
counter such phrases as accounting for variance or the variance accounted for. They
are used when researchers describe the usefulness of a relationship when we use it to
predict scores. Because a relationship shows the particular scores that are naturally
paired with an , if we know participants’ , we know the around which they tend to
score. Thus, to some extent we can predict when individuals have one score and when
other individuals have a different score. One way to measure the differences in scores
is to compute the variance. If we compute the variance of all scores in a study, this
reflects all of the differences in scores that we want to predict, so this is the variance
that we want to account for.
How well a relationship helps us to predict the different Y scores is the extent
that it “explains” or “accounts” for the variance in Y scores.
For example, back in Table 5.4 we have a total of nine scores, so their differences
produce the variance in recall scores that we want to account for. However, the rela-
tionship with list length tends to group similar scores together. Therefore, we know
when participants score around 3 (when they recall a 5-item list) and when they pro-
duce a different score of, say, 9 (when they recall a 15-item list). By considering list
length, our predictions seem very close to each person’s actual score, so we seem to be
close to predicting many of the differences among the nine scores. Therefore, in our
lingo, we would say that the variable of list length seems to “account for” a sizable
portion of the variance in recall scores. However, we still have some error in our pre-
dictions because not everyone scored exactly the score we’d predict. Therefore, some
differences among scores are not predicted, so we say that some of the variance in re-
call scores is not accounted for.
On the other hand, consider when a relationship is weaker, such as the relationship
between someone’s gender and his or her height. We would predict the average man’s
height for any man and the average woman’s height for any woman. However, there is
a wide range of women’s and men’s heights, so our predictions each time may not be
very close to someone’s actual height. Therefore, this relationship is not all that much
help in predicting someone’s exact height, and so it would be described as accounting
for little of the variance in height.
As these examples illustrate, more consistent relationships account for a greater
amount of the variance. Chapters 8 and 12 discuss ways to precisely measure the
amount of variance accounted for. Until then,
REMEMBER How well a relationship helps us to predict the different
scores in the data is the extent that it accounts for the variance in scores.
STATISTICS IN PUBLISHED RESEARCH: REPORTING VARIABILITY
The standard deviation is most often reported in published research because it most di-
rectly indicates how consistently close the scores are to the mean and because it allows
us to easily determine the middle 68% of the distribution. However, as if you haven’t
seen enough symbols already, journals that follow APA guidelines do not use the statis-
tical symbols we have used for the sample standard deviation. Instead, the symbol for
the sample standard deviation is SD.
Y
Y
Y
Y
Y
YXX
Y
Statistics in Published Research: Reporting Variability 103

104 CHAPTER 5 / Measures of Variability: Range, Variance, and Standard Deviation
We do not, however, use symbols in sentences, so we would not say “The large SD
was . . . .” Instead, symbols usually appear in parentheses. For example, recall that the
symbol for the sample mean is , so in a report of our list-length study, you might see
this: “The fewest errors were produced when recalling 5-item lists (M 3.00, SD
.83) with the 10-item condition producing more . . . ”
M
At this point the three steps in analyzing any set of data should be like a reflex for you.
(1) Consider the scale of measurement used and the shape of the distribution formed by
the scores. (2) Describe around where most participants scored, usually by computing
the for each group or for each condition of an experiment. (3) Describe the variabil-
ity—how spread out the scores are—around each mean, usually by computing the sam-
ple standard deviation. With this information, you are largely finished with descriptive
statistics because you know the important characteristics of the sample data and you’ll
be ready to draw inferences about the corresponding population.
Using the SPSS Appendix Section B.3 in Appendix B shows how to compute the
mean, median, and mode, as well as the variance, standard deviation, and range for a
sample of scores. Later we will compute the mean and standard deviation in each con-
dition of an experiment as part of performing inferential statistics.
CHAPTER SUMMARY
1. Measures of variability describe how much the scores differ from each other, or
how much the distribution is spread out.
2. The range is the difference between the highest and the lowest score.
3. The variance is used with the mean to describe a normal distribution of
interval or ratio scores. It is the average of the squared deviations of scores
around the mean.
4. The standard deviation is also used with the mean to describe a normal distribution
of interval/ratio scores. It is the square root of the variance. It can be thought of as
somewhat like the “average” amount that scores deviate from the mean.
5. Transforming scores by adding or subtracting a constant does not alter the
standard deviation. Transforming scores by multiplying or dividing by a constant
alters the standard deviation by the same amount as if we had multiplied or
divided the original standard deviation by the constant.
6. There are three versions of the formula for variance: describes how far the sam-
ple scores are spread out around , describes how far the population of scoresσ
X
2
X
S
X
2
X
PUTTING IT
ALL TOGETHER
is spread out around , and is computed using sample data but is the
inferential, unbiased estimate of how far the scores in the population are spread
out around .
7. There are three versions of the formula for the standard deviation: describes
how far the sample scores are spread out around , describes how far the popu-
lation is spread out around , and is computed using sample data but is the in-
ferential, unbiased estimate of how far the scores in the population are spread out
around .
S
X
σ
X
X
S
X
s
2
X

8. The formulas for the descriptive measures of variability (for and ) use N as
the final denominator. The inferential formulas (for and ) use . The
quantity is the degrees of freedom in the sample.
9. On a normal distribution, approximately 34% of the scores are between the mean
and the score that is a distance of one standard deviation from the mean. There-
fore, approximately 68% of the distribution lies between the two scores that are
plus and minus one standard deviation from the mean.
10. We summarize an experiment usually by computing the mean and standard devia-
tion in each condition. When the standard deviations are relatively small, the
scores in the conditions are similar, and so a more consistent—stronger—relation-
ship is present.
11. When we predict that participants obtained the mean score, our error in predic-
tions is determined by the variability in the scores. In this context the variance and
standard deviation measure the differences between the participants’ actual scores
and the score we predict for them , so we are computing an answer that is
somewhat like the “average” error in our predictions.
12. The amount that a relationship with helps us to predict the different scores in
the data is the extent that accounts for the variance in scores.
KEY TERMS
YX
YX
1X21X2
N 2 1
N 2 1s
X
s
2
X
S
X
S
2
X
Review Questions 105
biased estimator 96
degrees of freedom 97
estimated population standard
deviation 97
estimated population variance 97
measures of variability 85
population standard deviation 96
©X
2
1©X2
2
S
2
X
S
X
σ
2
X
σ
X
s
2
X
s
X
df
population variance 96
variance accounted for 103
range 87
sample standard deviation 89
sample variance 88
sum of the squared 84
squared sum of 84
unbiased estimator 97
X
Xs
REVIEW QUESTIONS
(Answers for odd-numbered problems are in Appendix D.)
1. In any research, why is describing the variability important?
2. What do measures of variability communicate about (a) the size of differences
among the scores in a distribution? (b) how consistently the participants
behaved? (c) the size of our “average error” when we predict that participants
obtained the mean?
3. (a) What is the range? (b) Why is it not the most accurate measure of variability?
(c) When is it used as the sole measure of variability?
4. (a) What do both the variance and the standard deviation tell you about a
distribution? (b) Which measure will you usually want to compute? Why?
5. (a) What is the mathematical definition of the variance? (b) Mathematically, how
is a sample’s variance related to its standard deviation and vice versa?

106 CHAPTER 5 / Measures of Variability: Range, Variance, and Standard Deviation
6. (a) What do ,,and have in common in terms of what they communicate?
(b) How do they differ in terms of their use?
7. Why are your estimates of the population variance and standard deviation always
larger than the corresponding values that describe a sample from that population?
8. In an experiment, how does the size of S
X
in each condition suggest the strength
of the relationship?
9. (a) How do we determine the scores that mark the middle 68% of a sample?
(b) How do we determine the scores that mark the middle 68% of a known popu-
lation? (c) How do we estimate the scores that mark the middle 68% of an
unknown population?
10. (a) What is the phrase used to convey that by knowing participants’ score in a
relationship it helps us to more accurately predict their ? (b) How do we describe
it when our predictions are closer to participants’ actual scores?
APPLICATION QUESTIONS
11. In a condition of an experiment, a researcher obtains the following creativity scores:
3210748664
In terms of creativity, interpret the variability of these data using the following:
(a) the range, (b) the variance, and (c) the standard deviation.
12. If you could test the entire population in question 11, what would you expect each
of the following to be? (a) The typical, most common creativity score; (b) the
variance; (c) the standard deviation; (d) the two scores between which about 68%
of all creativity scores occur in this situation.
13. In Question 11: (a) What are the scores at and from the mean? (b) If
is 1000, how many people do you expect will score between 1.59 and 6.61?
(c) How many people do you expect will score below 1.59?
14. As part of studying the relationship between mental and physical health, you
obtain the following heart rates:
73 72 67 74 78 84 79 71 76 76
79 81 75 80 78 76 78
In terms of differences in heart rates, interpret these data using the following:
(a) the range, (b) the variance, and (c) the standard deviation.
15. If you could test the population in question 14, what would you expect each of the
following to be? (a) The shape of the distribution; (b) the typical, most common
rate; (c) the variance; (d) the standard deviation; (e) the two scores between which
about 68% of all heart rates fall.
16. Foofy has a normal distribution of scores ranging from 2 to 9. (a) She computed
the variance to be .06. What should you conclude about this answer, and why?
(b) She recomputes the standard deviation to be 18. What should you conclude,
and why? (c) She recomputes the variance to be 1.36. What should you conclude,
and why? (d) If she computed that 0 and , what would you conclude?
17. From his statistics grades, Guchi has a of 60 and . Pluto has a of 60
and . (a) Who is the more inconsistent student, and why? (b) Who is more
accurately described as a 60 student, and why? (c) For which student can you
more accurately predict the next test score, and why? (d) Who is more likely to do
either extremely well or extremely poorly on the next exam?
S
X
5 5
XS
X
5 20X
S
2
X
5 2S
X
N
11S
X
21S
X
Y
X
σ
X
s
X
S
X
18. Indicate whether by knowing someone’s score on the first variable, the relationship
accounts for a large or small amount of the variance in the second variable. (a) For
children ages 1 to 6, using age to predict height ; (b) for ages 30 to 40, using age to
predict the driving ability of adults; (c) using a students’ hours of studying to predict
final exam grades; (d) using students’ hair color to predict final exam grades.
19. Consider the results of this experiment:
Condition A Condition B Condition C
12 33 47
11 33 48
11 34 49
10 31 48
(a) What “measures” should you compute to summarize the experiment?
(b) These are ratio scores. Compute the appropriate descriptive statistics and
summarize the relationship in the sample data. (c) How consistent does it appear
the participants were in each condition? (d) Does this relationship account for
much of the variance in the scores?
20. Say that you conducted the experiment in question 19 on the entire population.
(a) Summarize the relationship that you’d expect to observe. (b) How consistently
do you expect participants to behave in each condition?
21. In two studies, the mean is 40 but in Study , and in Study B, .
(a) What is the difference in the appearance of the distributions from these
studies? (b) Where do you expect the majority of scores to fall in each study?
22. Consider these ratio scores from an experiment:
Condition 1 Condition 2 Condition 3
18 8 3
13 11 9
9 6 5
(a) What should you do to summarize the experiment? (b) Summarize the rela-
tionship in the sample data. (c) How consistent were participants in each
condition?
23. Say that you conducted the experiment in question 22 on the entire population.
(a) Summarize the relationship that you’d expect to observe. (b) How consis-
tently do you expect participants to behave in each condition?
24. Comparing the results in questions 19 and 22, which experiment produced the
stronger relationship? How do you know?
INTEGRATION QUESTIONS
25. What are the three major pieces of information we need in order to summarize the
scores in any data? (Ch. 3, 4, 5)
26. What is the difference between what a measure of central tendency tells us and
what a measure of variability tells us? (Chs. 4, 5)
S
X
5 10A, S
X
5 5
Integration Questions 107