Heiman G. Basic Statistics for the Behavioral Sciences
Подождите немного. Документ загружается.

68 CHAPTER 4 / Measures of Central Tendency: The Mean, Median, and Mode
skewed distribution, and the mean gets pulled away from where most of your grades are,
toward that low grade. What hurts is then telling someone your average because it’s mis-
leading: It sounds as if all of your grades are relatively low, even though you have only
that one zinger.
The mean is always pulled toward the tail of any skewed distribution because it must
balance the entire distribution. You can see this starting with the symmetrical distribu-
tion containing the scores 1, 2, 2, 2, and 3. The mean is 2, and this accurately describes
most scores. However, adding the score of 20 skews the sample. Now the mean is
pulled up to 5. But! Most of these scores are not at or near 5. As this illustrates,
although the mean is always at the mathematical center, in a skewed distribution, that
center is not where most of the scores are located.
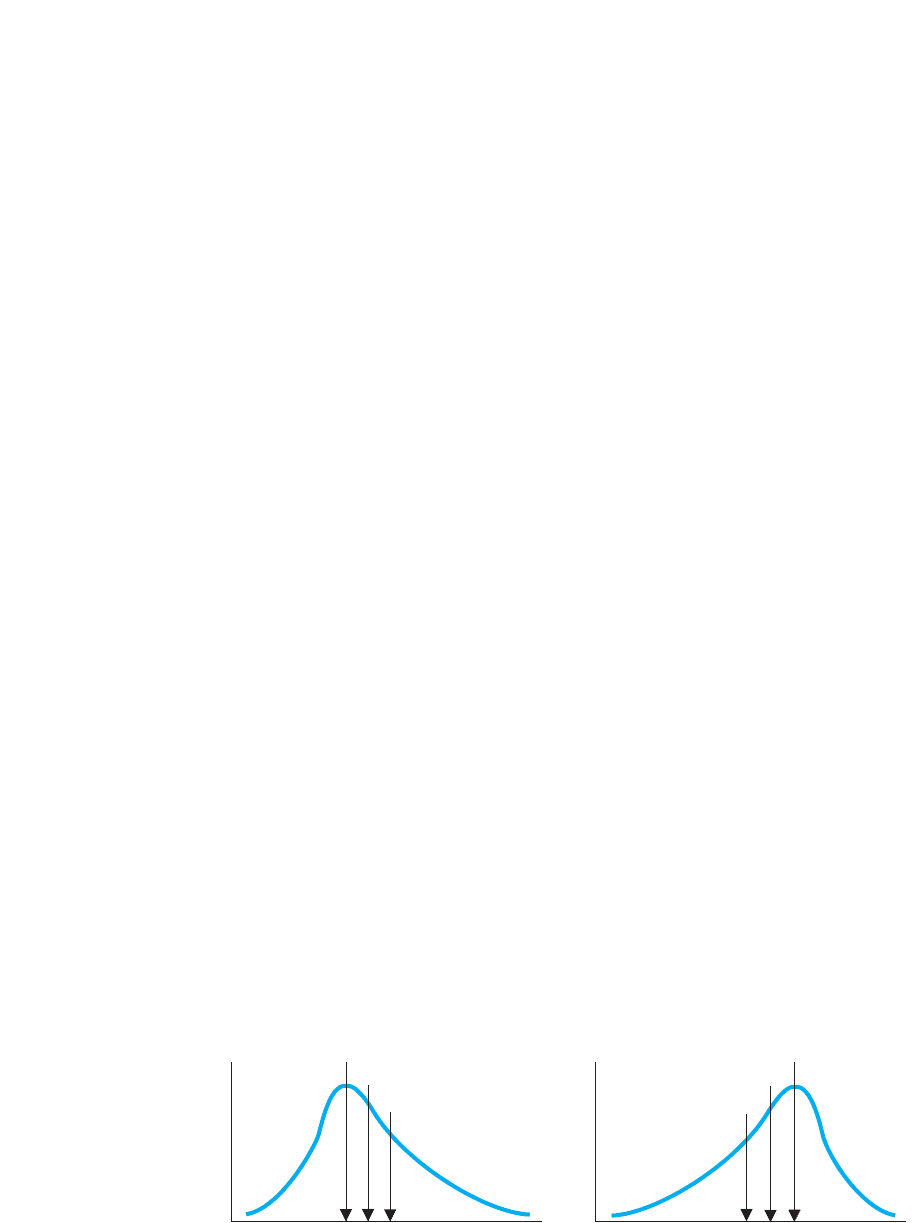
The solution is to use the median to summarize a skewed distribution. Figure 4.6
shows the relative positions of the mean, median, and mode in skewed distributions. In
both graphs, the mean is pulled toward the extreme tail and is not where most scores
are located. The mode is toward the side away from the extreme tail and so the distri-
bution is not centered here either. Thus, of the three measures, the median most accu-
rately reflects the central tendency—the overall address—of a skewed distribution.
REMEMBER Use the mean to summarize normal distributions of interval or
ratio scores; use the median to summarize skewed distributions.
It is for the above reasons that the government uses the median to summarize such
skewed distributions as yearly income or the price of houses. For example, recent U.S.
census data indicated that the median income is slightly above $50,000. But a relatively
small number of corporate executives, movie stars, professional athletes, and the like
make millions! If we include these salaries and compute the average income, it is about
$68,000. However, this is misleading because most people do not earn at or near this
higher figure. Instead, the median is a better summary of this distribution.
Believe it or not, we’ve now covered the basic measures of central tendency. In sum,
the first step in summarizing data is to compute a measure of central tendency to
describe the score around which the distribution tends to be located.
■
Compute the mode with nominal data or with a distinctly bimodal distribution of
any type of scores.
■
Compute the median with ordinal scores or with a skewed distribution of interval or
ratio scores.
■
Compute the mean with a normal distribution of interval or ratio scores.
FIGURE 4.6
Measures of central
tendency for skewed
distributions
The vertical lines show the
relative positions of the
mean, median, and mode.
f
Negative skew
scores
f
High
. . . . . .
Middle Low
Positive skew
scores
Low . . . Middle . . . High
Mode
Mode
Median
Mean
Mean
Median

Most often the data in behavioral research are summarized using the mean. This is
because most often we measure variables using interval or ratio scores and most often
with such scores, “mother nature” produces a reasonably normal distribution. Because
the mean is used so extensively, we will delve further into its characteristics and uses in
the following sections.
TRANSFORMATIONS AND THE MEAN
Recall that we perform transformations to make scores easier to work with or to make
scores from different variables comparable. The simplest transformation is to add, sub-
tract, multiply, or divide each score by a constant. This brings up the burning question:
How do transformations affect the mean?
If we add a constant to each raw score in a sample, the new mean of the trans-
formed scores will equal the old mean of the raw scores plus . For example, the scores
7, 8, and 9 have a mean of 8. Adding 5 to each score produces 12, 13, and 14. The new
mean is 13. The old mean of 8 plus the constant 5 also equals 13. Thus, the rule is that
new . The same logic applies for other mathematical operations.
When subtracting K from each score, new . When multiplying each
score by ,new . When dividing each score by ,new .
The above rules also apply to the median and to the mode. In essence, using a con-
stant merely changes the location of each score on the variable by points, so we also
move the “address” of the distribution by the same amount.
DEVIATIONS AROUND THE MEAN
To understand why the mean is used so extensively in statistics and research, you must
first understand why the mean is the center of a distribution. The mean is the center
score because it is just as far from the scores above it as it is from the scores below it.
That is, the total distance that some scores lie above the mean equals the total distance
that other scores lie below the mean.
The distance separating a score from the mean is called the score’s deviation, indi-
cating the amount the score “deviates” from the mean. A score’s deviation is equal to
the score minus the mean, or in symbols:
K
X 5 1old X2>KKX 5 1old X2KK
X 5 old X – K
X 5 old X 1 K
K
1K2
Deviations Around the Mean 69
The formula for computing a score’s deviation is
X – X
Thus, if the sample mean is 47, a score of 50 deviates by , because .
A score of 40 deviates from the mean of 47 by , because .
REMEMBER Always subtract the mean from the raw score when computing
a score’s deviation.
Do not, however, think of deviations as simply positive or negative numbers. Think
of a deviation as having two components: The number, which indicates distance from
40 2 47 52727
50 2 47 is 1 313
70 CHAPTER 4 / Measures of Central Tendency: The Mean, Median, and Mode
the mean (which is always positive), and the sign, which indicates direction from the
mean. For example, the table in Figure 4.7 shows that we computed the deviation
scores for our previous creativity scores by subtracting the mean of 4 from each score.
In the polygon in Figure 4.7 the axis is labeled twice, once using each creativity score
and, underneath, using its corresponding deviation score. Thus, you can see that a posi-
tive deviation indicates that the raw score is larger than the mean and graphed to the
right of the mean. A negative deviation indicates that the score is less than the mean
and graphed to the left of the mean. The size of the deviation (regardless of its sign) in-
dicates the distance the raw score lies from the mean: the larger the deviation, the
farther into the tail the score is from the mean. A deviation of 0 indicates that an indi-
vidual’s raw score equals the mean.
Now you can see why the mean is the mathematical center of any distribution. If we
add together all of the positive deviations we have the total distance that some scores are
above the mean. Adding all of the negative deviations, we have the total distance that
other scores are below the mean. If we add all of the positive and negative deviations
together, we have what is called the sum of the deviations around the mean. As in the
table in Figure 4.7, the total of the positive deviations will always equal the total of the
negative deviations. Therefore:
The sum of the deviations around the mean always equals zero.
Thus, the mean is the center of a distribution because, in total, it is an equal distance
form the scores above and below it. Therefore, the half of the distribution that is below
the mean balances with the half of the distribution that is above the mean.
The sum of the deviations around the mean always equals zero, regardless of the
shape of the distribution. For example, in the skewed sample of 4, 5, 7 and 20, the mean
is 9, which produces deviations of , , , and , respectively. Their sum is
again zero.
Some of the formulas you will see in later chapters involve something similar
to computing the sum of the deviations around the mean. The statistical code for
finding the sum of the deviations around the mean is . Al-
ways work inside parentheses first, so this says to first find the devia-
tion for each score, The indicates to then find the sum
of the deviations. Thus, say we have the scores 3, 4, 6, and 7. With
, then , which equals
zero.
REMEMBER is the symbol for the sum of the devia-
tions around the mean.
Σ1 X 2 X
2
1 1 1 2Σ1X 2 X2 5 22 1 21X 5 5
Σ1X 2 X2.
Σ1X 2 X2
111222425
X
Score Minus Score Equals Deviation
14
24
34
34
44
44
44
54
54
64
74
Sum 05
1352
1252
1152
1152
052
052
052
2152
2152
2252
2352
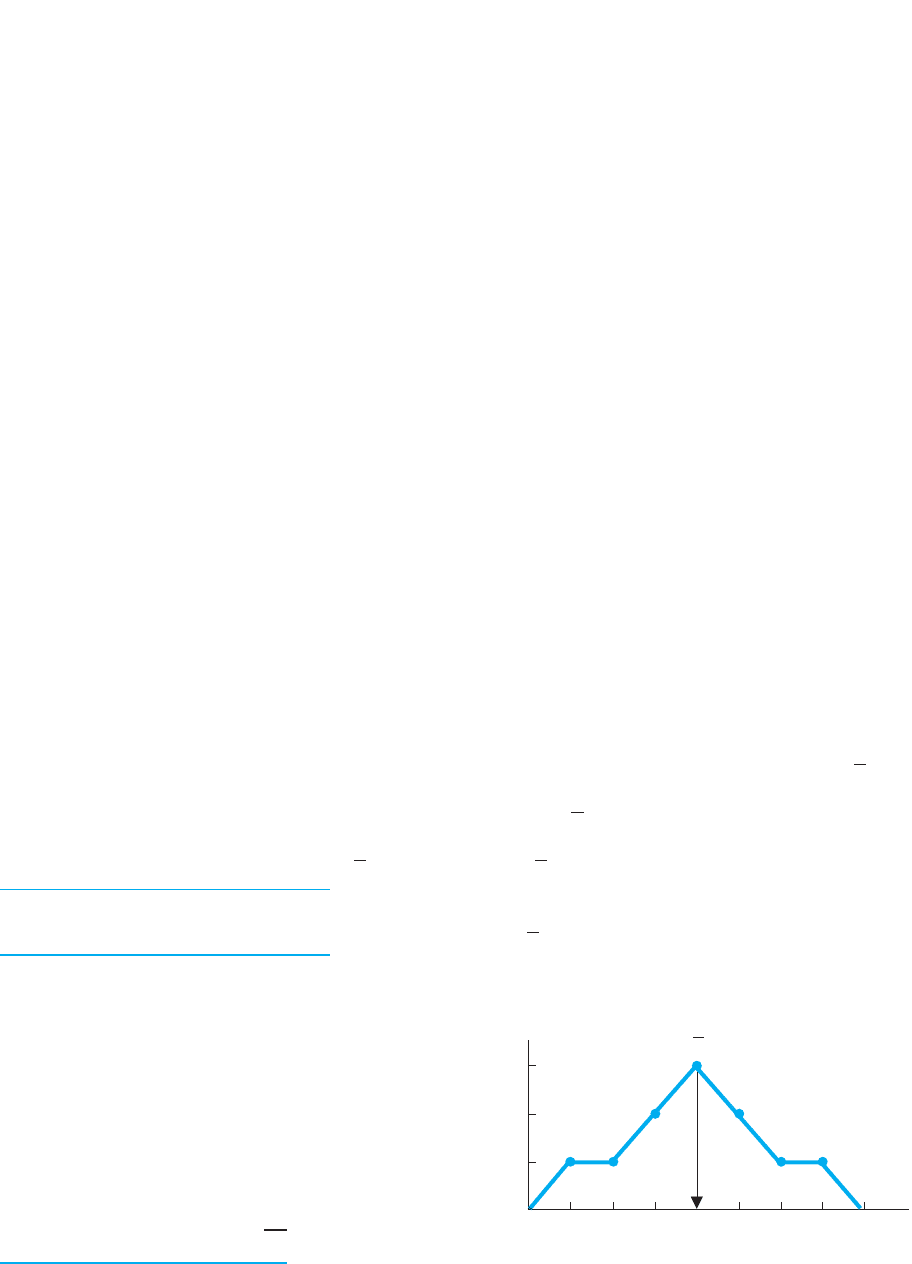
FIGURE 4.7
Deviations Around the Mean
The mean is subtracted from each score,
resulting in the score’s deviation.
Mean
0
3
2
1
f
Creativity raw scores
Deviations
X
12345678
–3
–2
–1 0 +1 +2 +3

The importance of the sum of the deviations equaling zero is that this makes the
mean the score that, literally, everyone in the sample scored around, with scores above
or below it to the same extent. Therefore, we think of the mean as the typical score be-
cause it more or less describes everyone’s score, with the same amounts of more and
less. This is why the mean is such a useful tool for summarizing a distribution. It is also
why we use the mean when we are predicting any individual scores.
Using the Mean to Predict Scores
Recall that a goal of behavioral science is to predict a behavior in a particular situation.
This translates into predicting the scores found in that situation. When we don’t know
anything else, the mean is our best prediction about the score that any individual ob-
tains. Because it is the central, typical score, we act as if all the scores were the mean
score, and so we predict that score every time. This is why, if the class average on an
exam is 80, you would predict that each student’s grade is 80. Further, for any students
who were absent, you’d predict that they will score an 80 as well. Likewise, if your
friend has a B average in college, you would predict that he or she received a B in every
course. For any future course, you’d also predict a B.
However, not every score in a sample will equal the mean, so our predictions will
sometimes be wrong. To measure the amount of our error when predicting unknown
scores, we measure how well we can predict the known scores in our data. The amount
of error in any single prediction is the difference between what someone actually gets
and what we predict he or she gets . In symbols, this difference is . We’ve
seen that this is called a deviation, but alter your perspective here: In this context, a de-
viation is the amount of error we have when we predict the mean as someone’s score.
REMEMBER When we use the mean to predict scores, a deviation
indicates our error: the difference between the we predict for someone and
the that he or she actually gets.
If we determine the amount of error in every prediction, our total error is equal to the
sum of the deviations. As we’ve seen, in any data the sum of the deviations is always
zero. Thus, by predicting the mean score every time, the errors in our predictions will,
over the long run, cancel out to equal zero. For example, the test scores 70, 75, 85, and
90 have a of 80. One student scored the 70, but we would predict he scored 80, so we
would be wrong by . But, another student scored the 90; by predicting an 80 for
her, we would be off by In the same way, our errors for the sample will cancel out
so that the total error is zero. Likewise, we assume that other participants will behave
similarly to those in our sample, so that using the mean to predict any unknown scores
should also result in a total error of zero.
If we predict any score other than the mean, the total error will be greater than zero.
A total error of zero means that, over the long run, we overestimate by the same amount
that we underestimate. A basic rule of statistics is that if we can’t perfectly describe
every score, then the next best thing is to have our errors balance out. There is an old
joke about two statisticians shooting at a target. One hits 1 foot to the left of the target,
and the other hits 1 foot to the right. “Congratulations,” one says. “We got it!” Like-
wise, if we cannot perfectly describe every score, then we want our errors—our over-
and underestimates—to balance out to zero. Only the mean provides this capability.
Of course, although our total error will equal zero, any individual prediction may be
very wrong. Later chapters will discuss how to reduce these errors. For now, however,
110.
210
X
X
X
1X 2 X2
X 2 X1X21X2
Deviations Around the Mean 71

72 CHAPTER 4 / Measures of Central Tendency: The Mean, Median, and Mode
DESCRIBING THE POPULATION MEAN
Recall that ultimately we seek to describe the population of scores we would find in a
given situation. Populations are unwieldy, so we must also summarize them. Usually
we have interval or ratio scores that form at least an approximately normal distribution,
so we usually describe the population using the mean.
The symbol for the mean of a population is the Greek letter (pronounced “mew”).
Thus, to indicate that the population mean is 143, we’d say that . The symbol
simply shows that we’re talking about a population instead of a sample, but a mean
is a mean, so a population mean has the same characteristics as a sample mean: is the
average score in the population, it is the center of the distribution, and the sum of the
deviations around equals zero. Thus, is the score around which everyone in the
population scored, it is the typical score, and it is the score that we predict for any indi-
vidual in the population.
REMEMBER The symbol for a population mean is .
5 143
A QUICK REVIEW
■
A deviation is the difference between a score and
the mean (or ) and indicates a score’s loca-
tion relative to the mean.
■
When using the mean to predict a score, the score’s
deviation indicates the amount of error in the
prediction. The total error over all such predictions
is , the sum of the deviations around the
mean, which equals zero.
MORE EXAMPLES
In some data, . Therefore, scores above 30
will produce positive deviations which will cancel out
with the negative deviations from the scores below the
mean, so that the sum of the deviations equals zero.
For every participant, we’d predict a score of 30. Over
the long run, our over- and under-estimates will can-
cel out. In symbols, each error is the difference be-
tween the actual and the that we predict, so theX
X
X 5 30
Σ1X 2 X2
1X 2 X2
total error is the sum of the deviations, ,
which is zero.
For Practice
1. By performing , you are computing a ____.
2. By performing , you are computing ____.
3. By saying that , you are saying
that the mean is located ____ relative to the scores
in a sample.
4. By saying that , you are saying
that when predicting someone’s score is the mean,
our errors ____.
Answers
1. deviation
2. the sum of the deviations around the mean
3. in the center of the distribution
4. balance out to equal a total of zero
Σ1X 2 X2 5 0
Σ1X 2 X2 5 0
Σ1X 2 X2
X 2 X
Σ1X 2 X2
remember that unless we have additional information about the scores, the mean is our
best prediction of any score.
REMEMBER We use the mean as everyone’s predicted score because, over
the long run, the over- and underestimates will cancel out so that the total er-
ror in our predictions equals zero.

How do we determine the value of If all the scores in the population are known to
us, we compute using the same formula that we used to compute :
Usually, however, a population is infinitely large, so we cannot directly compute .
Instead, we estimate based on the mean of a random sample. If, for example, a sam-
ple’s mean in a particular situation is 99, then, assuming the sample accurately repre-
sents the population, we would estimate that in this situation is also 99. We make
such an inference because it is a population with a mean of 99 that is most likely to pro-
duce a sample with a mean of 99. That is, a of 99 indicates a sample with mostly
scores around 99 in it. What population would be most likely to provide these scores?
The population containing mostly scores around 99—where the population mean is 99.
Thus, we assume that most scores in a sample are located where most scores in the pop-
ulation are located, so a sample mean is a good estimate of .
SUMMARIZING RESEARCH
Now you can understand how measures of central tendency are used in research. Usu-
ally we compute the mean because we have normally distributed interval or ratio
scores. Thus, we might compute the mean number of times our participants exhibit a
particular behavior, or compute their mean response to a survey question. In a correla-
tional study we compute their mean score on the variable and the mean score on the
variable. Using such means, we can describe the typical score and predict the scores
of other individuals, including those of the entire population.
Instead we might compute the median or the mode if we have other types of scores
or distributions. When considering the shape of the distribution, we are usually con-
cerned with the shape of distribution for the population, because ultimately that is what
we want to describe. How do we know its shape? The first step in conducting a study is
to read relevant published research reports. From these you will learn many things, in-
cluding what other researchers say about the population and how they compute central
tendency.
Summarizing an Experiment
We perform similar steps when summarizing the results of an experiment. Remember
though that the results that need summarizing are the scores from the dependent vari-
able. Therefore, it is the characteristics of the dependent scores that determine whether
we compute the mean, median, or mode.
REMEMBER The measure of central tendency to compute in an experiment
is determined by the type of scale used to measure the dependent variable.
Usually it is appropriate to compute the mean, and we do so for each condition of
the independent variable. For example, here is a very simple study. Say that we think
people will make more mistakes when recalling a long list of words than when recall-
ing a short list. We create three conditions of the independent variable of list length. In
one condition, participants read a list containing 5 words and then recall it. In another
condition, participants read a 10-item list and recall it, and in a third condition, they
Y
X
X
5
ΣX
N
X
?
Summarizing Research 73

74 CHAPTER 4 / Measures of Central Tendency: The Mean, Median, and Mode
read a 15-item list and recall it. For each participant, we measure the dependent vari-
able of number of errors made in recalling the list.
First, look at the individual scores shown in Table 4.1. A relationship is present here
because a different and higher set of error scores occurs in each condition. Most experi-
ments involve a much larger , however, so to see the relationship buried in the raw
scores, we compute a measure of central tendency.
In our memory experiment, the variable of recall errors is a ratio variable that is as-
sumed to form an approximately normal distribution. Therefore, we compute the mean
score in each condition by computing the mean of the scores in each column. These
are shown under each column in Table 4.1.
Normally in a research report you will not see the individual raw scores. There-
fore, to interpret the mean in any study, simply envision the scores that would typi-
cally produce such a mean. For example, when , envision a normal distribution
of scores above and below 3, with most scores close to 3. Likewise, for each mean,
essentially envision the kinds of raw scores shown in our columns. Thus, the means
show that recalling a 5-item list resulted in one distribution located around three er-
rors, but recalling a 10-item list produced a different distribution at around six errors,
and recalling a 15-item list produced still another distribution at around nine errors.
Further, we use the mean score to describe the individual scores in each condition.
In Condition 1, for example, we’d predict that any participant would make about
three errors.
Most important is the fact that, by looking at the means alone, we see that a rela-
tionship is present here: as the conditions change (from 5 to 10 to 15 items in a list),
the scores on the dependent variable also change (from around 3, to around 6, to
around 9 errors, respectively).
Note, however, that not all means must change for a relationship to be present. For
example, we might find that only the mean in the 5-item condition is different from
the mean in the 15-item condition. We still have a relationship if, at least sometimes,
as the conditions of the independent variable change, the dependent scores also
change.
REMEMBER We summarize an experiment usually by computing the mean
of the dependent scores in each condition. A relationship is present if the
means from two or more conditions are different.
The above logic also applies to the median or mode. For example, say that we study
political party affiliation as a function of a person’s year in college. Our dependent
variable is political party, a nominal variable, so the mode is the appropriate measure
of central tendency. We might see that freshmen most often claim to be Republican,
but the mode for sophomores is Democrat; for juniors, Socialist; and for seniors,
Communist. These data reflect a relationship because they indicate that as college
level changes, political affiliation tends to change. Likewise, say that the median
income for freshmen is lower than
the median income for sophomores,
which is lower than for upperclass-
men. This tells us that the location
of the distribution of incomes is dif-
ferent for each class, so we know
that the income “scores” of individ-
uals are changing as their year in
college changes.
X
5 3
N
Condition 1: Condition 2: Condition 3:
5-Item List 10-Item List 15-Item List
25 7
36 9
4711
X
5 9X 5 6X 5 3
TABLE 4.1
Errors Made by
Participants Recalling a
5-, 10-, or 15-Item List
The mean of each condition
is under each column.
Graphing the Results of an Experiment
Recall that the independent variable involves the conditions “given” to participants so
it is plotted on the axis. The dependent variable is plotted on the axis. However, be-
cause we want to summarize the data, usually we do not plot the individual scores.
Rather, we plot either the mean, median, or mode of the dependent scores from each
condition.
REMEMBER Always plot the conditions of the independent variable on the
axis and the mean, median, or mode of the dependent scores on the axis.
Note: Do not be confused by the fact that we use to represent the scores when
computing the means. We still plot them on the axis.
We complete the graph by creating either a line graph or a bar graph. The type of
graph to select is determined by the characteristics of the independent variable.
Line Graphs Create a line graph when the independent variable is an interval or a
ratio variable. In a line graph adjacent data points are connected with straight lines.
For example, our independent variable of list length involves a ratio scale. Therefore,
we create the line graph shown on the left in Figure 4.8. Note that the label on the
axis is “mean recall errors.” Then we place a data point above the 5-item condition
opposite the mean of 3 errors, another data point above the 10-item condition at the
mean of 6 errors, and so on. We use straight lines to connect the data points here for the
same reason we did when producing polygons: Anytime the variable on the axis in-
volves an interval or ratio scale, we assume that it is a continuous variable and there-
fore we draw lines. The lines show that the relationship continues between the points
shown on the axis. For example, we assume that if there had been a 6-item list, the
mean error score would fall on the line connecting the means for the 5- and 10-item lists.
(The APA publication guidelines do not recommend using histograms to summarize
experiments.)
X
X
Y
Y
X
YX
YX
Summarizing Research 75
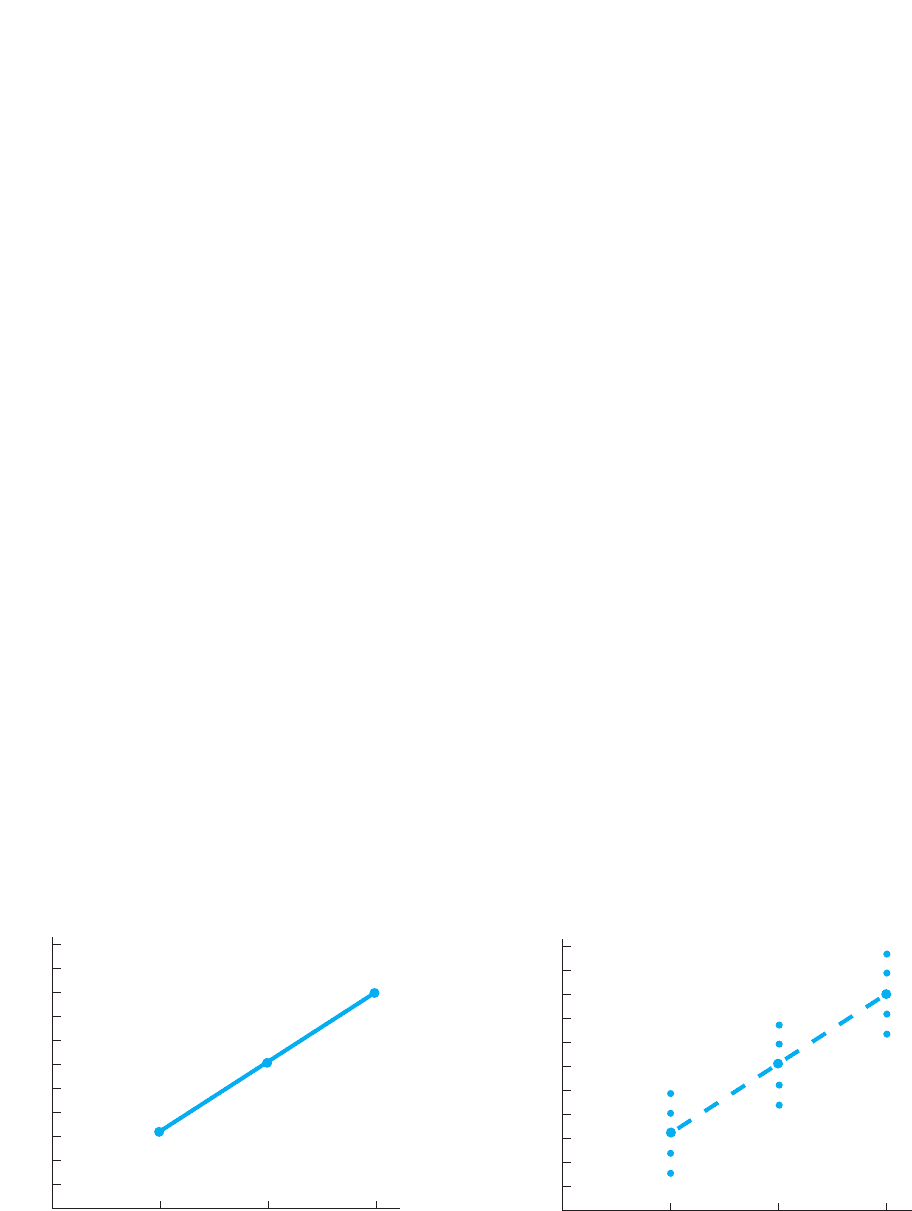
FIGURE 4.8
Line graphs showing (A) the relationship for mean errors in recall as a function of list length and (B) the data points we
envision around each mean
0
Length of list
11
10
9
8
7
6
5
4
3
2
1
Mean recall errors
51015
0
Length of list
11
10
9
8
7
6
5
4
3
2
1
Recall errors
51015
A
B
is envisioned as
76 CHAPTER 4 / Measures of Central Tendency: The Mean, Median, and Mode
The previous Figure 4.8 conveys the same information as the means did back in
Table 4.3, where a different mean indicates a different distribution of scores. We envi-
sion these distributions as shown in the right-hand graph. Each mean implies a sample
of scores and their corresponding data points are around—above and below—the
mean’s data point. Because the vertical positions of the means change as the conditions
change, we know that the raw scores also change, so a relationship is present.
Notice that you can easily spot such a relationship because the different means pro-
duce a line graph that is not horizontal. On any graph, if the summary data points form
a line that is not horizontal, it indicates that the individual Y scores are changing as
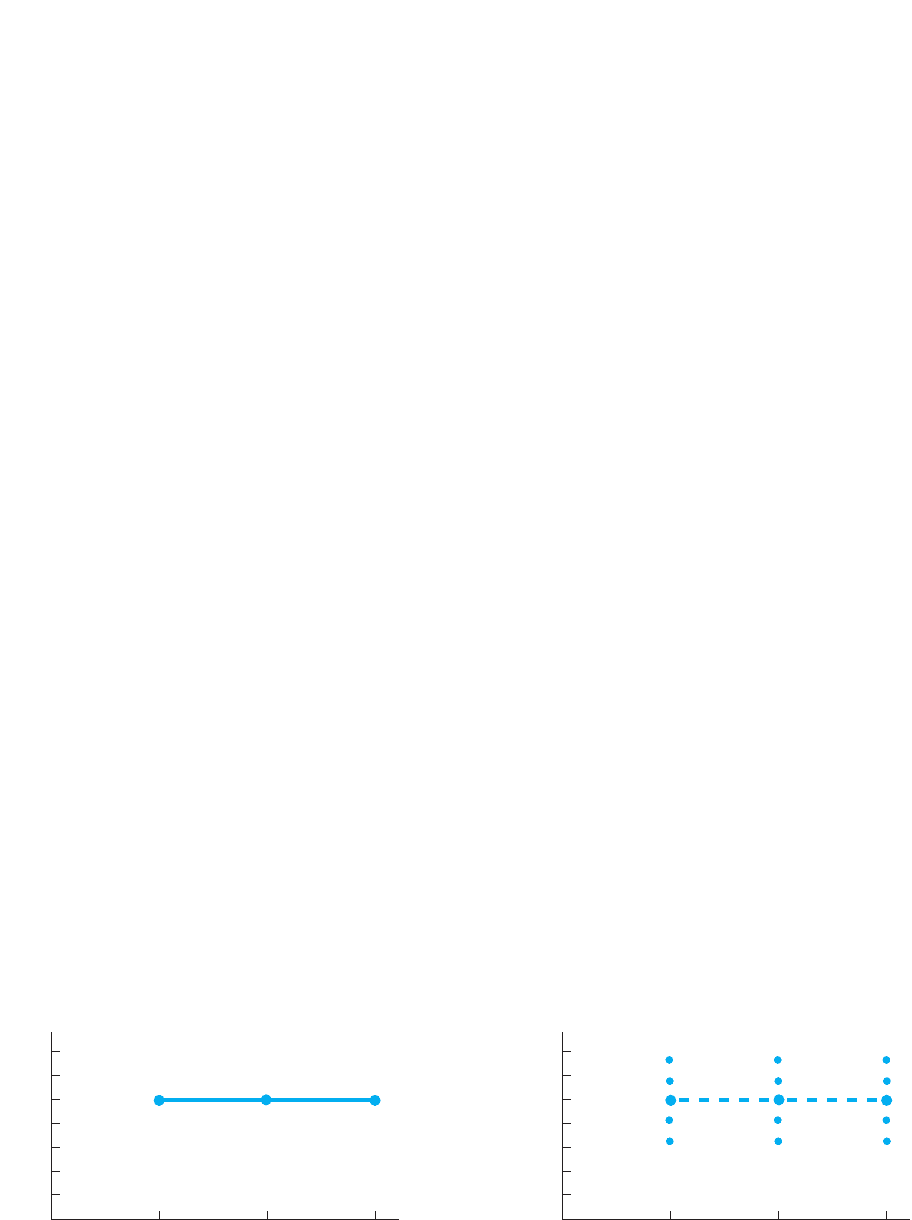
the X scores change, so a relationship is present. On the other hand, say that each con-
dition had produced a mean of 5 errors. As shown below on the left in Figure 4.9, this
results in a horizontal (flat) line, indicating that as list length changes, the mean error
score stays the same. This implies that (as in the figure on the right) the individual
scores stay the same regardless of the condition, so no relationship is present. Thus, on
any graph, if the summary data points form a horizontal line, it indicates that the indi-
vidual Y scores do not change as the X scores change, and so a relationship is not
present.
Bar Graphs Create a bar graph when the independent variable is a nominal or an
ordinal variable. Notice that the rule here is the same as it was in Chapter 3: Create a
bar graph whenever the X scores are nominal or ordinal scores. With experiments, we
place a bar above each condition on the axis to the height on the axis that corre-
sponds to the mean for that condition. As usual, adjacent bars do not touch: Recall that
nominal or ordinal scales are discrete, meaning that you can have one score or the
other, but nothing in-between. The spaces between the bars communicate this.
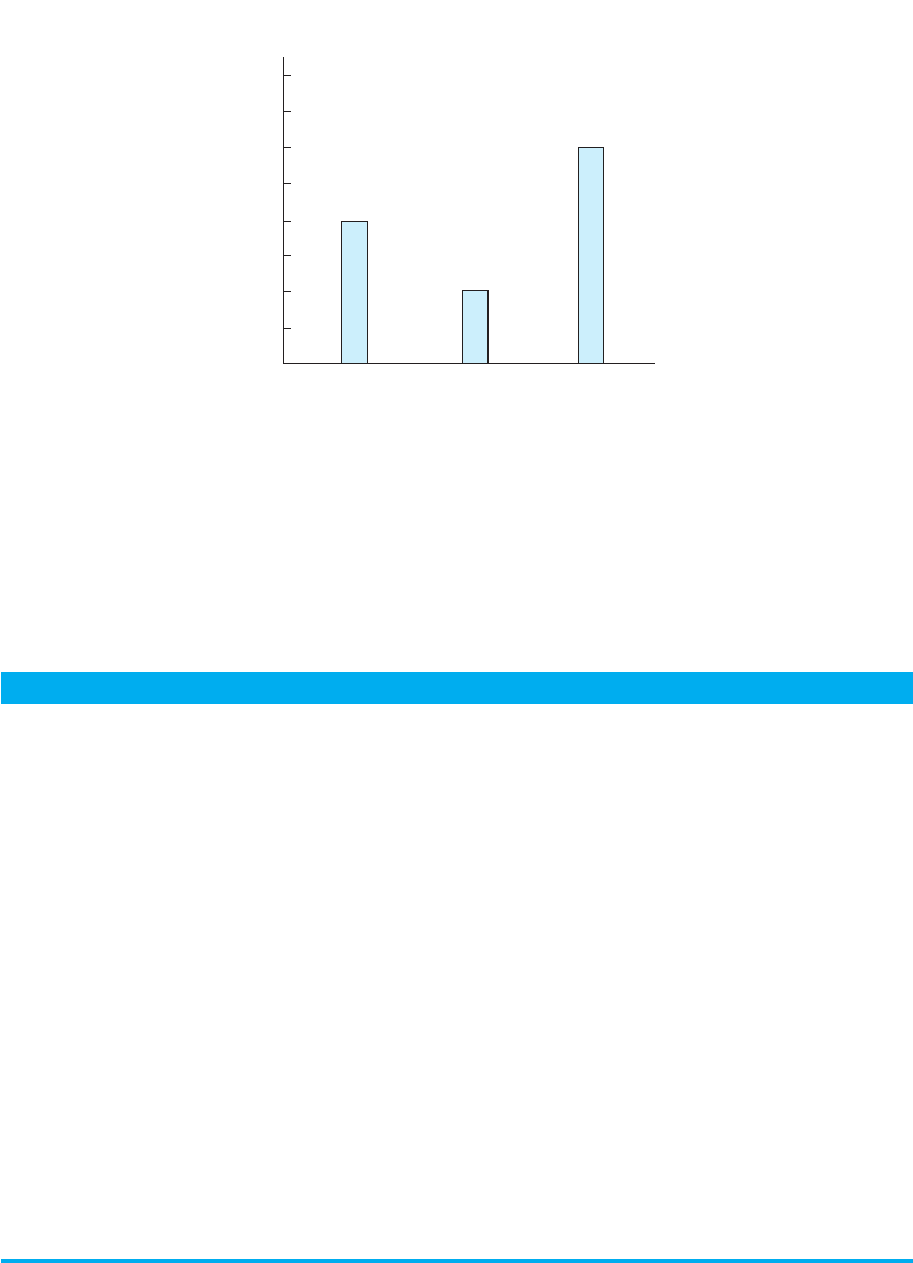
For example, say that we compared the recall errors made by psychology majors,
English majors, and physics majors. The independent variable of college major is a
nominal variable, so we have the bar graph shown in Figure 4.10. Because the tops of
the bars do not form a horizontal line, we know that different means and thus different
scores occur in each condition. We can again envision that we would see individual er-
ror scores at around 8 for physics majors, around 4 for psychology majors, and around
12 for English majors. Thus, the scores change as a function of college major, so a rela-
tionship is present.
YX
FIGURE 4.9
Line graphs showing (A) no relationship for mean errors in recall as a function of list length and (B) the data points we
envision around each mean
0
Length of list
7
6
5
4
3
2
1
Mean recall errors
51015 0
Length of list
7
6
5
4
3
2
1
Recall errors
51015
AB
is envisioned as
Summarizing Research 77
FIGURE 4.10
Bar graph showing mean
errors in recall as a func-
tion of college major
The height of each bar corre-
sponds to the mean score for
the condition.
College major
10
8
6
4
2
12
14
16
0
PsychologyPhysics
English
Mean recall errors
A QUICK REVIEW
■
Graph the independent variable on the axis and
the mean, median, or mode of the dependent scores
on the Y axis.
■
Create a line graph when the independent variable
is interval or ratio; produce a bar graph when it is
nominal or ordinal.
MORE EXAMPLES
We ask males and females to rate their satisfaction
with an instructor and the mean scores are 20 and 30,
respectively. To graph this, gender is a nominal inde-
pendent variable, so plot a bar graph, with the labels
“male” and “female” on and the means for each on
. Instead, say we measure the satisfaction scores of
students tested with either a 10-, 40-, or 80-question
final exam and, because the scores form skewed dis-
tributions, compute the median scores. Test length is a
ratio independent variable, so plot a line graph, with
the labels 10, 40, and 80 on and the median of each
condition on .Y
X
Y
X
X
For Practice
1. The independent variable is plotted on the ____
axis, and the dependent variable is plotted on
the ____ axis.
2. A ____ shows a data point above each , with
adjacent data points connected with straight lines.
3. A ____ shows a discrete bar above each .
4. The characteristics of the ____ variable determine
whether to plot a line or bar graph.
5. Create a bar graph with ____ or ____ variables.
6. Create a line graph with ____ or ____ variables.
Answers
1.
2. line graph
3. bar graph
4. independent
5. nominal; ordinal
6. interval; ratio
X; Y
X
X
Note: In a different experiment we might have measured a nominal or an ordinal
dependent variable. In that case we would plot the mode or median on the axis for
each condition. Then, again depending on the characteristics of the independent vari-
able, we would create either a line or bar graph.
REMEMBER The scale of measurement of the dependent variable determines
the measure of central tendency to calculate. The scale of the independent
variable determines the type of graph to create.
Y