Heiman G. Basic Statistics for the Behavioral Sciences
Подождите немного. Документ загружается.

58 CHAPTER 3 / Frequency Distributions and Percentiles
17. Interpret each of the following. (a) In a small sample, you scored at the 35th
percentile. (b) Your score has a of .40. (c) Your score is in the upper tail of
the normal curve. (d) Your score is in the left-hand tail of the normal curve.
(e) Your score has a of 50. (f) From the normal curve, your score is at the
60th percentile.
18. Draw a normal curve and identify the approximate location of the following
scores. (a) You have the most frequent score. (b) You have a low-frequency score,
but the score is higher than most. (c) You have one of the lower scores, but it has a
relatively high frequency. (d) Your score seldom occurred.
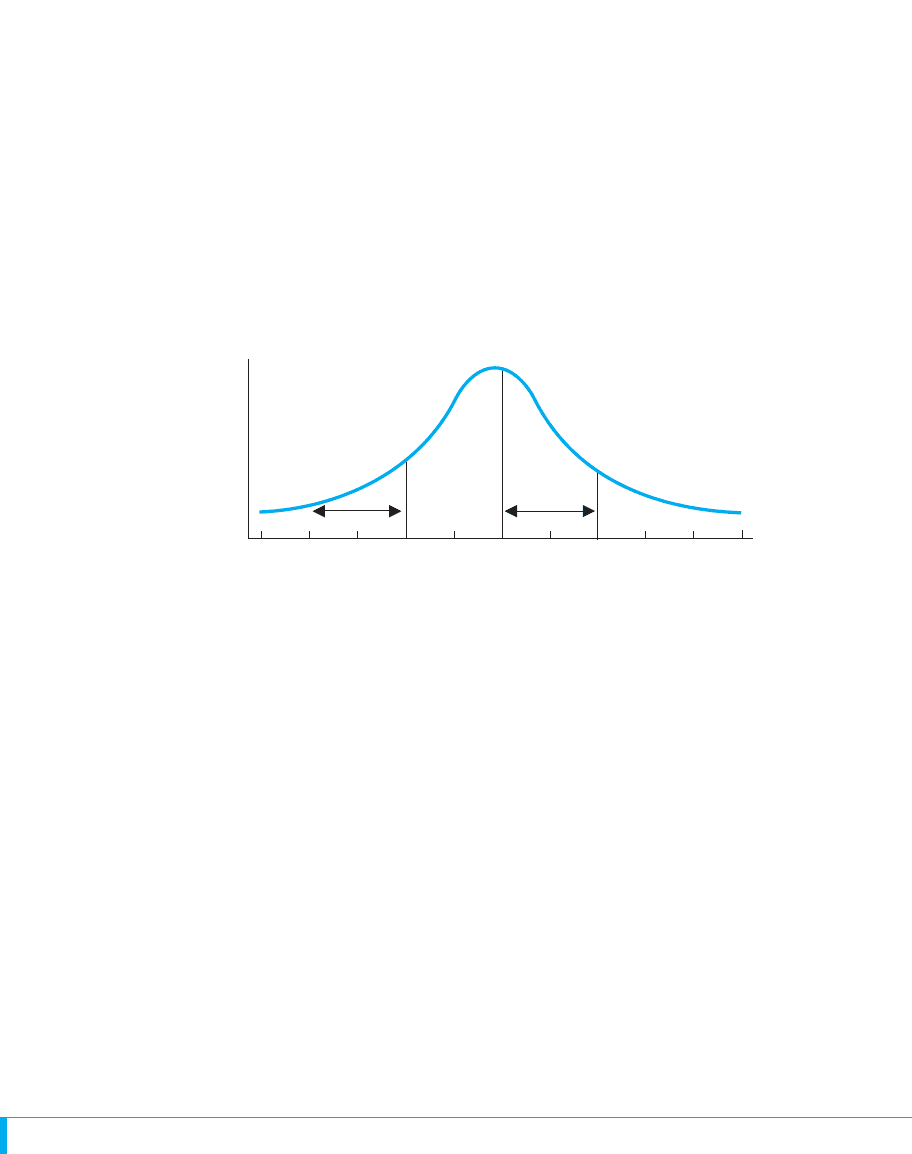
19. The following shows the distribution of final exam scores in a large introductory
psychology class. The proportion of the total area under the curve is given for two
segments.
cf
rel. f
f
Exam scores
50 55 60 65 70 75 80 85 9045
.20
.30
95
(a) Order the scores 45, 60, 70, 72, and 85 from most frequent to least frequent.
(b) What is the percentile of a score of 60? (c) What proportion of the sample
scored below 70? (d) What proportion scored between 60 and 70? (e) What
proportion scored above 80? (f) What is the percentile of a score of 80?
20. What is the advantage and disadvantage of using grouped frequency distributions?
21. Organize the ratio scores below in a table showing simple frequency, relative
frequency, and cumulative frequency.
49 52 47 52 52 47 49 47 50
51 50 49 50 50 50 53 51 49
22. (a) Draw a simple frequency polygon using the data in question 23. (b) Draw a
relative frequency histogram of these data.
23. Organize the interval scores below in a table showing simple frequency,
cumulative frequency, and relative frequency.
16 11 13 12 11 16 12 16 15
16 11 13 16 12 11
24. Using the data in question 25, draw the appropriate graph to show (a) simple
frequency and (b) relative frequency.
INTEGRATION QUESTIONS
25. Describe each scale of measurement. (Ch. 2)
26. (a) Which scales of measurement are assumed to be discrete; what does
this mean? (b) Which scales are assumed to be continuous; what does this
mean? (Ch. 2)
27. What type of graph should you create when counting the frequency of: (a) The
brands of cell phones owned by students? Why? (b) The different body weights
reported in a statewide survey? Why? (c) The people falling into one of eight
salary ranges? Why? (d) The number of students who were absent from a class
either at the beginning, middle, or end of the semester. (Chs. 2, 3)
28. An experimenter studies vision in low light by having participants sit in a
darkened room for either 5, 15, or 25 minutes and then tests their ability to
correctly identify 20 objects. (a) What is the independent variable here? (b) What
are the conditions? (c) What is the dependent variable? (d) You would use the
scores from which variable to create a frequency distribution? (Chs. 2, 3)
29. Our is 50, and for some scores we have selected the proportion of the area under
the curve is .60. (a) What percent of the time do we expect these scores to occur?
(b) How many of our participants do we expect to have these scores? (Chs. 1, 3)
■ ■ ■ SUMMARY OF
FORMULAS
N
Integration Questions 59
1. The formula for computing a score’s relative
frequency is
rel.
f 5
f
N
2. The formula for finding the percentile for a score
with a known is:
Score’s Percentile 5 a
cf
N
b11002
cf

The frequency distributions discussed in the previous chapter are important because the
shape of a distribution is an important characteristic of data for us to know. Therefore,
the first step in any statistical analysis is to determine the distribution’s shape. Then,
however, we compute individual numbers—statistics—that each describe an important
characteristic of the data. This chapter discusses statistics that describe the important
characteristic called central tendency. The following sections present (1) the concept of
central tendency, (2) the three ways to compute central tendency, and (3) how we use
them to summarize and interpret data.
But first . . .
NEW STATISTICAL NOTATION
A new important symbol is the Greek letter called sigma. Sigma is the symbol for
summation. It is used in conjunction with a symbol for scores, so you will see such no-
tations as In words, is pronounced sum of X and literally means to find the
sum of the scores. Thus, for the scores 5, 6, and 9 is 20, and in code we would
say, Notice that we do not care whether each is a different score. If the
scores are 4, 4, and 4, then
REMEMBER The symbol indicates to sum the scores.X©X
©X 5 12.
X©X 5 20.
©XX
©X©X.
©,
GETTING STARTED
To understand this chapter, recall the following:
■
From Chapter 2, the logic of statistics and parameters and the difference
between an independent and a dependent variable.
■
From Chapter 3, when to create bar graphs or polygons, how to interpret
polygons, and how to use the area under the normal curve.
Your goals in this chapter are to learn
■
What measures of central tendency tell us about data.
■
What the mean, median, or mode is and when each is appropriate.
■
How a sample mean is used.
■
What deviations around the mean are.
■
How to interpret and graph the results of an experiment.
Measures of Central Tendency:
The Mean, Median, and Mode
4
60
WHY IS IT IMPORTANT TO KNOW ABOUT CENTRAL TENDENCY?
Recall that descriptive statistics tell us the obvious things we would ask about a sample
of scores. So think about what questions you ask your professor about the grades after
you’ve taken an exam. Your first question is how did you do, but your second question
is how did everyone else do? Did everyone score high, low, or what? Central tendency
is important because it answers this most basic question about data: Are the scores gen-
erally high scores or low scores? You need this information to understand both how the
class performed and how you performed relative to everyone else. But it is difficult to
do this by looking at the individual scores or at the frequency distribution. Instead, it is
much better if you know something like the class average; an average on the exam of
80 versus 30 is very understandable. Therefore, in virtually all research, we first com-
pute a statistic that shrinks the data down into one number that summarizes everyone’s
score. This statistic is called a measure of central tendency. This is the only way to eas-
ily describe and interpret the sample as a whole.
WHAT IS CENTRAL TENDENCY?
To understand central tendency, first change your perspective of what a score indicates.
For example, if I am 70 inches tall, don’t think of this as indicating that I have 70 inches
of height. Instead, think of any variable as an infinite continuum—a straight line—and
think of a score as indicating a participant’s location on that line. Thus, my score
locates me at the address labeled 70 inches. If my brother is 60 inches tall, then he is
located at the point marked 60 on the height variable. The idea is not so much that he is
10 inches shorter than I am, but rather that we are separated by a distance of 10 units—
in this case, 10 “inch” units. In statistics, scores are locations, and the difference
between any two scores is the distance between them.
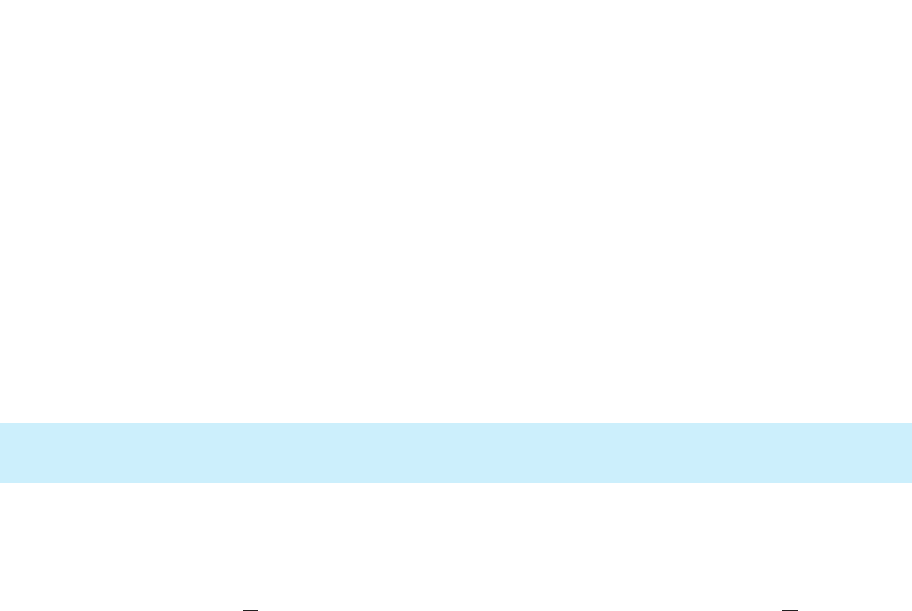
From this perspective, a frequency distribution shows the location of the scores. For
example, Figure 4.1 shows height scores from two samples, one containing low scores
and one containing higher scores. In our parking lot view of the normal curve, partici-
pants’ scores determine where they stand. A high score puts them on the right side of
the lot, a low score puts them on the left side, and a middle score puts them in a crowd
in the middle. Further, if we have two distributions containing different scores, then the
distributions have different locations on the variable.
Thus, when we ask, “Are the scores generally high scores or low scores?” we are ac-
tually asking, “Where on the variable is the distribution located?” A measure of central
tendency is a score that summarizes the location of a distribution on a variable. Listen
What is Central Tendency? 61
FIGURE 4.1
Two sample polygons on
the variable of height
Each polygon indicates the
locations of the scores and
their frequencies.
0
Height (in inches)
f
Lower . . .
scores
. . .
. . . Higher
Sample A Sample B
58 59 60 61 62 68 69 70 71 72
scores

62 CHAPTER 4 / Measures of Central Tendency: The Mean, Median, and Mode
to its name: It is a score that indicates where the center of the distribution tends to be lo-
cated. Thus, a measure of central tendency is a number that is a summary that you can
think of as indicating where on the variable most scores are located; or the score that
everyone scored around; or the typical score; or the score that serves as the address for
the distribution as a whole.
So, in Sample A back in Figure 4.1, most of the scores are in the neighborhood of
59, 60, and 61 inches, so a measure of central tendency will indicate that the distribu-
tion is centered at 60 inches. In Sample B, the scores are distributed around 70 inches.
Notice that the above example again illustrates how to use descriptive statistics
to envision the important aspects of the distribution without looking at every
individual score. If a researcher told you only that one normal distribution is
centered at 60 and the other is centered at 70, you could envision Figure 4.1 and
have a general idea of what’s in the data. Thus, although you’ll see other statistics
that add to this mental picture, measures of central tendency are at the core of sum-
marizing data.
REMEMBER The first step in summarizing any set of data is to compute the
appropriate measure of central tendency.
We will discuss three common measures of central tendency. The trick is to com-
pute the correct one so that you accurately envision where most scores in the data are
located. Which measure of central tendency you should calculate depends on two
factors:
1. The scale of measurement used so that the summary makes sense given the
nature of the scores.
2. The shape of the frequency distribution the scores produce so that the measure
accurately summarizes the distribution.
In the following sections, we first discuss the mode, then the median, and finally
the mean.
THE MODE
One way to describe where most of the scores in a distribution are located is to find the
one score that occurs most frequently. The most frequently occurring score is called the
mode. (We have no accepted symbol for the mode.) For example, say we’ve collected
some test scores and arranged them from lowest to highest: 2, 3, 3, 4, 4, 4, 4, 5, 5, and
6. The score of 4 is the mode because it occurs more frequently than any other score.
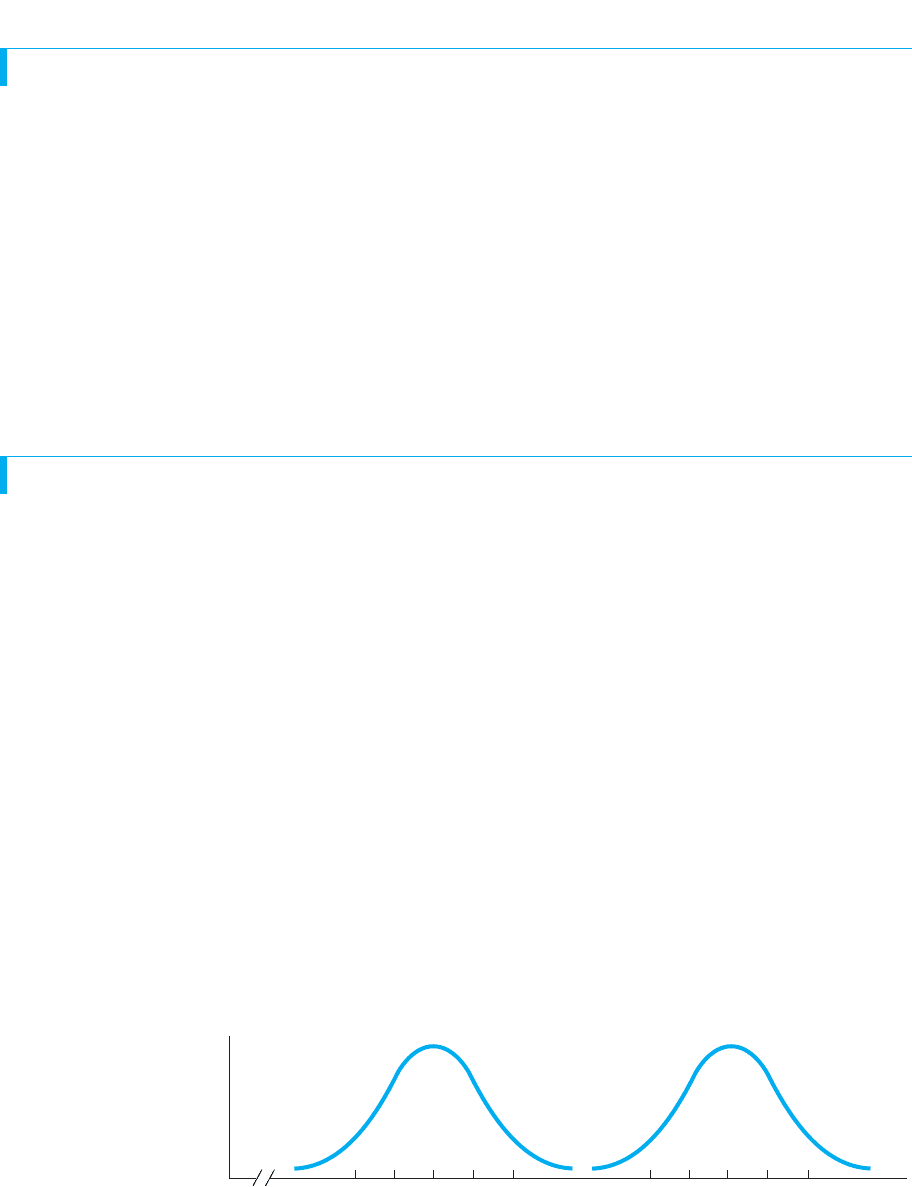
The left-hand distribution in Figure 4.2 shows that the mode does summarize these data
because most of the scores are “around” 4. Also, notice that the scores form a roughly
normal curve, with the highest point at the mode. When a polygon has one hump, such
as on the normal curve, the distribution is called unimodal, indicating that one score
qualifies as the mode.
Data may not always produce a single mode. For example, consider the scores 2, 3,
4, 5, 5, 5, 6, 7, 8, 9, 9, 9, 10, 11, and 12. Here two scores, 5 and 9, are tied for the most
frequently occurring score. This sample is plotted on the right in Figure 4.2. In Chapter
3, such a distribution was called bimodal because it has two modes. Describing this
distribution as bimodal and identifying the two modes does summarize where most of
the scores tend to be located—most are either around 5 or around 9.
Uses of the Mode
The mode is typically used to describe central tendency when the scores reflect a nom-
inal scale of measurement (when participants are categorized using a qualitative vari-
able). For example, say that we asked some people their favorite flavor of ice cream.
The way to summarize such data would be to indicate the most frequently occurring
category: Reporting that the mode was a preference for “Goopy Chocolate” is very in-
formative. Also, you have the option of reporting the mode along with other measures
of central tendency when describing other scales of measurement because it’s always
informative to know the “modal score.”
REMEMBER The mode is the most frequently occurring score in the data and
is usually used to summarize nominal scores.
There are, however, two potential limitations with the mode. First, the distribution
may contain many scores that are all tied at the same highest frequency. With more than
two modes, we fail to summarize the data. In the most extreme case, we might obtain a
rectangular distribution such as 4, 4, 5, 5, 6, 6, 7, and 7. Here there is no mode. A sec-
ond problem is that the mode does not take into account any scores other than the most
frequent score(s), so it may not accurately summarize where most scores in the distri-
bution are located. For example, say that we obtain the skewed distribution containing
7, 7, 7, 20, 20, 21, 22, 22, 23, and 24. The mode is 7, but this is misleading. Most of the
scores are not around 7 and instead are up in the low 20s.
Because of these limitations, we usually rely on one of the other measures of central
tendency when we have ordinal, interval, or ratio scores.
THE MEDIAN
Often a better measure of central tendency is the median. The median is simply another
name for the score at the 50th percentile. Recall that 50% of a distribution is at or
below the score at the 50th percentile. Thus, if the median is 10, then 50% of the scores
The Median 63
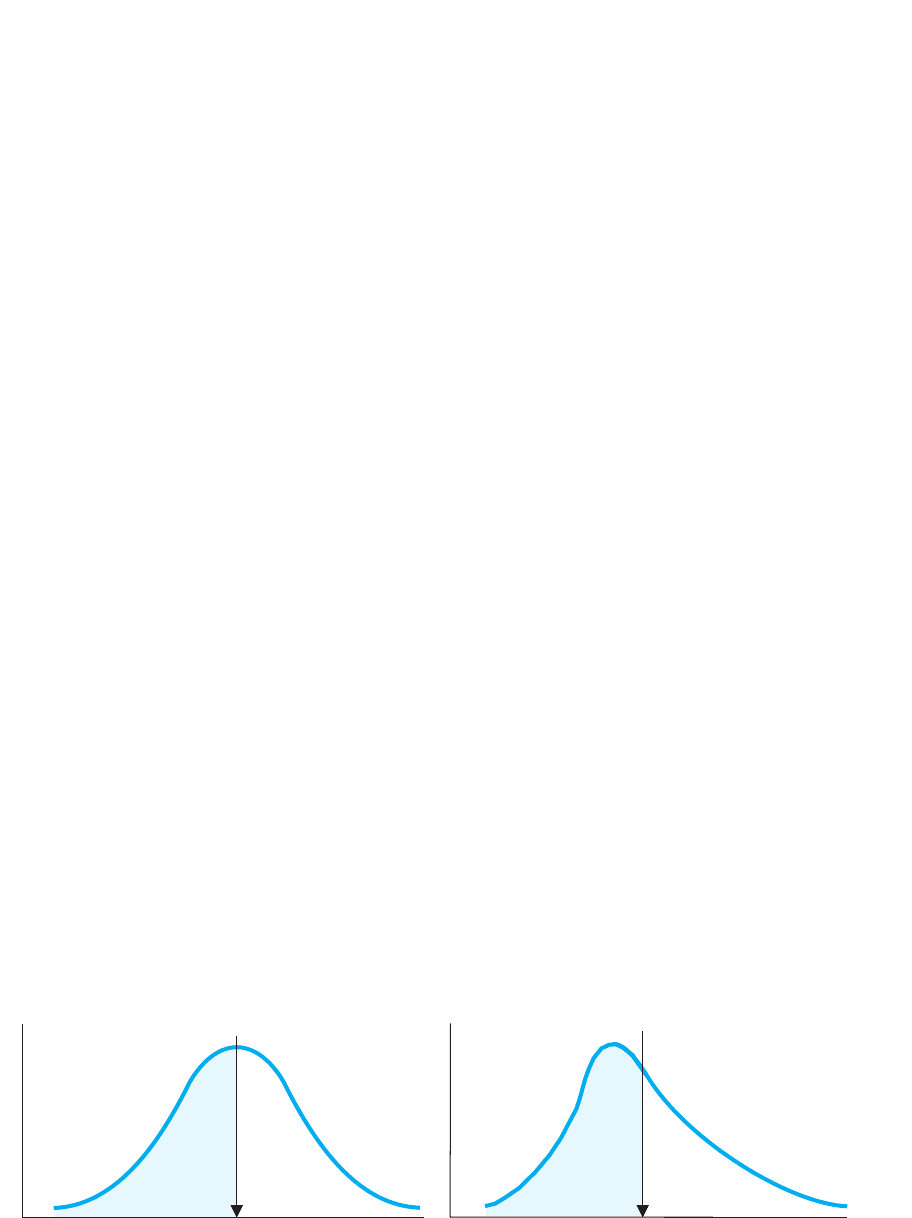
FIGURE 4.2
(a) A unimodal distribution and (b) a bimodal distribution
Each vertical line marks a highest point on the distribution. This indicates a most frequent score, which is a mode.
0
5
4
3
2
1
f
Test scores
1234567
0
5
4
3
2
1
f
Test scores
1234567 1312118910
(a)
(b)
64 CHAPTER 4 / Measures of Central Tendency: The Mean, Median, and Mode
are either at or below 10. (Note that the median will not always be one of the scores
that occurred.) The median is typically a better measure of central tendency than the
mode because (1) only one score can be the median and (2) the median will usually be
around where most of the scores in the distribution tend to be located. The symbol for
the median is usually its abbreviation, Mdn.
As we discussed in the previous chapter, when researchers are dealing with a large
distribution they may ignore the relatively few scores at a percentile, so they may say
that 50% of the scores are below the median and 50% are above it. To visualize this, re-
call that a score’s percentile equals the proportion of the area under the curve that is to
the left of—below—the score. Therefore, the 50th percentile is the score that separates
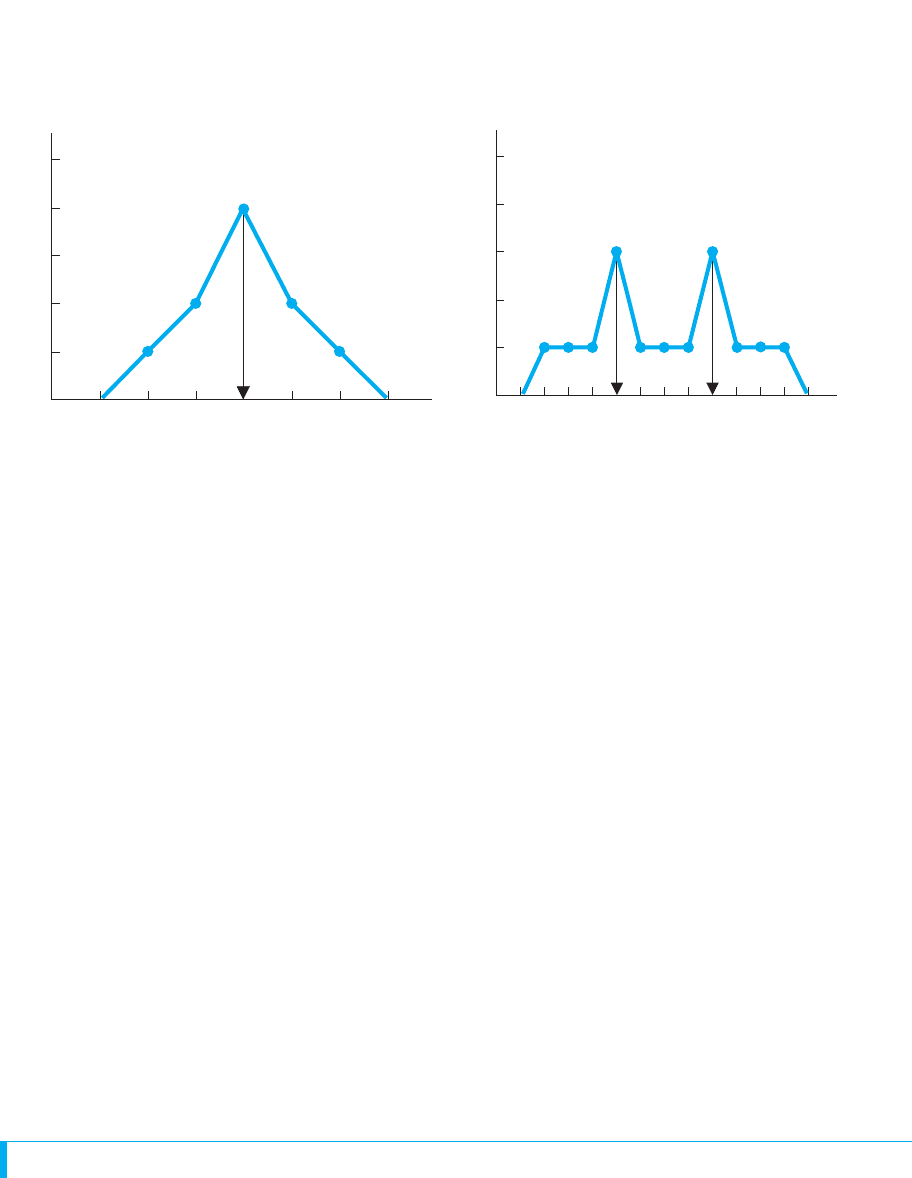
the lower 50% of the distribution from the upper 50%. For example, look at Graph A in
Figure 4.3. Because 50% of the area under the curve is to the left of the line, the score
at the line is the 50th percentile, so that score is the median.
In fact, the median is the score below which 50% of the area of any polygon is lo-
cated. For example, in the skewed distribution in Graph B of Figure 4.3, if .50 of the area
under the curve is to the left of the vertical line, then the score at the line is the median.
There are several ways to calculate the median. When scores form a perfect normal
distribution, the median is also the most frequent score, so it is the same score as the
mode. When scores are approximately normally distributed, the median will be close to
the mode.
When data are not at all normally distributed, however, there is no easy way to deter-
mine the point below which .50 of the area under the curve is located. Also, recall that
using the area under the curve is not accurate with a small sample. In these situations,
we can estimate the median using the following system. Arrange the scores from low-
est to highest. With an odd number of scores, the score in the middle position is the ap-
proximate median. For example, for the nine scores 1, 2, 3, 3, 4, 7, 9, 10, and 11, the
score in the middle position is the fifth score, so the median is the score of 4. On the
other hand, if is an even number, the average of the two scores in the middle is the
approximate median. For example, for the ten scores 3, 8, 11, 11, 12, 13, 24, 35, 46,
and 48, the middle scores are at position 5 (the score of 12) and position 6 (the score of
13). The average of 12 and 13 is 12.5, so the median is approximately 12.5.
To precisely calculate the median, consult an advanced textbook for the formula, or
as in Appendix B.3, use the SPSS computer program, which is the easiest solution.
N
FIGURE 4.3
Location of the median in a normal distribution (A) and in a positively skewed distribution (B)
The vertical line indicates the location of the median, with one-half of the distribution on each side of it.
f
Median
f
Low . . . Middle . . . High
scores
Median
Low . . . Middle . . . High
scores
Graph A Graph B
Uses of the Median
The median is not used to describe nominal data: To say, for example, that 50% of our
participants preferred “Goopy Chocolate” or below is more confusing than informa-
tive. On the other hand, the median is the preferred measure of central tendency when
the data are ordinal scores. For example, say that a group of students ranked how well a
college professor teaches. Reporting that the professor’s median ranking was 3 com-
municates that 50% of the students rated the professor as number 1, 2, or 3. Also, as
you’ll see later, the median is preferred when interval or ratio scores form a very
skewed distribution. (Again you have the option of reporting the median with other
types of data when appropriate, simply because it is informative.)
REMEMBER The median (Mdn) is the score at the 50th percentile and is used
to summarize ordinal or highly skewed interval or ratio scores.
Computing the median still ignores some information in the data because it reflects
only the frequency of scores in the lower 50% of the distribution, without considering
their mathematical values or considering the scores in the upper 50%. Therefore, the
median is not our first choice for describing the central tendency of normal distribu-
tions of interval or ratio scores.
The Mean 65
A QUICK REVIEW
■
The mode is the most frequent score in the data.
■
The median is the score at the 50th percentile. If
is an odd number, the median is the middle score. If
is even, the median is the average of the middle
scores.
MORE EXAMPLES
For the scores 1, 4, 2, 3, 5, and 3, the mode is 3. The
median is found in two steps. First, order the scores:
1, 2, 3, 3, 4, and 5. Then, is even, so the median is
the average of the scores in the third and fourth posi-
tions: The average of 3 and 3 is 3. However, for the
scores 3, 4, 7, 9, and 10, , so the median is at the
middle position, which is 7.
N 5 5
N
N
N
For Practice
1. What is the mode in 4, 6, 8, 6, 3, 6, 8, 7, 9, and 8?
2. What is the median in the above scores?
3. With what types of scores is the mode most
appropriate?
4. With what types of scores is the median most
appropriate?
Answers
1. In this bimodal data, both 6 and 8 are modes.
2. ; the median is the average of 6 and 7,
which is 6.50.
3. With nominal scores
4. With ordinal or skewed interval/ratio scores
N 5 10
THE MEAN
By far the all-time most common measure of central tendency in behavioral research is
the mean. The mean is the score located at the mathematical center of a distribution.
Although technically we call this statistic the arithmetic mean, it is what most people
call the average. Compute a mean in the same way that you compute an average: Add
up all the scores and then divide by the number of scores you added. Unlike the mode
66 CHAPTER 4 / Measures of Central Tendency: The Mean, Median, and Mode
or the median, the mean includes every score, so it does not ignore any information in
the data.
Let’s first compute the mean in a sample. Usually, we use to stand for the raw
scores in a sample and then the symbol for a sample mean is . It is pronounced “the
sample mean” (not “bar ”: bar sounds like the name of a ranch!). Get in the habit of
thinking of as a quantity itself so that you understand statements such as “the size of
” or “this is larger than that .”
To compute , recall that the symbol for “add up all the scores” is and that the
symbol for the number of scores is . ThenN
ΣXX
XXX
X
XX
X
X
The formula for computing a sample mean is
X 5
ΣX
N
As an example, consider the scores 3, 4, 6, and 7. Adding the scores together produces
, and is 4. Thus, . Saying that the mean of these scores is 5
indicates that the mathematical center of this distribution is located at the score of 5.
(As here, the mean may be a score that does not actually occur in the data.)
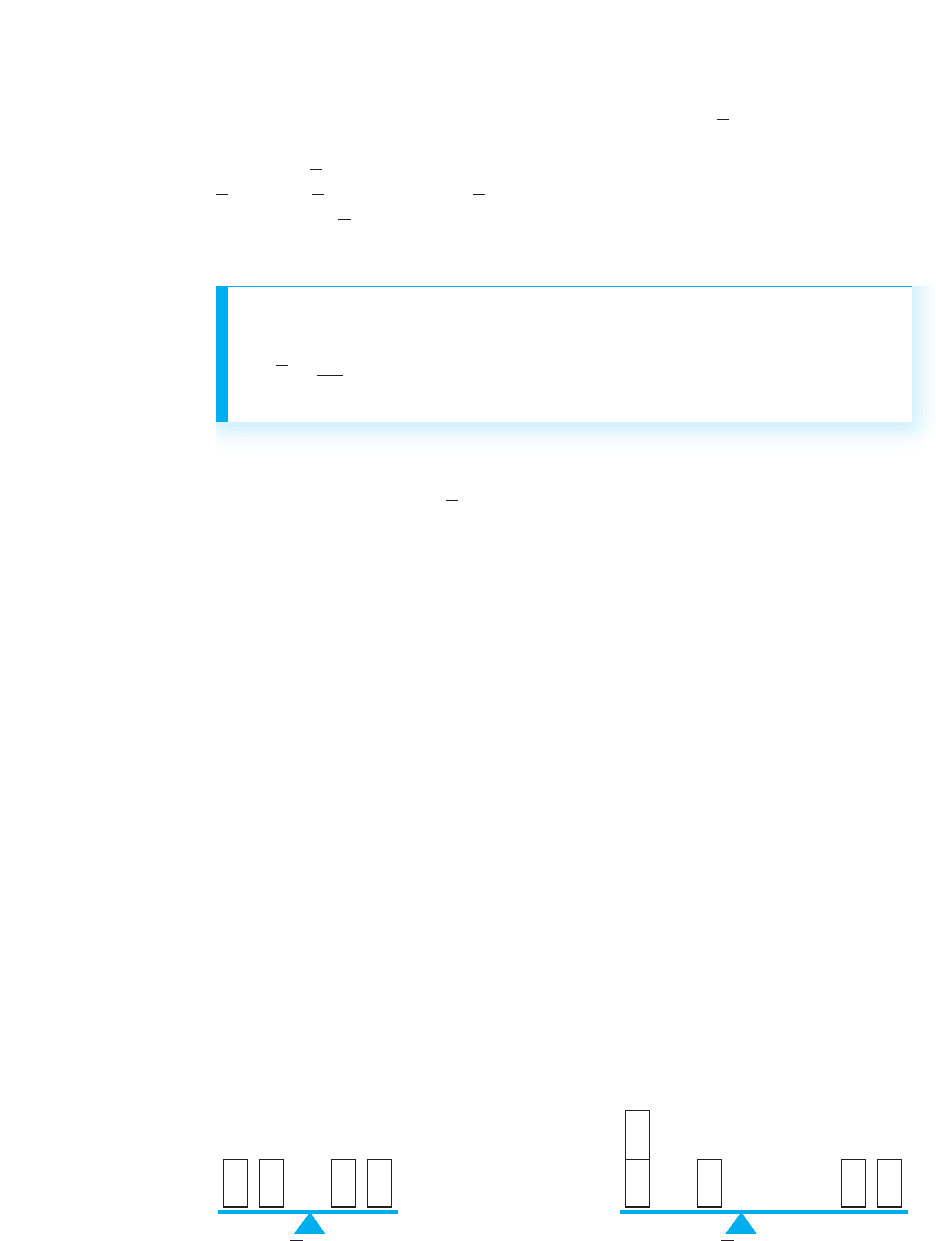
What is the mathematical center of a distribution? Think of the center as the balance
point. Thus, visualize a teeter-totter on a playground. The left-hand side of Figure 4.4
shows 3, 4, 6, and 7 sitting on the teeter-totter, and the mean of 5 balances the distribu-
tion. The right-hand side of Figure 4.4 shows how the mean is the balance point even
when the distribution is not symmetrical (the score of 1 has an f of 2). Here the mean is
4 (because ), and it balances the distribution.
Uses of the Mean
Computing the mean is appropriate whenever getting the “average” of the scores makes
sense. Therefore, do not use the mean when describing nominal data. (For example, if
we count the number of males versus females, an average of the genders would be
meaningless.) Likewise, do not compute the mean with ordinal scores (it is strange to
say that, on average, runners came in 5.7th in a race). This leaves the mean to describe
interval or ratio data.
In addition, however, also consider the shape of the distribution. The mathematical
center of the distribution must also be the point where most of the scores are located.
This will be the case when we have a symmetrical and unimodal distribution.
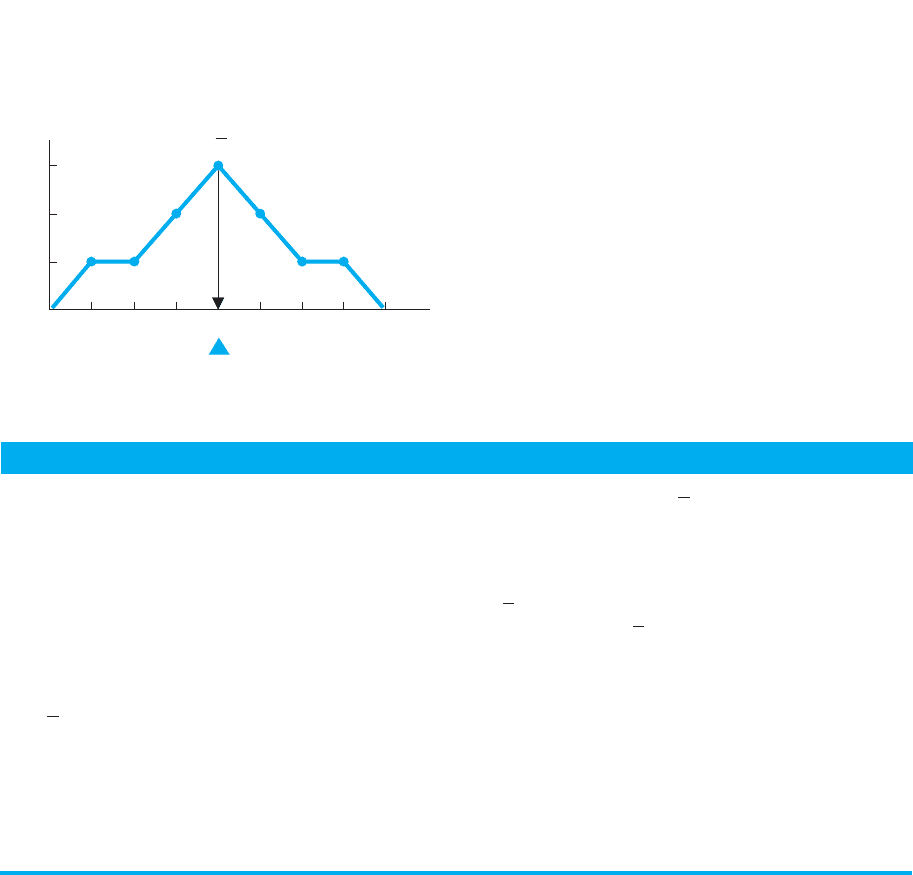
For example, say that a simple creativity test produced the scores of 5, 6, 2, 1, 3, 4, 5,
4, 3, 7, and 4, which are shown in Figure 4.5. Here, and , so the meanN 5 11ΣX 5 44
ΣX>N 5 20>5 5 4
X
5 20>4 5 5NΣX 5 20
FIGURE 4.4
The mean as the balance
point of a distribution
3
X = 5
467
X
13 78
1
= 4
score is 4. Computing the mean is appropriate here be-
cause it is the point around which most of the scores are
located: Most often the scores are at or near 4.
Notice that Figure 4.5 shows an approximately normal
distribution. Always compute the mean to summarize a
normal or approximately normal distribution: The mean
is the mathematical center of any distribution, and in a
normal distribution, most of the scores are located around
this central point. Therefore, the mean is an accurate sum-
mary and provides an accurate address for the distribution.
REMEMBER Describe the central tendency of a
normal distribution of interval or ratio scores by
computing the mean.
The Mean 67
FIGURE 4.5
Location of the mean on a symmetrical distribution.
The vertical line indicates the location of the mean score.
A QUICK REVIEW
■
The mean is the average score, located at the mathe-
matical center of the distribution.
■
The mean is appropriate for a symmetrical distribu-
tion of interval or ratio scores.
MORE EXAMPLES
To find the mean of the scores 3, 4, 6, 8, 7, 3, and 5:
, and .
Then ; this rounds to 5.14.
For Practice
1. What is the symbol for the sample mean?
2. What is the mean of 7, 6, 1, 4, 5, and 2?
X
5 36>7 5 5.1428
N 5 7ΣX 5 3 1 4 1 6 1 8 1 7 1 3 1 5 5 36
3. With what data is the appropriate?
4. How is a mean interpreted?
Answers
1.
2. , , , rounding to 4.17.
3. With normally distributed or symmetrical distributions
of interval or ratio scores
4. It is the center or balance point of the distribution.
X
5 4.1666N 5 6ΣX 5 25
X
X
0
3
2
1
f
Creativity scores
X
123 54678
Comparing the Mean, Median, and Mode
In a perfect normal distribution, all three measures of central tendency are located at
the same score. For example, above in Figure 4.5 the mean of 4 also splits the curve in
half, so 4 is the median. Also, the mean of 4 has the highest frequency, so 4 is the mode.
If a distribution is only roughly normal, then the mean, median, and mode will be close
to the same score. In this case, you might think that any measure of central tendency
would be good enough. Not true! The mean uses all information in the scores, and most
of the inferential procedures we’ll see involve the mean. Therefore, the rule is that the
mean is the preferred statistic to use with interval or ratio data unless it clearly provides
an inaccurate summary of the distribution.
The mean will inaccurately describe a skewed (nonsymmetrical) distribution. You
have seen this happen if you’ve ever obtained one low grade in a class after receiving
many high grades—your average drops like a rock. The low score produces a negatively