Heiman G. Basic Statistics for the Behavioral Sciences
Подождите немного. Документ загружается.


28 CHAPTER 2 / Statistics and the Research Process
In our studying example, we’d have an ordinal scale if we assigned a 1 to students who
scored best on the test, a 2 to those in second place, and so on. Then we’d ask, “As
study times change, do students’ ranks also tend to change?” Or, if an experiment com-
pares the conditions of first graders to second graders, then this independent variable
involves an ordinal scale. The key here is that ordinal scores indicate only a relative
amount—identifying who scored relatively high or low. Also, there is no zero in ranks,
and the same amount does not separate every pair of adjacent scores: 1st may be only
slightly ahead of 2nd, but 2nd may be miles ahead of 3rd.
A third approach is to use an interval scale. Here each score indicates an actual
quantity, and an equal amount separates any adjacent scores. (For interval scores, re-
member equal intervals between them.) However, although interval scales do include
the number 0, it is not a true zero—it does not mean none of the variable is present.
Therefore, the key here is that you can have less than zero, so an interval scale allows
negative numbers. For example, temperature (in Celsius or Fahrenheit) involves an in-
terval scale: Because 0° does not mean that zero heat is present, you can have even less
heat at 1°. In research, interval scales are common with intelligence or personality
tests: A score of zero does not mean zero intelligence or zero personality. Or, in our
studying research we might determine the average test score and then assign students a
zero if they are average, a ⫹1, ⫹2, and so on, for the amount they are above average,
and a ⫺1, ⫺2, and so on, for the amount they are below average. Then we’d see if more
positive scores tend to occur with higher study times. Or, if we create conditions based
on whether participants are in a positive, negative, or neutral mood, then this indepen-
dent variable reflects an interval scale.
Notice that with an interval scale, it is incorrect to make “ratio” statements that com-
pare one score to another score. For example, at first glance it seems that 4°C is twice as
warm as 2°C. However, if we measure the same physical temperatures using the Fahren-
heit scale, we would have about 35° and 39°, respectively. Now one temperature is not
twice that of the other. Essentially, if we don’t know the true amount of a variable that is
present at 0, then we don’t know the true amount that is present at any other score.
Only with our final scale of measurement, a ratio scale, do the scores reflect the true
amount of the variable that is present. Here the scores measure an actual amount, there
is an equal unit of measurement, and 0 truly means that none of the variable is present.
The key here is that you cannot have negative numbers because you cannot have less
than nothing. Also, only with ratio scores can we make “ratio” statements, such as “4 is
twice as much as 2.” (So for ratio, think ratio!) We used ratio scales in our previous
examples when measuring the number of errors and the number of hours studied. Like-
wise, in an experiment, if we compare the conditions of having people on diets consist-
ing of either 1000, 1500, or 2000 calories a day, then this independent variable involves
a ratio scale.
We can study relationships that involve any combination of the above scales.
REMEMBER The scale of measurement reflected by scores may be nominal,
ordinal, interval, or ratio.
Continuous versus Discrete Scales
A measurement scale may be either continuous or discrete. A continuous scale allows
for fractional amounts; it “continues” between the whole-number amounts, so decimals
make sense. The variable of age is continuous because someone can be 19.6879 years
old. On the other hand, some variables involve a discrete scale, which are measured
only in whole amounts. Here, decimals do not make sense. For example, whether you
2

The Characteristics of Scores 29
are male or female or in first or second grade are discrete variables because you can be
in one group or the other, but not in-between. (Some variables may seem to involve
fractions—such as shoe size—but they are still discrete variables, because smaller divi-
sions are not possible and, again, there is no in between.)
Note: when a discrete variable has only two possible categories or scores, it is called
a dichotomous variable. Male/female or living/dead are dichotomous variables.
Usually researchers assume that nominal or ordinal variables are discrete and that
interval or ratio variables are at least theoretically continuous. For example, in-
telligence tests are designed to produce whole-number scores. But, theoretically, an
IQ of 95.6 makes sense, so intelligence is a theoretically continuous (interval) vari-
able. Likewise, it sounds strange if the government reports that the average family
has 2.4 children because no one has .4 of a child. However, it makes sense to treat
this ratio variable as if it is continuous, because we can interpret what it means if
this year the average is 2.4 children, but last year the average was 2.8. (I’ve heard that
a recent survey showed the average American home contains 2.5 people and 2.7
televisions!)
REMEMBER Whether a variable is continuous or discrete and whether it is
measured using a nominal, ordinal, interval, or ratio scale are factors that de-
termine which statistical procedure to apply.
To help you remember the four scales of measurement, Table 2.6 summarizes their
characteristics.
Type of Measurement Scale
Nominal Ordinal Interval Ratio
Quality Relative Quantity Quantity
quantity
No No Yes Yes
No No No Yes
To identify To judge who is To convey the To count the
males and 1st, 2nd, etc., in results of number of
females as 1 aggressiveness intelligence and correct answers
and 2 personality tests on a test
Telephone Letter grades Checkbook balance Weight
numbers
Elementary Individual’s Distance
Social Security school grade standing relative traveled
numbers to class average
TABLE 2.6
Summary of Types of
Measurement Scales
Each column describes the
characteristics of the scale.
What Does the
Scale Indicate?
Is There an
Equal Unit of
Measurement?
Is There a True
Zero?
How Might the
Scale be Used
in Reasearch?
Additional
Examples
■
Nominal scales identify categories and ordinal
scales reflect rank order. Both interval and ratio
scales measure actual quantities, but negative
numbers can occur with interval scales and not
with ratio scales.
■
Interval and ratio scales are assumed to be continu-
ous scales, which allow fractional amounts; nominal
and ordinal scales are assumed to be discrete scales,
which do not allow fractional amounts.
continued
A QUICK REVIEW

30 CHAPTER 2 / Statistics and the Research Process
STATISTICS IN PUBLISHED RESEARCH: USING STATISTICAL TERMS
You have already begun to learn the secret language found in published research.
You’ll frequently encounter such terms as relationship, independent and dependent
variable, condition, or statistic. Also, that phrase “as a function of” is common. Often
it is in the title of a graph, so seeing “Agility as a Function of Age” indicates that the
graph shows the relationship between scores that measure participants’ ages and
Y scores that measure agility. The phrase is also used in the title of reports. For exam-
ple, “Anxiety When Dating as a Function of Introversion Level” indicates that the
researcher wondered if people are more or less anxious about going on a date, depend-
ing on the particular (given) amount of introversion that they exhibit.
The reason that published research seems to involve a secret language is because many
details are left out. Implicitly it is assumed that the reader of a report (you) has taken a
statistics course and so understands the terminology of statistics and research. This means
that most of the terms that we’ll discuss are seldom defined in published reports. There-
fore, for you to understand research and apply statistical procedures (let alone understand
this book), these terms need to become part of your everyday vocabulary.
X
As you proceed through this course, however, don’t let the terminology and details ob-
scure your ultimate purpose. Keep things in perspective by remembering the overall
logic of research, which can be summarized by the following five steps:
1. Based on a hypothesized law of nature, we design either an experiment or a corre-
lational study to measure variables and to observe the predicted relationship in the
sample.
2. We use descriptive statistics to understand the scores and the relationship in the
sample.
3. We use inferential procedures to decide whether the sample accurately represents
the scores and relationship that we would find if we could study everyone in the
population.
PUTTING IT
ALL TOGETHER
MORE EXAMPLES
If your grade on an essay exam is based on the num-
ber of correct statements you include, then a ratio
scale is involved; if it is based on how much your
essay is better or worse than what the professor
expected, an interval scale is involved; if it indicates
that yours was relatively one of the best or worst
essays in the class, this is an ordinal scale (as is
pass/fail, which is dichotomous); if it is based on the
last digit of your ID number, then a nominal scale is
involved. If you can receive one grade or another, but
nothing in between, it involves a discrete scale; if frac-
tions are possible, it involves a continuous scale.
For Practice
1. Whether you are ahead or behind when gambling
involves a _____ scale.
2. The number of hours you slept last night involves
a _____ scale.
3. Your blood type involves a _____ scale.
4. Whether you are a lieutenant or major in the army
involves a _____ scale.
5. A _____ scale allows fractions; a _____ scale
allows only whole amounts.
Answers
1. interval 4. ordinal
2. ratio 5. continuous; discrete
3. nominal

Chapter Summary 31
4. By describing the scores and relationship that would be found in the population,
we are actually describing the behavior of everyone in a particular group in a par-
ticular situation.
5. By describing the behavior of everyone in a particular situation, we are describing
how a law of nature operates.
CHAPTER SUMMARY
1. The group of all individuals to which research applies is the population. The
subset of the population that is actually measured is the sample.
2. Usually, participants are selected using random sampling so that all scores in the
population have the same chance of being selected. The sample should be
representative. By chance, however, a sample may be unrepresentative.
3. A variable is anything that, when measured, can produce two or more different
scores. Variables may be quantitative, measuring a quantity or amount, or
qualitative, measuring a quality or category.
4. A relationship occurs when a change in scores on one variable is associated with a
consistent change in scores on another variable.
5. The term individual differences refers to the fact that no two individuals are identical.
6. Because of individual differences and external influences, relationships can have
varying strengths.
7. The “given” variable in any relationship is designated the variable, and we describe
a relationship using the format “changes in as a function of changes in .”
8. Descriptive statistics are used to organize, summarize, and describe sample data,
and to predict an individual’s score using the relationship with . Inferential
statistics are for deciding whether the sample data actually represent the relation-
ship that occurs in the population.
9. A statistic is a number that describes a characteristic of a sample of scores, sym-
bolized using a letter from the English alphabet. A statistic is used to infer or
estimate the corresponding parameter. A parameter is a number that describes a
characteristic of a population of scores, symbolized using a letter from the
Greek alphabet.
10. A study’s design is the particular way in which the study is laid out.
11. In an experiment, we manipulate the independent variable and then measure
participants’ scores on the dependent variable. A specific amount or category of
the independent variable is called a condition, treatment, or level.
12. In a correlational study, neither variable is actively manipulated. Scores on both
variables are simply measured and then the relationship is described.
13. In any type of research, if a relationship is observed, it may or may not mean that
changes in one variable cause the other variable to change.
XY
XY
X

32 CHAPTER 2 / Statistics and the Research Process
14. The four scales of measurement are (a) a nominal scale, in which numbers name
or identify a quality or characteristic; (b) an ordinal scale, in which numbers
indicate rank order; (c) an interval scale, in which numbers measure a specific
amount, but with no true zero; or (d) a ratio scale, in which numbers measure
a specific amount and 0 indicates truly zero amount.
15. A continuous variable can be measured in fractional amounts. A discrete variable
is measured only in whole amounts. A dichotomous variable is a discrete variable
that has only two amounts or categories.
KEY TERMS
as a function of 19
condition 23
continuous scale 28
correlational study 25
dependent variable 23
descriptive statistics 20
design 22
dichotomous variable 29
discrete scale 29
experiment 22
independent variable 22
individual differences 17
inferential statistics 21
interval scale 28
level 23
nominal scale 27
ordinal scale 27
parameter 22
participant 14
population 13
ratio scale 28
relationship 15
sample 13
statistic 21
strength of a relationship 17
treatment 23
variable 14
REVIEW QUESTIONS
(Answers for odd-numbered problems are in Appendix D.)
1. (a) What is a population? (b) What is a sample? (c) How are samples used to
make conclusions about populations? (d) What are researchers really referring to
when they talk about the population?
2. What do you see when (a) a relationship exists between two variables? (b) No
relationship is present?
3. What does the strength of a relationship refer to?
4. What pattern in the Y scores will produce a weaker relationship?
5. What are the two aspects of a study to consider when deciding on the particular
descriptive or inferential statistics that you should employ?
6. What is the difference between an experiment and a correlational study?
7. What is the difference between the independent variable and the conditions of the
independent variable?
8. In an experiment, what is the dependent variable?
9. What is the general purpose of all research, whether experiments or correlational
studies?
10. (a) What are descriptive statistics used for? (b) What are inferential statistics used
for?
11. (a) What is the difference between a statistic and a parameter? (b) What types of
symbols are used for statistics and parameters?

Application Questions 33
12. (a) Define the four scales of measurement. (b) What are continuous and discrete
variables? (c) Which scales of measurement are usually assumed to be discrete
and which are assumed to be continuous?
APPLICATION QUESTIONS
13. A student named Foofy (who you’ll be taking statistics with) conducted a survey.
In her sample, 83% of mothers employed outside the home would rather be home
raising children. She concluded that “the statistical analyses prove that most
working women would rather be at home.” What is the problem with this conclu-
sion?
14. In study A, a researcher gives participants various amounts of alcohol and then
observes any decrease in their ability to walk. In study B, a researcher notes the
various amounts of alcohol that participants drink at a party and then observes any
decrease in their ability to walk. (a) Which study is an experiment, and which is a
correlational study? Why? (b) Which study will be best for showing that drinking
alcohol causes an impairment in walking? Why?
15. Another student in your class, Poindexter, conducted a survey of college students
about their favorite beverage. Based on what the sample said, he concluded that
most college students prefer carrot juice to other beverages! What statistical argu-
ment can you give for not accepting this conclusion?
16. In each of the following experiments, identify the independent variable, the condi-
tions of the independent variable, and the dependent variable: (a) Studying
whether scores on a final exam are influenced by background music that is soft,
loud, or absent. (b) Comparing freshmen, sophomores, juniors, and seniors with
respect to how much fun they have while attending college. (c) Studying whether
being first born, second born, or third born is related to intelligence. (d)
Examining whether length of daily exposure to a sun lamp (15 minutes versus
60 minutes) alters self-reported depression. (e) Studying whether being in a room
with blue walls, green walls, red walls, or beige walls influences the number of
aggressive acts produced by adolescents.
17. List the scales of measurement, starting with the scale that provides the most pre-
cise information about the amount of a variable present and ending with the scale
that provides the least precise information.
18. Using the terms sample, population, variable, statistics, and parameter,
summarize the steps a researcher follows, starting with a hypothesis and
ending with a conclusion about a nature.
19. For the following data sets, which show a relationship?
Sample A Sample B Sample C Sample D
XY XY XY XY
110 2040 1320 9271
110 2042 1319 9377
110 2240 1318 9377
220 2241 1317 9575
220 2340 1315 9674
330 2440 1314 9773
330 2442 1313 9871
34 CHAPTER 2 / Statistics and the Research Process
20. Which sample in question 19 shows the strongest relationship? How do you
know?
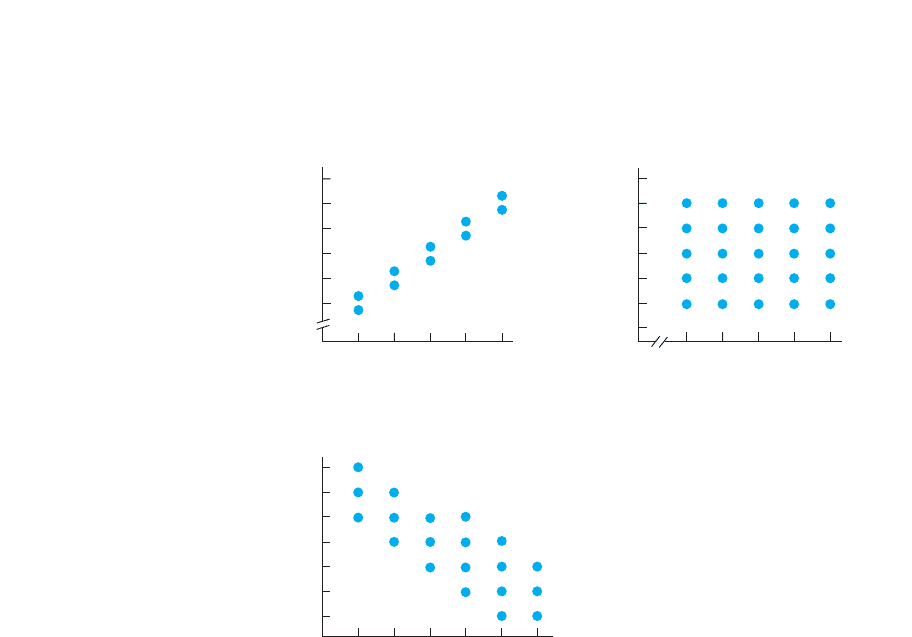
21. Which of the graphs below depict a relationship? How do you know?
15 20
Age scores
Weight scores
150
140
130
120
10
160
170
25
80 100 110
IQ scores
Age scores
40
30
20
10
90
50
60
120
70
7
Shoe size
Speed scores
20
15
10
8
25
30
35
Study A
Study B
Study C
5
5
0
9
0
0
10 11 12
22. Which study in question 21 demonstrates the strongest relationship? How do you
know?
23. In question 21, why is each relationship a telltale sign that a law of nature is at
work?
24. (a) Poindexter says that Study A in problem 21 examines age scores as a function
of weight scores. Is he correct? (b) He also claims that in Study C the researcher
is asking, “For a given shoe size, what speed scores occur?” Is he correct?
(c) If the studies in question 21 were conducted as experiments, in each, which
variable is the independent variable and which is the dependent variable?

Application Questions 35
25. Complete the chart below to identify the characteristics of each variable.
Qualitative Continuous, Type of
or Discrete, or Measurement
Variable Quantitative Dichotomous Scale
Gender ________ ________ ________
Academic major ________ ________ ________
Number of minutes before ________ ________ ________
and after an event
Restaurant ratings ________ ________ ________
(best, next best, etc.)
Speed (miles per hr) ________ ________ ________
Dollars in your pocket ________ ________ ________
Change in weight (in lb) ________ ________ ________
Checking account balance ________ ________ ________
Reaction time ________ ________ ________
Letter grades ________ ________ ________
Clothing size ________ ________ ________
Registered voter ________ ________ ________
Therapeutic approach ________ ________ ________
Schizophrenia type ________ ________ ________
Work absences ________ ________ ________
Words recalled ________ ________ ________

36
So, we’re off into the wonderful world of descriptive statistics. Recall that descriptive
statistics tell us the obvious things we would ask about the relationship and scores in a
sample. Before we examine the relationship between two variables, however, we first
summarize the scores from each variable alone. Then, two important things that we
always wish to know are: Which scores occurred, and how often did each occur? The
way to answer this is to organize the scores into tables and graphs based on what are
called frequency distributions. In this chapter, you’ll see how to create various kinds of
frequency distributions and how to use a frequency distribution to derive additional in-
formation about the scores.
Before we get to that, however, here are some terms and symbols you’ll encounter in
this chapter.
NEW STATISTICAL NOTATION
The scores we initially measure in a study are called the raw scores. Descriptive statistics
help us to “boil down” the raw scores into an interpretable, “digestible” form. There are
several ways to do this, but the starting point is to count the number of times each score
occurred. The number of times a score occurs is the score’s frequency, symbolized by
the lowercase f. (Always pay attention to whether a symbol is upper- or lowercase.) If we
count the frequency of every score in the data, we create a frequency distribution. A
distribution is the general name that researchers have for any organized set of data. As
you’ll see, there are several ways to create a frequency distribution, so we will combine
the term frequency (and f ) with other terms and symbols.
Frequency Distributions
and Percentiles
3
GETTING STARTED
To understand this chapter, recall the following:
■
From Chapter 1, how to calculate proportions and percents.
■
From Chapter 2, the four types of measurement scales.
Your goals in this chapter are to learn
■
What simple frequency, relative frequency, cumulative frequency,
and percentile are.
■
How bar graphs, histograms, and polygons are created.
■
What normal, skewed, bimodal, and rectangular distributions are and how to
interpret them.
■
How relative frequency and percentile are obtained using the area under the
normal curve.

Simple Frequency Distributions 37
In most statistical procedures, we also count the total number of scores. The sym-
bol for the total number of scores in a set of data is the uppercase . An of 10 means
we have 10 scores, or means we have 43 scores. Note that is not the number
of different scores, so even if all 43 scores in a sample are the same score, still
equals 43.
REMEMBER The frequency of a score is symbolized by . The total number
of scores in the data is symbolized by .
WHY IS IT IMPORTANT TO KNOW ABOUT FREQUENCY DISTRIBUTIONS?
Presenting data in a graph or table is important for two reasons. First, it answers our
question about the different scores that occurred in our data and it does this in an
organized manner. You’ll also see that we have names for some commonly occurring
distributions so that we can easily communicate and envision a picture of even very
large sets of data. Therefore, always create a table or graph of your data. As the saying
goes, “A picture is worth a thousand words,” and nowhere is this more appropriate than
when trying to make sense out of data. Second, the procedures discussed here are im-
portant because they are the building blocks for other descriptive and inferential statis-
tics. (You will be using what you learn here throughout the remainder of this book.)
As you’ll see, we can organize data in one of four ways: using each score’s simple
frequency, relative frequency, cumulative frequency, or percentile.
SIMPLE FREQUENCY DISTRIBUTIONS
The most common way to organize scores is to create a simple frequency distribution.
A simple frequency distribution shows the number of times each score occurs in a set
of data. The symbol for a score’s simple frequency is simply . To find for a score,
count how many times the score occurs. If three participants scored 6, then the
frequency of 6 (its f ) is 3. Creating a simple frequency distribution involves counting
the frequency of every score in the data. One way to see a distribution is in a table.
Presenting Simple Frequency in a Table
Let’s begin with the following raw scores. (They might measure a variable from a cor-
relational study, or they may be dependent scores from an experiment.)
14 14 13 15 11 15 13 10 12
13 14 13 14 15 17 14 14 15
In this disorganized arrangement, it is difficult to make sense out of these scores. See
what happens, though, when we arrange them into the simple frequency table shown in
Table 3.1.
We have several rules for making a frequency table. Start with a score column and an
column. The score column has the highest score in the data at the top of the column.
Below that are all possible whole-number scores in decreasing order, down to the lowest
score that occurred. Thus, the highest score is 17, the lowest score is 10, and although
no one obtained a score of 16, we still include it. Opposite each score in the column is
the score’s frequency: In this sample there is one 17, zero 16s, four 15s, and so on.
f
f
ff
N
f
N
NN 5 43
NN
Score
17 1
16 0
15 4
14 6
13 4
12 1
11 1
10 1
f
TABLE 3.1
Simple Frequency
Distribution Table
The left-hand column identi-
fies each score, and the right-
hand column contains the
frequency with which the
score occurred.