Heiman G. Basic Statistics for the Behavioral Sciences
Подождите немного. Документ загружается.

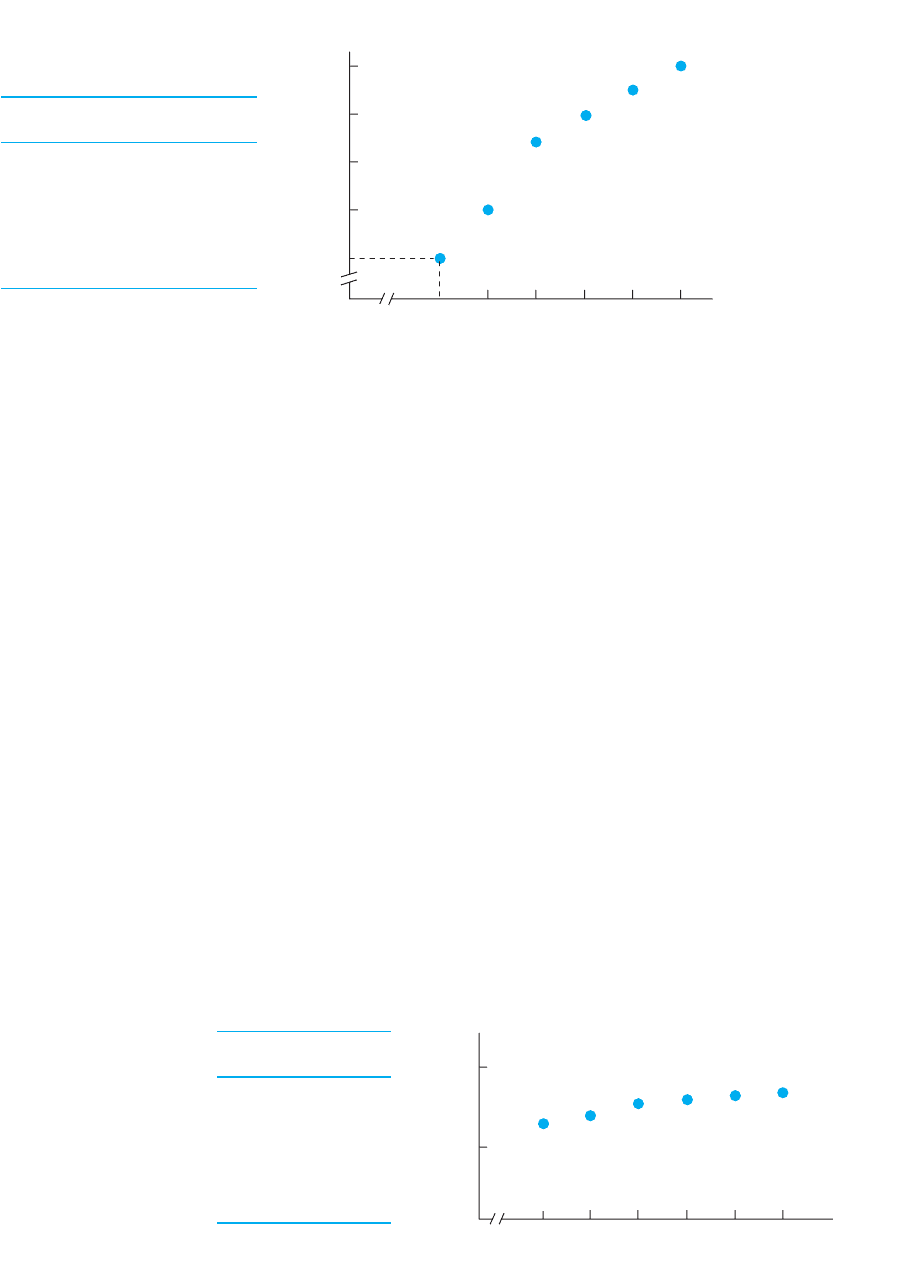
FIGURE 1.2
Plot of height and
weight scores using a
different scale on the
axisY
Height Weight
63 130
64 140
65 155
66 160
67 165
68 170
8 CHAPTER 1 / Introduction to Statistics
066
Height (in inches)
Weight (in pounds)
200
100
67 68656463
63 65 66 67 68
Height (in inches)
Weight (in pounds)
170
160
150
140
130 Jane
640
In the body of the graph we plot the scores from the table on the left. Jane is 63 inches
tall and weighs 130 pounds, so we place a dot above the height of 63 and opposite the
weight of 130. And so on. Each dot on the graph is called a data point. Notice that you
read the graph by using the scores on one axis and the data points. For example, to find
the weight of the person who has a height of 67, travel vertically from 67 to the data
point and then horizontally to the axis: 165 is the corresponding weight.
In later chapters you will learn when to connect the data points with lines and when
to create other types of figures. Regardless of the final form of a graph, always label
the and axes to indicate what the scores measure (not just and ), and always give
your graph a title indicating what it describes.
When creating a graph, make the spacing between the labels for the scores on an axis
reflect the spacing between the actual scores. In Figure 1.1 the labels 64, 65, and 66 are
equally spaced on the graph because the difference between 64 and 65 is the same as
the difference between 65 and 66. However, in other situations, the labels may not be
equally spaced. For example, the labels 10, 20, and 40 would not be equally spaced
because the distance between these scores is not equal.
Sometimes there are so many different scores that we cannot include a label for each
one. Be careful here, because the units used in labeling each axis then determine the
impression the graph gives. Say that for the previous weight scores, instead of labeling
the axis in units of 10 pounds, we labeled it in units of 100 pounds, as shown in
Figure 1.2. This graph shows the same data as Figure 1.1, but changing the scale on the
Y axis creates a much flatter pattern of data points. This gives the misleading impression
Y
YXYX
Y
FIGURE 1.1
Plot of height and weight scores
Person Height Weight
Jane 63 130
Bob 64 140
Mary 65 155
Tony 66 160
Sue 67 165
Mike 68 170

Chapter Summary 9
that regardless of their height, the people all have about the same weight. However, look-
ing at the actual scores, you see that this is not the case. Thus, always label the axes in a
way that honestly presents the data, without exaggerating or minimizing the pattern
formed by the data points.
That’s all the basic math you’ll need to get started. You are now ready to begin learning
to use statistics. In fact, you already use statistics. If you compute your grade average
or if you ask your instructor to “curve” your grades, you are using statistics. When you
understand from the nightly news that Senator Fluster is projected to win the election
or when you learn from a television commercial that Brand X “significantly” reduces
tooth decay, you are using statistics. You simply do not yet know the formal names for
these statistics or the logic behind them. But you will.
PUTTING IT ALL
TOGETHER
CHAPTER SUMMARY
1. All empirical research is based on observation and measurement, resulting in
numbers, or scores. These scores are the data.
2. Statistical procedures are used to make sense out of data: They are used to
organize, summarize, and communicate data and to draw conclusions about
what the data indicate.
3. The goal in learning statistics is to know when to perform a particular procedure
and how to interpret the answer.
4 Statistical notation refers to the standardized code for symbolizing the
mathematical operations performed in the formulas and the answers obtained.
5. Unless otherwise indicated, the order of mathematical operations is to compute
inside parentheses first, then square or find square roots, then multiply or divide,
and then add or subtract.
6. Round off the final answer in a calculation to two more decimal places than are in
the original scores. If the digit in the next decimal place is equal to or greater than
5, round up; if the digit is less than 5, round down.
7.A transformation is a procedure for systematically converting one set of scores
into a different set of scores. Transformations make scores easier to work with
and make different kinds of scores comparable.
8.A proportion is a decimal between 0 and 1 that indicates a fraction of the total. To
transform a score to a proportion, divide the score by the total. To determine the
score that produces a particular proportion, multiply the proportion times the total.
9. To transform a proportion to a percent, multiply the proportion times 100. To
transform an original score to a percent, find the proportion by dividing the score
by the total and then multiplying by 100.
10. To transform a percent to a proportion, divide the percent by 100. To find the
original score that corresponds to a particular percent, transform the percent to
a proportion and then multiply the proportion times the total.
11. A data point is a dot plotted on a graph to represent a pair of and scores.YX

10 CHAPTER 1 / Introduction to Statistics
KEY TERMS
data 1
data point 8
percent 7
proportion 7
statistical notation 4
transformation 6
REVIEW QUESTIONS
(Answers for odd-numbered problems are in Appendix D.)
1. Why do researchers need to learn statistics?
2. What does the term statistical notation refer to?
3. (a) To how many places should you round a final answer? (b) If you are rounding
to two decimal places, what are the rules for rounding up or down?
4. (a) What is a transformation? (b) Why do we transform data?
5. If given no other information, what is the order in which to perform mathematical
operations?
6. What is a percentage?
7. What is a data point?
8. A researcher measures the IQ scores of a group of college students. What four
things will the researcher use statistics for?
9. What is a proportion and how is it computed?
10. How do you transform a percentage to a proportion?
APPLICATION QUESTIONS
11. (a) What proportion is 5 out of 15? (b) What proportion of 50 is 10? (c) One in a
thousand equals what proportion?
12. For each of the following, to how many places will you round off your final
answer? (a) When measuring the number of questions students answered cor-
rectly on a test. (b) When measuring what proportion of the total possible points
students have earned in a course. (c) When counting the number of people having
various blood types. (d) When measuring the number of dollar bills possessed by
each person in a group.
13. Transform each answer in question 11 to a percent.
14. The intermediate answers from some calculations based on whole-number scores
are and . We now want to find After
rounding, what values of and do we use?
15. Round off the following numbers to two decimal places: (a) 13.7462, (b) 10.043,
(c) 10.047, (d) .079, and (e) 1.004.
16. For find the value of Q when and .
17. Using the formula in question 16, find when and .
18. For and , find :
19. Using the formula in question 18, find for and .
20. Of the 40 students in a gym class, 13 played volleyball, 12 ran track (4 of whom
did a push-up), and the remainder were absent. (a) What proportion of the class
Y 524X 5 9D
D 5 a
X 2 Y
Y
b12X2
DY 5 4.8X 5 14
Y 522X 5 8Q
Y 5 5X 5 3Q 5 1X 1 Y21X
2
1 Y
2
2
YX
X
2
1 Y
2
.Y 5 3.3333X 5 4.3467892

Application Questions 11
ran track? (b) What percentage played volleyball? (c) What percentage of the
runners did a push-up? (d) What proportion of the class was absent?
21. In your statistics course, there are three exams: I is worth 40 points, II is worth
35 points, and III is worth 60 points. Your professor defines a passing grade as
earning 60% of the points. (a) What is the smallest score you must obtain on each
exam to pass it? (b) In total you can earn 135 points in the course. How many
points must you earn from the three exams combined to pass the course? (c) You
actually earn a total of 115 points during the course. What percent of the total did
you earn?
22. There are 80 students enrolled in statistics. (a) You and 11 others earned the same
score. What percent of the class received your score? (b) Forty percent of the class
received a grade of C. How many students received a C? (c) Only 7.5% of the
class received a D. How many students is this? (d) A student claims that .5% of
the class failed. Why is this impossible?
23. (a) How do you space the labels on the or axis of a graph? (b) Why must you
be careful when selecting the amounts used as these labels?
24. Create a graph showing the data points for the following scores.
YX
X Score Y Score
20 10
25 30
35 20
45 60
25 55
40 70
45 30

12
Because statistics are part of the process of conducting research, to understand statis-
tics you need to first understand a little about research. Therefore, this chapter dis-
cusses the basics of behavioral research, the general ways that statistics are used in
research, and the major aspects of how we conduct a study that influence which statis-
tics are used.
THE LOGIC OF RESEARCH
Behavioral scientists study the “laws of nature” regarding the behavior of living organ-
isms. That is, researchers assume there are specific influences that govern every behavior
of all members of a particular group. Although any single study is a very small step in this
process, the goal is to understand every factor that influences behavior. Thus, when re-
searchers study such things as the mating behavior of sea lions, social interactions between
humans, or neural firing in a rat’s brain, they are ultimately studying the laws of nature.
The reason a study is a small step is because nature is very complex. Therefore,
research involves a series of translations in which we simplify things so that we can
examine a specific influence on a specific behavior in a specific situation. Then, using
our findings, we generalize back to the broader behaviors and laws we began with. For
example, here’s an idea for a simple study. Say that we think a law of nature is that
people must study information in order to learn it. We translate this into the more
Statistics and the
Research Process
2
GETTING STARTED
To understand this chapter, recall the following:
■
From Chapter 1, (1) that we use statistics to make sense out of data and
(2) how to create and interpret graphs.
Your goals in this chapter are to learn
■
The logic of samples and populations in behavioral research.
■
How to recognize a relationship between scores and what is meant by the
strength of a relationship.
■
What descriptive statistics are used for.
■
What inferential statistics are used for.
■
What the difference is between an experiment and a correlational study and
how to recognize the independent variable, the conditions, and the dependent
variable in an experiment.
■
What the four scales of measurement are.

The Logic of Research 13
specific hypothesis that “the more you study statistics, the better you’ll learn them.”
Next we will translate the hypothesis into a situation where we can observe and meas-
ure specific people who study specific material in different amounts, to see if they do
learn differently. Based on what we observe, we will have evidence for working back
to the general law regarding studying and learning.
Part of this translation process involves samples and populations.
Samples and Populations
When researchers want to talk of a behavior occurring in some group in nature, they
say it occurs in the population. A population is the entire group of individuals to which
a law of nature applies. The population might be broadly defined (such as all animals,
all mammals, or all humans), but it can be more narrowly defined (such as all women,
all four-year-old English-speaking children in Canada, or all presidents of the United
States). For our studying research, the population might be all college students taking
statistics. Notice that, although ultimately researchers discuss the population of indi-
viduals, we sometimes talk of the population of scores, as if we have already measured
the behavior of everyone in the population in a particular situation.
The population contains all past, present, and future members of the group, so we
usually consider it to be infinitely large. However, to measure an infinitely large popu-
lation would take roughly forever! Instead, we measure a sample from the population.
A sample is a relatively small subset of a population that is intended to represent, or
stand in for, the population. Thus, we might study the students in your statistics class
as a sample representing the population of all college students enrolled in statistics. The
individuals measured in a sample are called the participants (or sometimes, the sub-
jects) and it is the scores from the sample(s) that constitute our data. As with a popula-
tion, sometimes we discuss a sample of scores as if we have already measured the
participants in a particular situation.
Notice that the definitions of a sample and a population depend on your perspective.
Say that we study the students in your statistics class. If these are the only individuals
we are interested in, then we have measured the population of scores. Or if we are in-
terested in the population of all college students studying statistics, then we have a sam-
ple of scores that represent that population. But if we are interested in both the
populations of college men and college women who are studying statistics, then the
men in the class are one sample and the women in the class are another sample, and
each represents its respective population. Finally, scores from one student can be a
sample representing the population of all scores that the student might produce. Thus, a
population is any complete group of scores that would be found in a particular situa-
tion, and a sample is a subset of those scores that we actually measure in that situation.
The logic behind samples and populations is this: We use the scores in a sample to
infer—to estimate—the scores we would expect to find in the population, if we could
measure them. Then, by translating the scores back into the behaviors they reflect, we
can infer the behavior of the population. Thus, when the television news uses a survey
to predict who will win the presidential election, they are using the scores from a sam-
ple (usually containing about 1200 voters) to infer the voting behavior of the population
of over 100 million voters. Likewise, if we observe that greater studying leads to better
learning for a sample of statistics students, we will infer that similar scores and behav-
iors would be found in the population of all statistics students. Then, because the popu-
lation is the entire group to which the law of nature applies, we are describing how
nature works. Thus, whenever we say a finding applies to the population, we are really
describing how a law of nature applies to everyone out there in the world.

14 CHAPTER 2 / Statistics and the Research Process
REMEMBER The population is the entire group of individuals—and scores—
to which our conclusions apply, based on our observation of a sample, which
is a subset of the population.
Recognize that the above logic assumes that our sample is representative of the pop-
ulation. We will discuss this issue in detail in Chapter 9, but put simply, a representa-
tive sample accurately reflects the individuals, behaviors, and scores found in the
population. Essentially, a representative sample is a good example—a miniversion—of
the larger population. With such a sample, our inferences about the scores and behav-
iors found in the population will also be accurate, and so we can believe what our data
seem to be telling us about nature. Thus, if your class is representative of all statistics
students, then the scores in the class are a good example of the scores that the popula-
tion would produce, and we can believe that everyone would behave as the class does.
Researchers try to create a representative sample by freely allowing the types of
individuals found in the population to occur in the sample. To accomplish this, we cre-
ate a random sample: the individuals in our sample are randomly selected from the
population. This means that who gets chosen depends simply on the luck of the draw
(like drawing names from a hat). Because we don’t influence which participants are
selected, the different types of individuals are free to occur in our sample as they do in
the population, so the sample’s characteristics “should” match the population.
However, random sampling is not foolproof because it may not produce a representa-
tive sample: Just by the luck of the draw, we may select participants whose characteris-
tics do not match those of the population. Then the sample will be unrepresentative,
inaccurately reflecting the behavior of the population. For example, maybe unknown to
us, a large number of individuals happen to be in your statistics class who do not behave
at all like typical students in the population—they are too bright, too lazy, or whatever.
If so, we should not believe what such a sample indicates about our law of nature
because the evidence it provides will be misleading and our conclusions will be wrong!
Therefore, as you’ll see, researchers always deal with the possibility that their conclu-
sions about the population might be incorrect because their sample is unrepresentative.
Nonetheless, after identifying the population and sample, the next step is to define
the specific situation and behaviors to observe and measure. We do this by selecting our
variables.
Obtaining Data by Measuring Variables
In our example research, we asked: Does studying statistics improve your learning of
them? Now we must decide what we mean by “studying” and how to measure it, and
what we mean by “learning” and how to measure it. In research the factors we measure
that influence behaviors—as well as the behaviors themselves—are called variables. A
variable is anything that, when measured, can produce two or more different scores.
A few of the variables found in behavioral research include your age, race, gender, and
intelligence; your personality type or political affiliation; how anxious, angry, or ag-
gressive you are; how attractive you find someone; how hard you will work at a task; or
how accurately you recall a situation.
Variables fall into two general categories. If a score indicates the amount of a variable
that is present, the variable is a quantitative variable. A person’s height, for example, is a
quantitative variable. Some variables, however, cannot be measured in amounts, but in-
stead a score classifies an individual on the basis of some characteristic. Such variables are
called qualitative, or classification, variables. A person’s gender, for example, is a qualita-
tive variable, because the “score” of male or female indicates a quality, or category.

The Logic of Research 15
For our study, we might measure “studying” using such variables as how much
effort is put into studying or the number of times a chapter is read, but say we select
the variable of the number of hours spent studying for a particular statistics test. We
might measure “learning” by measuring how well statistical results can be interpreted
or how quickly a specific procedure can be performed, but say we select the variable of
grades on the statistics test.
As in any research, we then study the law of nature by studying the relationship
between our variables.
Understanding Relationships
If nature relates those mental activities that we call studying to those mental activities
that we call learning, then different amounts of learning should occur with different
amounts of studying. In other words, there should be a relationship between studying
and learning. A relationship is a pattern in which, as the scores on one
variable change, the corresponding scores on the other variable change
in a consistent manner. In our example, we predict the relationship in
which the longer you study, the higher your test grade will be.
Say that we asked some students how long they studied for a test and
their subsequent grades on the test. We might obtain the data in Table 2.1.
1
To see the relationship, first look at those people who studied for 1 hour
and see their grades. Then look at those whose score is 2 hours and see
their grades. And so on. These data form a relationship because, as study-
time scores change (increase), test grades also change in a consistent fash-
ion (also increase). Further, when study-time scores do not change (for
example, Gary and Bob both studied for 1 hour), grades do not change
either (they both received Fs). In statistics, we use the term association
when talking about relationships. Here, low study times are associated with
low test grades and high study times are associated with high test grades.
REMEMBER In a relationship, as the scores on one variable change, the
scores on the other variable change in a consistent manner.
Because this relationship occurs in the sample data, we have evidence that the
amount that people study does make a difference in their test grades. Therefore, assum-
ing that the sample is representative, we can generalize this finding to the broader pop-
ulation so that we can talk about how people learn in general. In the same way, most
research investigates relationships because a relationship is the telltale sign of a law of
nature at work: When nature ties behaviors or events together, we see a relationship
between the variables that measure those behaviors and events.
Thus, an important step in any research is to determine if there is a relationship in
the sample data that matches the relationship that we predict. A major use of statistical
procedures is to help us understand the relationship, examining the scores and the pat-
tern they form. The simplest relationships fit one of two patterns. Sometimes the pat-
tern fits “The more you , the more you ,” with higher scores paired with higher
scores. Thus, the old saying “The bigger they are, the harder they fall” describes such
a relationship, as does “The more often you speed, the more traffic tickets you accumu-
late.” At other times, the pattern fits “The more you , the less you , with higher YX
Y
XYX
Study Time
Student in Hours Test Grades
Gary 1 F
Bob 1 F
Sue 2 D
Jane 2 D
Tony 3 C
Sidney 3 C
Ann 4 B
Rose 4 B
Lou 5 A
TABLE 2.1
Scores Showing a
Relationship between
the Variables of Study
Time and Test Grades
1
The data presented in this book are a work of fiction. Any resemblance to real data is purely
a coincidence.

16 CHAPTER 2 / Statistics and the Research Process
scores paired with lower scores.” Thus, that other old saying “The more you prac-
tice statistics, the less difficult they are” describes a relationship, as does “The more al-
cohol you consume, the less coordinated you are.”
Relationships may also form more complicated patterns where, for example, more
at first leads to more , but beyond a certain point more leads to less . For example,
the more you exercise, the better you feel, but beyond a certain point more exercise
leads to feeling less well, as pain and exhaustion set in.
Although the above examples involve quantitative variables, relationships can also in-
volve qualitative variables. For example, men typically are taller than women. If you think
of male and female as “scores” on the variable of gender, then this is a relationship, be-
cause as gender scores change (going from male to female), height scores tend to decrease.
We can study any combination of qualitative and quantitative variables in a relationship.
The Strength of a Relationship The data back in Table 2.1 show a perfectly con-
sistent association between study time and test grades: In a perfectly consistent rela-
tionship, each score on one variable is paired with only one score on the other variable.
In Table 2.1, all those who studied the same amount received the same grade. In the real
world, however, not everyone who studies the same amount will receive the same
grade. (Life is not fair.) However, a relationship can be present even if there is only
some degree of consistency so that, as the scores on one variable change, the scores on
the other variable tend to change in a consistent fashion. The degree of consistency in a
relationship is called its strength, and a less consistent relationship is called a weaker
relationship. For example, Table 2.2 shows two relationships between the number of
hours spent studying and the number of errors made on a test.
First look at Part A on the left side of Table 2.2. Again note the error scores paired
with each study-time score. Two aspects of the data produce a less consistent relation-
ship: (1) Not everyone who studies the same amount receives the same error score
(1 hour of study produced 13, 12, or 11 errors), and (2) sometimes the same error score
is paired with different studying scores (11 errors occur with 1 and 2 hours). Nonethe-
less, a reasonably clear pattern is still here in which one batch of similar error scores
YXY
X
YX
A
X Y
Study Time Errors
Student in Hours on Test
1113
2112
3111
4211
5210
6210
7310
839
949
10 4 8
11 5 7
12 5 6
B
X Y
Study Time Errors
Student in Hours on Test
1113
2111
319
4212
5210
629
739
837
949
10 4 7
11 5 8
12 5 6
TABLE 2.2
Data Showing a Stronger
(A) and Weaker (B)
Relationship between
Study Time and Number
of Errors on a Test

The Logic of Research 17
tends to occur at one study time, but a different, lower batch of similar error scores
tends to occur at the next study time. Therefore, this is a reasonably strong relationship.
The data in Part B of Table 2.2 show a weaker relationship: (1) Each study time is
paired with a wider range of error scores (here 1 hour of study produced anywhere
between 13 and 9 errors), and (2) the same error scores occur with a greater variety of
study times (here 9 errors occur with 1, 2, 3 or 4 hours). These aspects produce greater
overlap between the error scores at one study time and those at the next, so there is
closer to the same batch of error scores at each study time. This produces a pattern of
decreasing errors that is harder to see.
Thus, the strength of a relationship is the extent to which one or close to one value
of tends to be consistently associated with only one value of . Conversely, in a
weaker relationship, a greater variety of scores is associated with each score and/or
the same score is paired with different scores.
REMEMBER A stronger relationship occurs the more that one group of simi-
lar scores is associated with one score and a different group of similar
scores is associated with the next score.
Two factors produce a relationship that is not perfectly consistent. First, extraneous
influences are operating. For example, say that distracting noises occurred while some-
one studied for 1 hour, but not when someone else studied for 1 hour. Because of this,
their studying might not be equally effective, resulting in different error scores paired
with the same study-time score. Second, individual differences are operating. Individ-
ual differences refer to the fact that no two individuals are identical because of differ-
ences in genetics, experience, intelligence, personality, and many other variables. Thus,
test performance will be influenced by a person’s intelligence, aptitude, and motiva-
tion. Because students exhibit individual differences in these characteristics, they will
each be influenced differently by the same amount of studying and so will produce dif-
ferent error scores at the same study-time score.
Theoretically, a relationship can have any degree of strength. However, perfectly
consistent relationships do not occur in real research because individual differences and
extraneous variables are always operating. Despite this, the less consistent relationships
back in Table 2.2 still support our original hypothesis about how nature operates: They
show that, at least to some degree, nature does relate studying and test errors as we pre-
dicted. Therefore, our next step would be to measure the degree to which nature does
this. Likewise, in any research, it is never enough to say that you have observed a rela-
tionship; you must also determine the strength of the relationship. (Later chapters dis-
cuss statistical procedures for describing the strength of a relationship.)
REMEMBER Research is concerned not only with the existence of a relation-
ship but also with the strength of the relationship.
When No Relationship Is Present At the other extreme, when there is no consis-
tent pattern between two variables, there is no relationship. For example, there is not
(I think) a relationship between the number of chocolate bars people consume each day
and the number of times they blink each minute. If we measure individuals on these
two variables, we might have the data shown in Table 2.3. Mentally draw in horizontal
lines so that you look at the batch of eye-blink scores paired with one chocolate score
at a time. Here there is no consistent change in the blink scores as the scores on the
chocolate variable change. Instead, very similar—but not identical—groups of blinking
scores are paired with each chocolate score. Because there is no relationship in this
sample, we do not have evidence that these variables are linked in nature.
XY
XY
XY
XY
XY