Hawkes P.W., Spence J.C.H. (Eds.) Science of Microscopy. V.1 and 2
Подождите немного. Документ загружается.

Chapter 4 Analytical Electron Microscopy 365
procedures (Schaffer et al., 2004), these datasets have the advantage
that the background extrapolation can be carried out with much higher
precision than in the three-window technique. Energy windows as
small as 0.1 eV have been used on instruments equipped with mono-
chromators and high-resolution fi lters corrected up to third-order
aberrations (Hofer et al., 2005). Quantitative analysis to extract the
absolute atomic density and deconvolution of the effects of multiple
scattering are also possible since the full spectrum is retrievable at
each pixel (Thomas and Midgley, 2001b). In fact, for each pixel of the
image sequence the intensity can be measured and a spectrum of
energy resolution equivalent to the width of the energy-selecting
slit is deduced. Based on limited sequences of images with narrow
energy windows (1–2 eV) and selection of spectra at the edge threshold,
this approach has demonstrated that changes in the near-edge struc-
ture due to variations in the chemical bonding state of elements are
visible (Muller et al., 1993; Botton and Phaneuf, 1999; Bayle-Guillemaud
et al., 2003; Hofer et al., 2000). This capability suggests that similar to
X-ray absorption scanning transmission microspectroscopy (e.g., Hitch-
cock et al., 2005), bonding changes can be visualized with EELS
mapping, albeit with a spatial resolution typical of EFTEM images (see
Section 6.2.3).
6.2.2 STEM-EELS Mapping
The other variant of the more advanced EELS imaging technique
makes use of developments in fast detectors, large storage capacity, and
fast computers. The approach is based on the use of STEM instruments
equipped with parallel or dedicated 2D fast detectors. The original idea
of this technique was proposed by the Orsay group (Jeanguillaume
and Colliex, 1989) and implemented in subsequent years by various
groups (Hunt and Williams, 1991; Botton and L’Espérance, 1994; Colliex
et al., 1994). As for EFTEM spectrum imaging, the STEM-EELS imaging
is also commercially available from the spectrometer manufacturer
Gatan. The technique involves the sequential acquisition of an energy
loss spectrum (acquired with the photodiode array or a 2D detector)
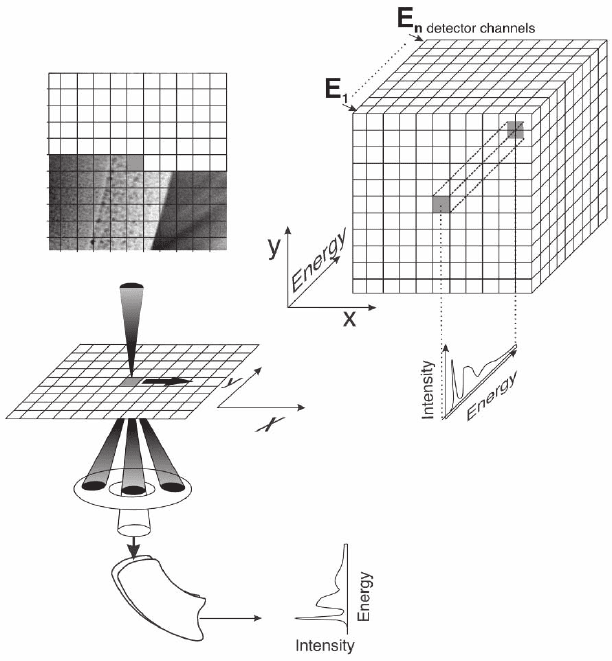
at each pixel of a rastered area. The fi lling of the data cube (Figure 4–79)
is thus achieved by scanning the beam over each pixel of the area of
interest (pixel by pixel in two dimensions or over a line across inter-
faces) with the third (and fourth) dimension in the data cube being the
energy loss spectrum (energy and intensity).
The advantage of this approach is the availability of the full spec-
trum at each pixel making it easy to implement various data-mining
approaches. Signals can be extracted with advanced methods, includ-
ing multiple least-squares techniques, and the detailed shapes of the
near-edge structures can be fi tted with reference standards from dif-
ferent phases. This technique can therefore be used to map changes in
the chemical bonding environment of atoms in nanoscale structures
as in EFTEM imaging but with much higher spectral sampling. Through
the analysis of a single edge and with reference standards, it is thus
possible to extract the distribution of the individual phases rather than
just the chemical composition. This powerful technique can be imple-
366 G. Botton
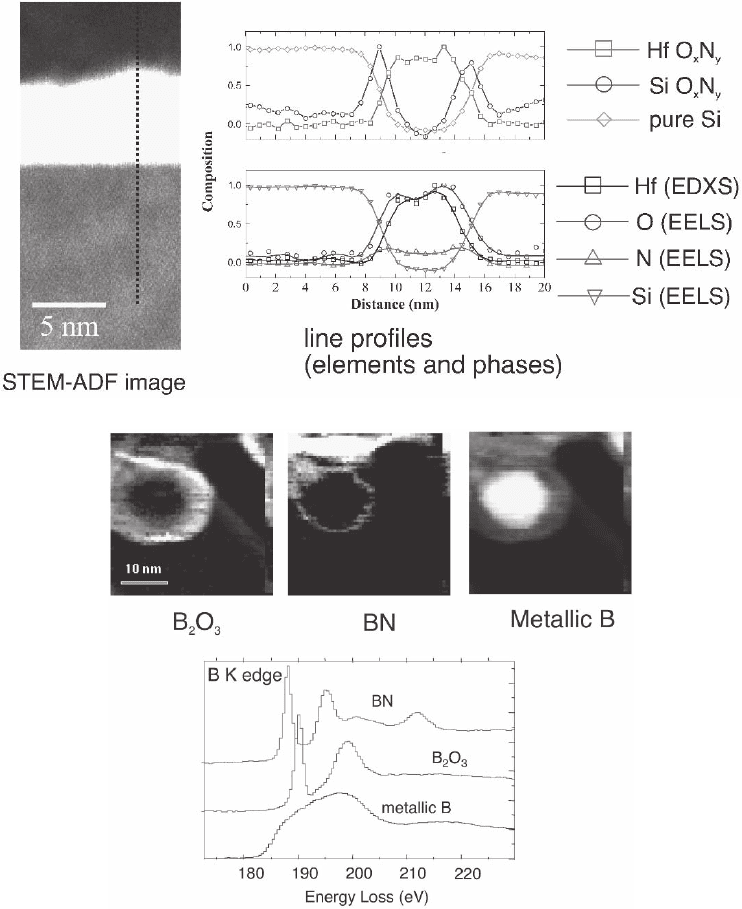
mented in one or two dimensions (Figure 4–80) for core loss near-edge
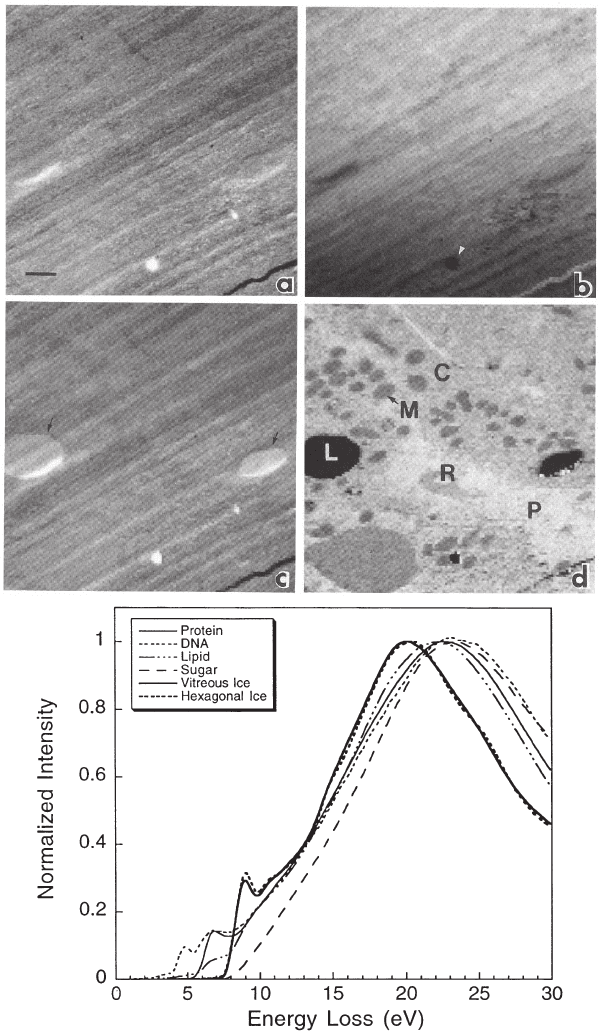
structure features and also for low-loss features. Using the differences
in low-loss spectra of various biological structures and ice, Sun et al.
(1995) were able to map the distribution of the various functional com-
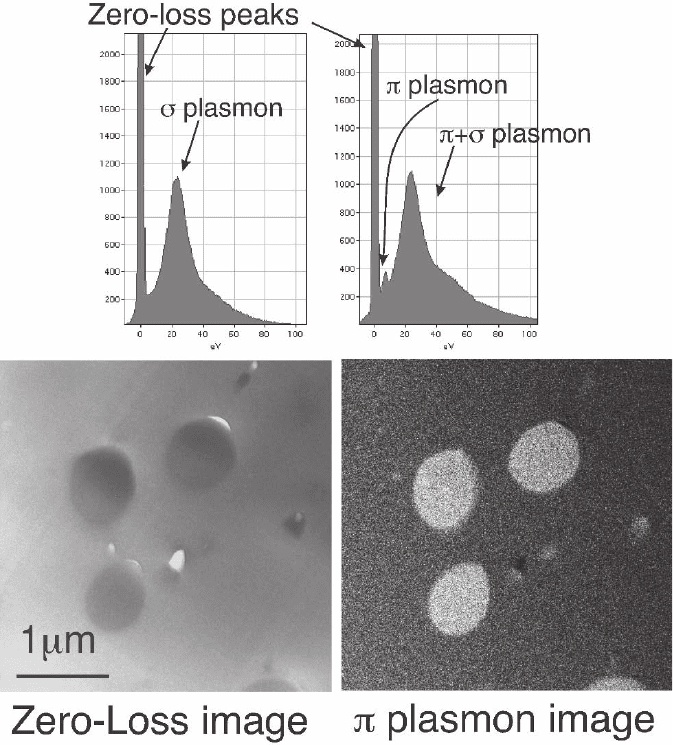
ponents in cells (Figure 4–81). Similarly, for the analysis of polymer-
based materials, the use of low-loss features related to the presence of
π and π + σ plasmons has been used to distinguish polystyrene and
polyethylene in composite blends (Figure 4–82) (Oikawa, 2006; Hunt
et al., 1995).
6.2.3 Quantitative EELS Imaging
If core-loss spectra are combined with low-loss spectra acquired from
the same pixel, it is possible to retrieve more quantitative information
on the sample. Hence, deconvolution techniques (Section 8.2) can be
applied to retrieve the single scattering distribution for accurate quan-
tifi cation (Section 4.2), dielectric function measurements (Section 8.2),
Figure 4–79. Schematic description of the STEM spectrum imaging technique
(STEM-SI). For each pixel of the rastered area an energy loss spectrum is
acquired. Although the spatial sampling is typically lower than in the EFTEM-
SI technique, the spectral sampling is higher with easy recording of the
near-edge structure features at each pixel.
Chapter 4 Analytical Electron Microscopy 367
a)
b)
Figure 4–80. (a) Application of the STEM-SI technique to determine the distribution of elements
across interfaces between a high dielectric constant material (Hf-O-N) and Si (STEM annular dark-fi eld
image, left). EDXS spectra and EELS spectra were recorded simultaneously to extract the elemental
composition (bottom right profi le). By analysis of the near-edge structure shape of the Si L
23
edge and
O K edge, it is possible to distinguish and map the contribution of pure Si, Si-O-N, and Hf-O-N.
(Courtesy of M. Couillard, McMaster University.) (b) Two-dimensional phase maps of B nanostructure
with BN, B
2
O
3
, and metallic B separated according to the shape of the near-edge structure spectra of
the B K edges using the STEM-Spectrum imaging technique and least-squares fi tting of spectra. The
structure consists of a metallic B core with a thin BN shell and outer thick shell of B
2
O
3
. (Courtesy of
O. Stephan and C. Colliex, University Paris-Sud.)
368 G. Botton
e)
Figure 4–81. STEM images and phase component maps in frozen hydrated liver tissue. (a) Low-dose
dark-fi eld STEM image sectioned sample showing no contrast; (b) bright-fi eld image of the same region
based on integration of all signals on the spectrum at each pixel of the STEM-SI (the intensity drop is
due to the variation of beam current during the acquisition); (c) relative thickness map (t/λ), contrast
is visible on the lipid droplets; (d) water maps and identifi cation of the various biological components
based on the multiple least-squares fi t of the low-loss spectra with water and protein reference com-
pounds and the amount of water within the structure: L, lipid droplet (zero water content); P, plasma
(91% water); R, erythrocyte (65% water); M, mitochondria (57% water); (e) low-energy loss spectra of
the various components differentiating the phases. Bar marker is 1 µm. (From Sun et al. © 1995,
reprinted with permission from Blackwell Publishing.)
Chapter 4 Analytical Electron Microscopy 369
and the thickness relative to the inelastic mean free path of the sample
(Section 8.2), and also to implement quantitative statistical analysis
(Bonnet et al., 1999) to retrieve signifi cant spectral components and
analyze changes in bonding at interfaces in materials. Thickness maps,
relative to the mean free path (Section 8.2), can be obtained with the
EFTEM and STEM imaging approaches by acquiring a zero-loss image
I
0
(x,y) and an unfi ltered image I
t
(x,y). Following the approach dis-
cussed in Section 8.2 for the analysis of individual spectra to obtain
relative thickness (t/λ) values, the ratio of the two images can be com-
bined to give the relative thickness map I
t/λ
(x,y) = ln[I
t
(x,y)/I
0
(x,y)]. The
variant of this EFTEM method is to acquire the low-loss spectrum at
each pixel and process the individual spectra to deduce t/λ at each
Figure 4–82. Section of polyfi n–polycarbonate polymer composite. The low-loss spectrum of the
polyfi n (top left) does not show the π plasmon resonance visible on the spectrum of the polycarbonate
material (top right). The zero-loss image (bottom left) does not show strong contrast between the two
phases while the π plasmon energy-fi ltered image (bottom right) clearly makes it possible to distin-
guish the regions where the polycarbonate is present. (Courtesy of Dr. T. Oikawa, JEOL.)
370 G. Botton
point of an image (see Section 8.2). This information on the sample
thickness is valuable for the determination of the volume of the sample
under analysis (hence the volume fraction of particular phases or
defects), or to determine whether the changes in thickness affect the
apparent intensity of elemental maps. The thickness information is also
useful to verify whether the thickness of the sample is beyond the
critical thickness at which accurate extraction and quantifi cation can
be carried out (Section 4.2.4). Finally, the thickness information, if
combined with EDXS maps, can lead to fully quantitative X-ray maps
accounting for X-ray and absorption corrections.
As in the case of EDXS imaging, elemental maps can also be com-
bined to retrieve fully quantitative concentration maps and deduce
phase analysis histograms using experimental k-factors or cross sec-
tions (Hofer et al., 1997; Kothleitner and Hofer, 2003). The advantage
of concentration maps is, as in the case of EDXS mapping, the fact that
within a range of relative thickness t/λ < 0.5, images are independent
of thickness as discussed in Section 4.2.4. Diffraction effects due to
elastic scattering of electrons outside the objective aperture can also
lead to apparent variations in the intensity of elemental maps and can
be canceled out using the jump-ratio imaging technique. Concentration
maps based on the single scattering distribution of energy losses
obtained after deconvolution of the full spectrum at each pixel show
that reliable quantitative images can be obtained for thickness up to
t/λ ≅ 2 (Thomas and Midgley, 2001a).
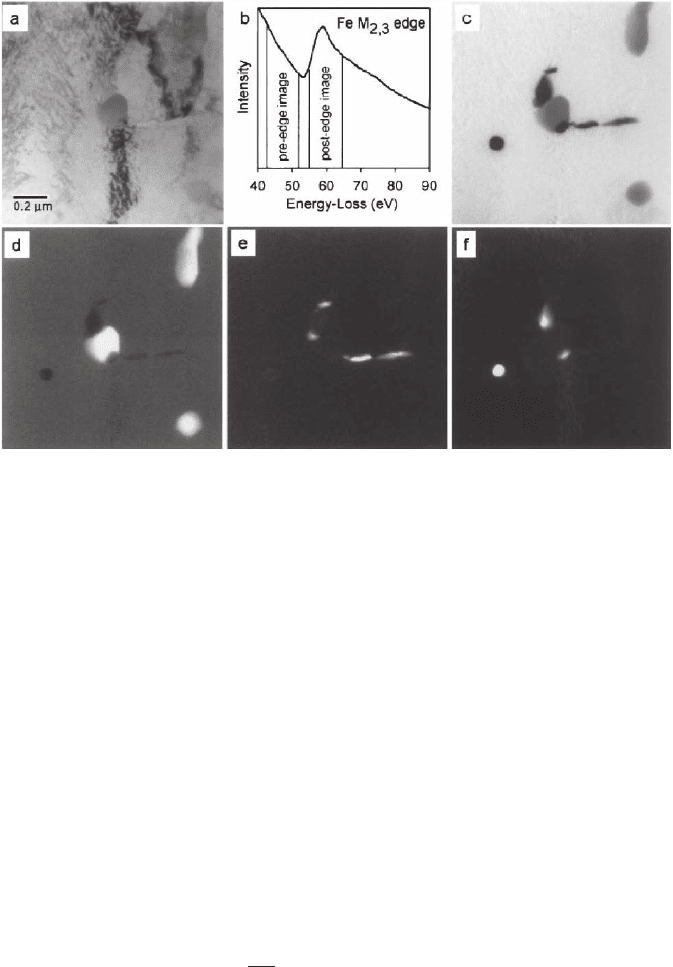
Another useful technique demonstrating the removal of diffraction
effects is the use of the rocking beam method during the acquisition
of energy-fi ltered images. In this approach, the incident electron beam
is tilted over a cone of angles (of the order of the Bragg angle) so as to
average out the local diffraction effects including deviations of the
scattering due to dislocations. Energy-fi ltered images with little dif-
fraction contrast can thus be obtained even in bent and highly deformed
samples (Hofer and Warbichler, 1996; Hofer et al., 2000) (Figure 4–83).
Removal of diffraction contrast for qualitative imaging and visualiza-
tion of precipitates in highly deformed samples has also been demon-
strated using ratios of plasmon images obtained at different energies
(Carpenter, 2004).
Various aspects of optimization of signals for EFTEM and STEM-
EELS maps, including the position of energy windows, automatic
detection of edges, illumination conditions, and magnifi cation, are dis-
cussed in the work of Kothleitner and Hofer (1998, 2003), Grogger
et al. (2003), Berger and Kohl (1992, 1993), and Berger et al. (1994).
Through image analysis of the quantitative maps, it is also possible to
segment images based on the composition and relative fraction of ele-
ments (Hofer et al., 1997, 2000). Algorithms to allow automatic detec-
tion of edges, for quantitative analysis of phase distributions, for the
determination of thresholds for phase detection and problematic zones
in the samples have also been developed with the use of full spectra
recorded in STEM mode (Kothleitner and Hofer, 2003). Corrections of
drifts in EFTEM images for quantitative analysis have been discussed
in detail in Schaffer et al. (2004).
Chapter 4 Analytical Electron Microscopy 371
6.2.4 Spatial Resolution in EFTEM Elemental Mapping
The resolution in EFTEM elemental mapping depends on several
factors related to the operation parameters of the microscope and the
energy loss of interest so that further discussion of this topic is required.
When no angular limiting aperture is present (in imaging the objective
aperture would be limiting the scattering angles) the dominant factor
is related to the chromatic aberration term discussed in Section 5.2. For
general conditions, however, we must summarize the contributions
that need to be added in quadrature to retrieve the total broadening of
an object point (Krivanek et al., 1995b).
1. Following the discussion in Section 5.2, the chromatic aberration
broadening term when a limiting aperture is used can be described
as
dC
E
E
cc
=
∆
0
β
(68)
where β is the collection angle (limited by the objective aperture in
imaging mode), ∆E is the width of the energy window used to acquire
the image, and E
0
is the incident energy. This expression assumes that
images are focused at the energy loss E where the energy window is
located (rather than at the elastic image) and that the aperture is fi lled
with the electrons. This assumption is important since, as discussed in
Section 5.2, the width of angular distribution of scattering can be
smaller and the contribution to the chromatic aberration term would
Figure 4–83. Imaging of precipitates in a steel sample. (a) TEM bright-fi eld image of the 10% Cr
steel with Cr
23
C
6
-VN and Nb(C,N) precipitates. (b) EELS spectrum with the Fe-M
23
edge. (c) Fe-M
23
jump-ratio image recorded with the rocking beam illumination. (d) Cr-L
23
jump-ratio image. (e) V-L
23
jump-ratio image. (f) Nb-M
45
jump-ratio image. (From Hofer et al. © 2000, with permission from
Springer Science+Business Media.)
372 G. Botton
be modifi ed. As experimental conditions often impose some conver-
gence in the illumination and the chromatic aberration term is small
compared to the subsequent broadening terms for low scattering angles
(either limited by β or θ
E
) this assumption if often assumed to be
valid.
2. The delocalization of inelastic scattering term b [introduced
in Section 5.2, Eq. (64)] contributes to the broadening with an energy
and angular-dependent term increasing at low energy losses and
low scattering angles (large scattering angles imply a small impact
parameter).
3. The diffraction limit contribution arises from use of the objective
aperture and dominates for small angles due to the denominator
term
d
d
= 0.6 λ/β (69)
4. The spherical aberration term d
s
= 2C
s
β
3
strongly varies with β
and is considered to contribute to a uniform background in the image
and a decrease of contrast when the conditions are optimized for
minimal chromatic aberration contributions (Krivanek et al., 1995b).
Egerton’s work (1999) showed that this term is smaller than the chro-
matic aberration term for typical energy windows used for EFTEM
mapping, but for small energy windows (a few electronvolts wide as
used, for example, in EFTEM spectrum imaging) the term will domi-
nate the resolution at high collection angles and will need to be included
in the analysis. Experimental evidence suggests that the term should
be neglected given the good spatial resolution of energy-fi ltered images
with relatively large collection angles.
Additional terms affecting the resolution depend on the noise in the
images (requiring averaging of signals and increase of acquisition
time), radiation damage of the specimen due to the high doses required
for imaging at core losses, and instabilities of the sample and micro-
scope leading to drift of the area under analysis during acquisition.
Considering the signifi cant terms added in quadrature it is possible
to determine the ultimate physical limits to EFTEM mapping resolu-
tion (Krivanek et al., 1995b)
d
2
tot
= d
2
c
+ (2b)
2
+ d
2
d
(70)
The trends, as a function of collection aperture, suggest that there
are optimal operating conditions for a given energy loss, energy
window ∆E, and microscope characteristics (Figure 4–84). When energy
losses of the order of a few hundred electronvolts are analyzed, for
small collection angles the diffraction limit term dominates, while
for large angles the chromatic aberration term is most important. The
width of the energy window has a signifi cant effect on the resolution
as it is linearly related to the chromatic contribution. Quite often,
large energy windows are used to increase the counting statistics and
reduce the noise in the images. When the energy window is large, the
choice of the optimal collection aperture is more crucial as the chro-
matic aberration term rises steeply. For modern analytical TEMs oper-
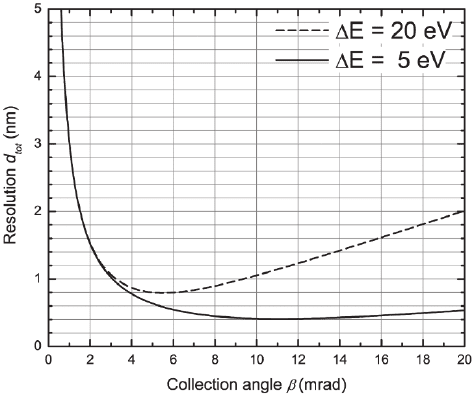
Chapter 4 Analytical Electron Microscopy 373
ating at or above 200 keV, and for lenses with chromatic aberration
parameters around 1 mm, the delocalization term [Eq. (64)] is not a
limiting factor for core losses above around 500 eV. For lower energy
losses, in the order of 100 eV or less, this term can dominate the resolu-
tion limit in theory. Experimental results in the literature, however,
suggest that the low losses delocalization terms based on Eq. (64) are
overestimated (Muller and Silcox, 1995; Grogger et al., 2005). For high
core losses, elemental maps show resolution limits consistent with the
calculations of optimal values given above (e.g., below 1 nm based on
Figure 4–84) while for low energy losses (including plasmon losses
around 10–20 eV), images with a resolution around 1 nm (signifi cantly
better than the prediction of 4–5 nm) have been obtained (Grogger
et al., 2005).
Based on the signifi cant contributions of chromatic aberrations for
EFTEM imaging, the optimal approach to achieve the ultimate spatial
resolution limits in EELS mapping, as imposed by unavoidable delo-
calization, is to use the STEM approach with small and high-intensity
probes achievable today on modern analytical electron microscopes.
With current technology making use of bright electron sources and
aberration correctors it is possible to focus several hundred picoam-
peres of current into a near 2 Å probe [Sections 2.1 and 2.2 and Chapter
2 (this volume)].
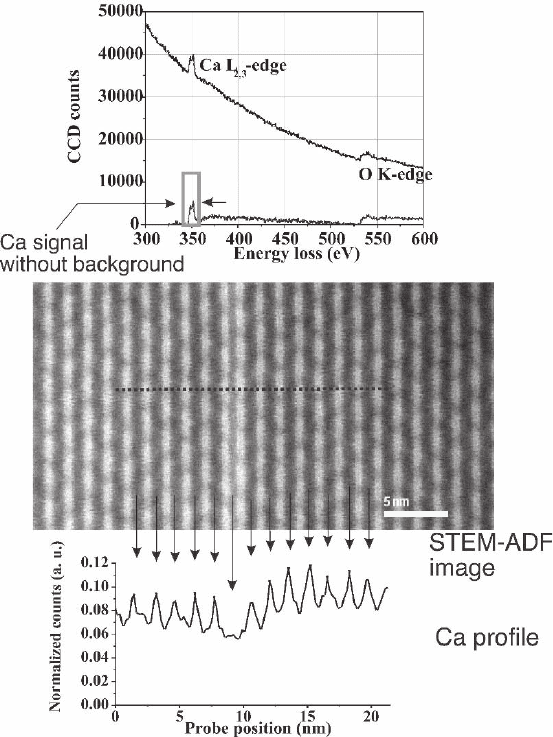
Examples of chemical analysis with a noncorrected STEM demon-
strate the ability to resolve individual atomic planes of Ca in the
Bi
2
Sr
2
Ca
1
Cu
2
O
8+δ
superconductor (Figure 4–85) and analyze half-unit
cell defects where the Ca planes are not present, suggesting the exis-
tence of a Bi
2
Sr
2
Ca
0
Cu
1
O
8+δ
subunit cell intergrowth.
Figure 4–84. Calculations of the expected resolution in EFTEM elemental
maps at the oxygen K edge (530 eV) as a function of the collection angle for
two energy-fi ltering windows of width ∆E = 5 and 20 eV and C
s
= C
c
= 1 mm
(at 200 keV).
374 G. Botton
7 Detection Limits in Microanalysis
The very high spatial resolution of both EDXS and EELS results in rela-
tively low detection limits for most elements as compared to “bulk”
analysis methods. This effect is caused by a combination of factors
including the small analyzed volumes, the low signals resulting from
poor effi ciency in signal collection, or/and low incident beam current,
high background, short acquisition time, and instrumental contribu-
tions. Two quantities characterize the detection limits for EDXS and
EELS depending on information of interest. The minimum detectable
fraction (MDF) refers to a dilute element uniformly distributed in the
Figure 4–85. High-resolution EELS profi le of Ca in Bi
2
Sr
2
Ca
1
Cu
2
O
8-δ
based on
the Ca L
23
edge showing the detection of a single plane of Ca in the half-unit
cell of the structure. The central panel shows a high-angle annular dark-fi eld
image of the sample. The profi le shows the presence of a half-unit cell defect
of the Bi
2
Sr
2
Ca
0
Cu
2
O
8-δ
phase (where there is a missing plane of Ca) in the
structure. (Courtesy of Y. Zhu, McMaster University.)
