Hawkes P.W., Spence J.C.H. (Eds.) Science of Microscopy. V.1 and 2
Подождите немного. Документ загружается.

Chapter 4 Analytical Electron Microscopy 315
a)
b)
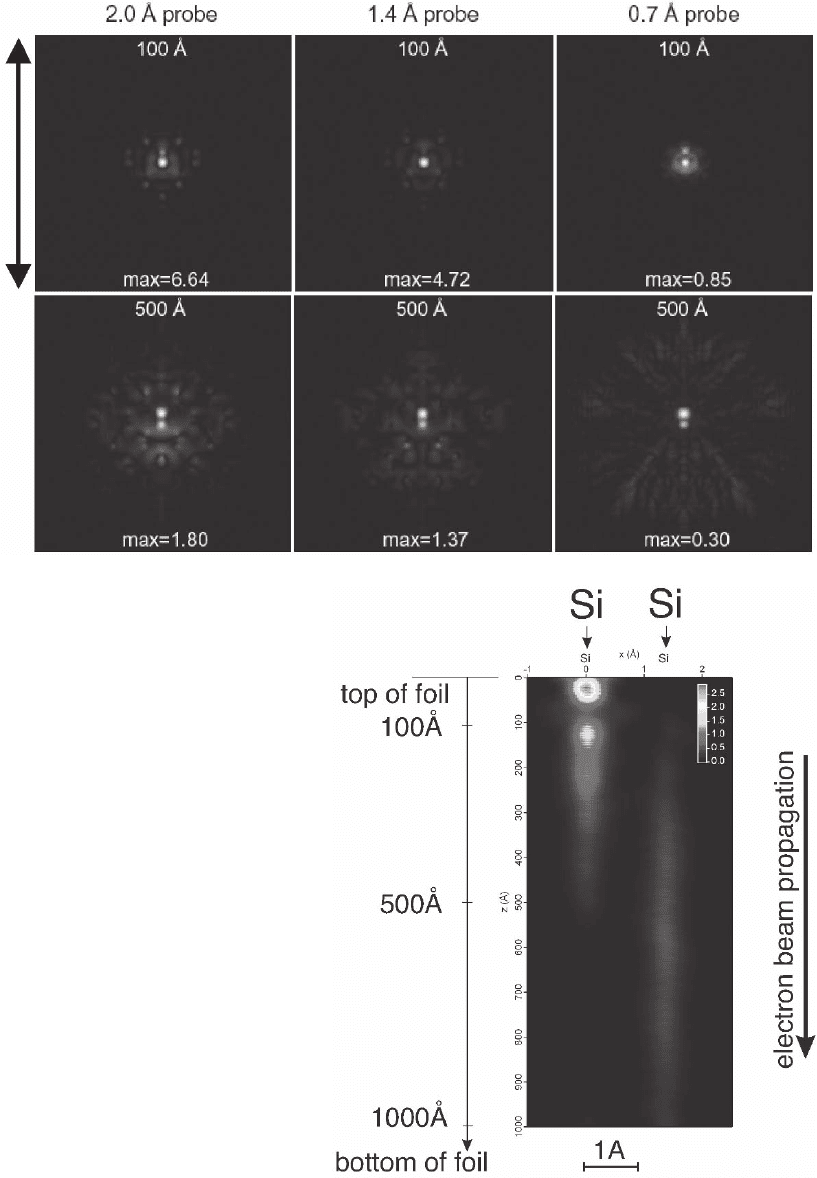
Figure 4–36. Real space intensity dis-
tribution of the probe electron density
in the sample as it propagates through
the thickness of the foil. Plots of the
intensity distribution at two depths
(100 and 500 Å) are shown for incident
probe sizes of 2, 1.4, and 0.7 Å (as
obtained with an aberration-corrected
microscope) when the electron beam is
positioned on the atomic column down
the 110 orientation of the crystal (arrow
length is 16.3 Å). The electron beam is
channeled onto the atomic column, but
the intensity maxima moves from one
atomic column to the adjacent one
(Dwyer and Etheridge, 2003). (Images
courtesy of C. Dwyer and J. Etheridge.)
(b) Alternate visualization of the
process of channeling viewed as a
function of thickness. The beam inten-
sity clearly channels from one atomic
column to the adjacent one as the
electrons propagate in the sample
(Voyles and Muller, © 2004. Reprinted
with permission from Cambridge
University Press.)
316 G. Botton
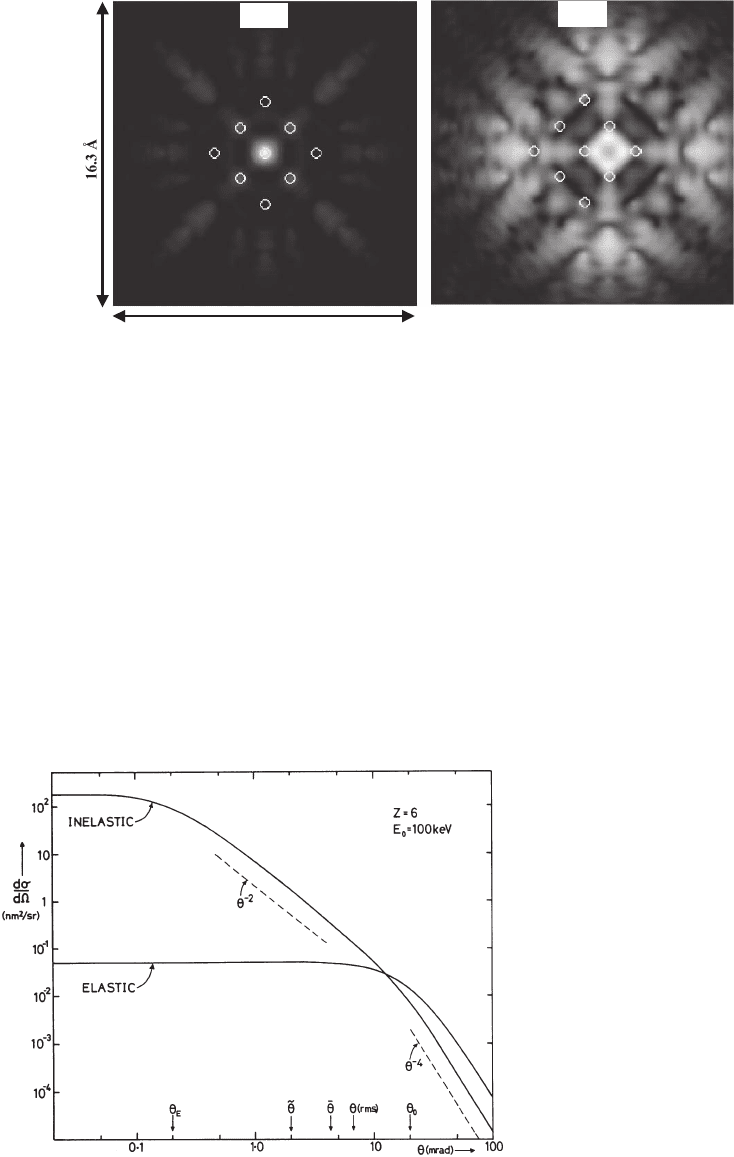
total inelastic and elastic scattering cross sections make it possible to
compare the width of the respective angular distributions. The angular
distributions are Lorentzian with an angular width of θ
¯
E
for the inelas-
tic distributions and θ
0
for the elastic distribution. It is also possible to
note that the angular width of the elastic distribution (for scattering
from free atoms) is larger than the inelastic distribution.
max = 0.02min = 0.00
0.7
Å
probe OFF columns
300
Å
0.7 Å probe ON column
16.3
Å
max = 0.36min = 0.00
300 Å
a) b)
Figure 4–37. Real space intensity plots demonstrating the dispersion of the electron intensity when
the electron beam is located on top of the atomic column and when it is located between two atomic
columns. The bright empty circles indicate the position of the atoms in the cell closest to the point of
impact of the electron beam. Channeling is observed when the beam is positioned on the atomic
column (a) while much stronger dispersion is observed when the electron beam is not on the atomic
column (b). (Data courtesy of C. Dywer and J. Etheridge.) (For part A, see color plate.)
Figure 4–38. Comparison of the
elastic and total inelastic angular
scattering distributions for the C
atoms at 100 keV. The characteristic
angles for the inelastic and elastic
distributions (θ
E
and θ
0
), the mean
angle θ
¯
, the median angle θ
˜
, and the
root-mean-square angle θ
rms
are
shown. (From Egerton, © 1996, with
permission from Springer Science+
Business Media.)

Chapter 4 Analytical Electron Microscopy 317
The total cross section integrated up to a scattering angle β is
relevant when calculating the inelastic free path or the stopping power
(see below)
σβ
πγ
βθθθ
θβ θ θ
i
ln
()
=
+
()
+
()
++
()
8
2
13
0
2
22
0
22
22
0
22
Z
k
EE
EE
(16)
The total inelastic scattering cross section integrated over all scattering
angles is approximated by
σ
i
≈ 16πγ
2
Z
1/3
ln (θ
0
/θ
E
) ≈ 8πγ
2
Z
1/3
ln (2/θ
E
) (17)
by replacing the cutoff angle θ
0
with the Bethe-ridge angle (2θ
E
)
1/2
. This
expression leads to a comparison of the relative magnitude of the
elastic and inelastic cross sections as described by
σ
i
/σ
e
≈ 2 ln (2/θ
¯
E
)/Z = C/Z (18)
where the coeffi cient C (around 20) does not vary signifi cantly with
atomic number and incident electron energy.
This expression can be used to calculate the scattering contrast as
defi ned in Reimer (1995) and to interpret the contrast in STEM images
obtained by calculating the ratio of inelastic and elastic signals.
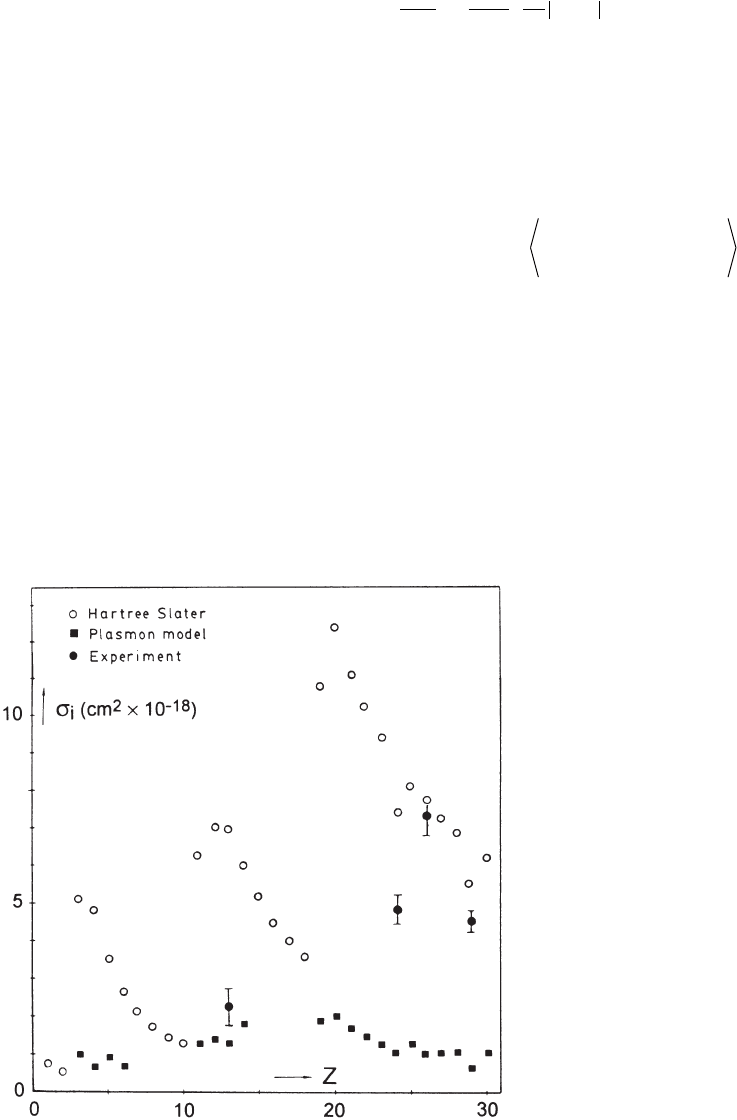
These calculations are a good fi rst approximation of the behavior of
the inelastic cross sections with further refi nements, accounting for the
outer-shell electrons, leading to systematic variations in the total cross
sections related to the fi lling of the periodic table. Minima in the inelas-
tic cross sections occur for atoms with closed shell while maxima occur
for atoms fi lling the s shell due to strong effects of valence excitations
(Egerton, 1996) (Figure 4–39).
The importance of the total inelastic cross section becomes apparent
in AEM as it forms the basis of calculations of the stopping power of
the electrons in the solid. This quantity is therefore relevant to under-
standing the propagation of the electrons and simulation of electron
trajectories in Monte Carlo simulations (Section 5.1):
S
dE
dz
nE==
ai
σ
(19)
where E is the energy loss, z is the distance traveled in the sample, E
–
is
the mean energy loss for the inelastic event, and n
a
is the number of
atoms in the solid per unit volume.
The total inelastic cross section considers all possible events giving
rise to energy losses represented by an average energy loss E
–
and does
not consider the individual interactions of the incident electrons with
the inner shells or outer shell atomic electrons. Predictions of the details
of a spectrum and the intensity at a given energy loss, however, must
take into account these various inelastic processes, their energy depen-
dence, and the angular distribution of scattering. To do so, we must
consider Bethe’s theory to predict the probability of transitions of elec-
trons from an initial state wavefunction ψ
0
to fi nal state wavefunction
ψ
n
following interaction with incident fast electrons and the related
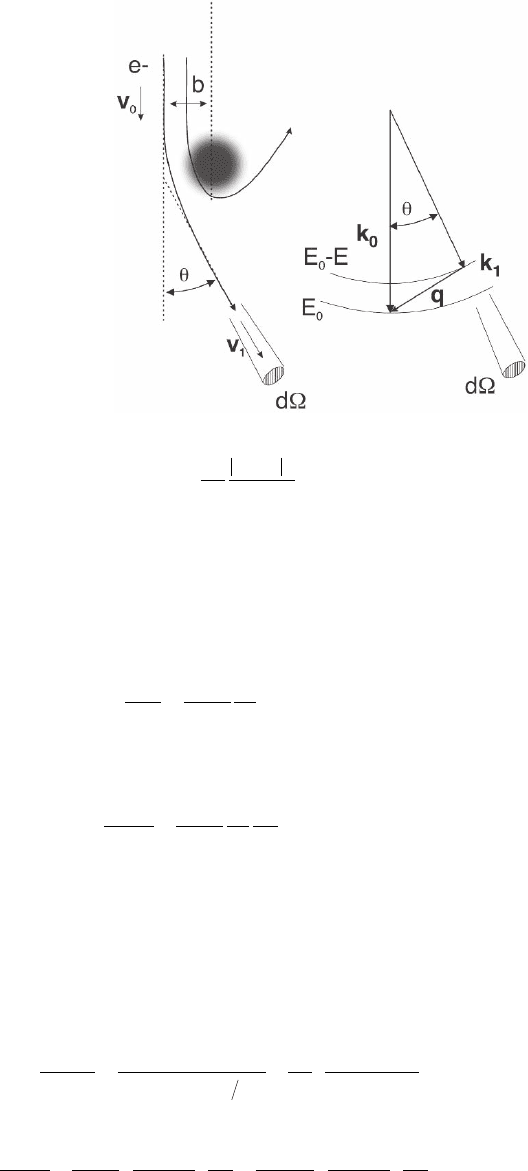
cross section. If the energy losses and the momentum transfer are
small compared to the momentum of the incident electron and there
318 G. Botton
is only one scattering event during the interaction (the fi rst Born
approximation) the cross section can be described by
d
d
aq
k
k
q
n
n
σγ
ε
Ω
=
(
)
4
2
0
24
1
0
2
(20)
where k
0
and k
1
are the magnitudes of the wave vectors of the incident
electron before and after scattering respectively and q is the scattering
vector related to the momentum transfer h
¯
q = h
¯
(k
0
− k
1
) (Figure 4–40).
The fi rst term has already been encountered in the description of
Rutherford scattering for a single charge [Eq. (8)] and constitutes the
amplitude factor in the cross section. This term is modifi ed by the inelas-
tic form factor related to the transition matrix element defi ned as
ετ
nn
j
jj
j
id i=⋅
(
)
=⋅
(
)
∫
∑∑
ΨΨΨ Ψ
*
exp | exp |qr qr
00 0
(21)
which expresses the interaction of the incident electron and the atomic
electron via an operator exp(iq ⋅ r
j
) where r
j
is the coordinate position
of the fast electron treated as a plane wave and the sum is carried out
over the atomic electrons from j = 1 to j = Z. This form factor contains
the information related to the properties of the material through the
wavefunctions of the electrons in the solid (see Section 8.1). |ε
n
(q)|
2
is
independent of the electron energy and solely dependent of the atom
and its environment.
From the form factor, the generalized oscillator strength (GOS) can
be defi ned as
Figure 4–39. Total inelastic cross
sections as a function of atomic
number (80 keV electrons). Open
circles are calculations based on the
Hartree–Slater models, solid squares
are based on calculations accounting
for plasmon losses, and the solid
circles are experimental data. (From
Egerton, © 1996, with permission
from Springer Science+Business
Media.)
Chapter 4 Analytical Electron Microscopy 319
fq
E
R
q
qa
n
n
n
(
)
=
(
)
(
)
ε
2
0
2
(22)
where R is the Rydberg energy (13.6 eV) and E
n
is the energy loss of the
transition. This term contains also information on the probability of
the transition from an initial state wavefunction ψ
0
to a fi nal state
wavefunction ψ
n
.
Using the concept of the generalized oscillator strength, the cross
section can be expressed as
d
d
R
Eq
k
k
fq
n
n
n
σγ
Ω
=
(
)
4
2
2
1
0
(23)
The full angular and energy dependence of the scattering can be
described by the double differential cross section
d
ddE
R
Eq
k
k
df
dE
qE
22
2
1
0
4σγ
Ω
=
(
)
,
(24)
where the scattering vector q is expressed in term of scattering angle
θ (Figure 4–40) and the initial and fi nal wavevectors k
0
and k
1
. For
small scattering angles and small energy losses relative to the incident
energy (as in typical TEM experiments) k
1
/k
0
≈ 1 and
q
2
≅ k
2
0
(θ
2
+ θ
2
E
) (25)
with θ
E
the relativistically corrected characteristic scattering angle
θ
γ
E
==
+
()
(
)
=
+
+
E
mv
E
Emcvc
E
E
Emc
Emc
0
2
00
2
2
0
00
2
00
2
2
(26)
and the cross section becomes
d
ddE
R
Ek
df
dE
aR
Em v
22
0
222
0
22
0
222
41
8
1σγ
θθ θθ
Ω
≈
+
=
+
EE
ddf
dE
(27)
Figure 4–40. Inelastic
scattering diagram
showing the scattering
vectors, the energy loss,
and the effect of the
classical impact param-
eter b on the scattering
angle (also refer to dis-
cussions on spatial res-
olution in Section 6).
320 G. Botton
The fi rst two terms of Eq. (27) represent a kinematic term of the scat-
tering while the df/dE term provides the information on the initial and
fi nal wavefunctions of the electrons (including changes in the bonding
state) either via inner shell or valence excitations. The second term
imposes a Lorentzian angular distribution of scattering at small scat-
tering angles as it contains the term θ
E
representing the half-width of
the distribution. At low energy losses and small scattering angles (i.e.,
q → 0), df/dE does not vary with θ and it can therefore be considered
as a dipole oscillator strength. In this region of scattering (achieved by
limiting the maximum scattering angle θ with a small aperture β) the
response to the excitation from an electron would be equivalent to the
excitation by a photon.
3.3.1 Outer Shell Excitations
The expression of df/dE has been derived in Bethe’s theory using atomic
models. To treat inner shell excitations, the initial and fi nal wavefunc-
tions of the electrons must be known. These wavefunctions vary with
the chemical state in a solid but the atomic models are still a good
approximation for the purpose of quantifi cation of the atomic concen-
tration based on intensity of edges. In the case of a solid, however,
wavefunctions related to outer shell excitations are much more strongly
modifi ed by the interaction between atoms and the collective behavior
of the electrons. Similarly, to model fi ne modulations in the edges
simple atomic models are not suffi cient (Section 8.1). To consider these
effects it is more convenient to consider the dielectric response of the
medium ε(q,E) to the incident electron treated as a point charge per-
turbing the solid.
The dielectric formulation of scattering relates the double differen-
tial scattering cross section to
d
ddE
qE
amvn
2
2
00
222
1
1σ
ε
πθθ
Ω
≈
−
(
)
[]
+
Im ,
a
E
(28)
thus the GOS relates to the dielectric function as
df
dE
qE
E
E
qE
,
,
a
(
)
=
−
(
)
21
2
π
ε
Im
(29)
where E
2
a
= h
¯
2
n
a
e
2
/(ε
0
m
0
), n
a
is the number of electrons per unit volume,
and Im[−1/ε(q,E)] is the loss function that contains all the material
dependence via the complex dielectric response of the solid ε = ε
1
+ iε
2
to electromagnetic radiation. The real part of the dielectric function
Re[ε(q,E) − 1] = ε
1
(q,E) − 1 is related to the polarizability of the medium
and the imaginary part Im[ε(q,E)] = ε
2
is related to the absorption.
Maxima in the loss function Im(−1/ε) = ε
2
/(ε
2
1
+ ε
2
2
) that result in strong
peaks in the energy loss spectra (Figure 4–7) occur when ε
1
= 0 and ε
2
is small (the damping is weak). The condition ε
1
= 0 suggests that a
condition of resonance is met and that the medium in unstable. This
instability corresponds to creation of a quasiparticle called plasmon of
energy E
a
. Further discussion on the derivation of the loss function and
applications can be found in Section 8.2.
Chapter 4 Analytical Electron Microscopy 321
3.4 Calculations of Cross Sections
Quantifi cation of EELS and EDXS spectra based on signals recorded
from edges and X-ray peaks (Section 4) is based on the knowledge of
cross sections. For inner shell excitations in EELS (and the related EDXS
peaks) it is assumed, as a fi rst approximation, that the initial and fi nal
wavefunctions are not affected by collective electron behavior and the
cross sections can be calculated using various models based either on
the simple hydrogenic description of the atomic electrons or the more
accurate Hartree–Slater method. For an atom of atomic number Z, the
hydrogenic model uses the simplifi cation of the electrostatic potential
arising from the treatment of the nuclear charge Ze and the screening
due to remaining inner nonexcited electrons. Different expressions of
the effective charges are used for K and L shells and consideration is
given to the presence of outer electrons in higher energy levels that
modify the binding energy of the inner shell electrons. Solving the
Schrödinger equation in the revised simplifi ed potential leads to ana-
lytical solutions that can be easily calculated for K shells using pro-
grams developed by Egerton (1996). The treatment of L shells, although
initially unsuccessful due to the simplifi cations of the hydrogenic
model, was revised by considering experimental optical and energy
loss data with built-in corrections. These modifi cations have led to
improved accuracy in the treatment of L shells for transition metals;
programs and models for L shells are also available (Egerton, 1996) in
the literature and in commercial EELS analysis programs (the Digital
Micrograph software from Gatan). Empirical modifi cations of the
hydrogenic models for M edges have also been developed (Luo &
Zeitler, 1991). The Hartree–Slater (HS) approach requires iterative solu-
tions that lead to more accurate cross sections that consider a potential
calculated based on the charge density of the electrons in a self-
consistent manner. Cross section tabulations have been developed by
Leapman et al. (1980) and Rez (1982) and the results have been imple-
mented within commercial EELS analysis software for K, L, and M
shells within Digital Micrograph. The HS model predicts more realistic
shapes of edges and includes corrections for sharp features related to
unoccupied bound states present on transition metal L edges. Recent
developments allow the combination of solid-state effects near the edge
threshold, calculated from band structure techniques, with the atomic
models at higher energy losses into more accurate cross section models
(Potapov et al., 2004).
3.4.1 Angular and Energy Dependence of the GOS
Some physical insight into the scattering process is given by the analy-
sis of the angular and energy dependence of the GOS df(q,E)/dE, known
as the Bethe surface, as plotted for the C K edge (Figure 4–41a). This
plot also provides information related to the optimization of the acqui-
sition conditions as it shows the dependence of the differential cross
section on angle and energy loss. There are two regions of key impor-
tance on the Bethe surface. At energy losses just above the threshold,
the distribution is peaked at small scattering angles (θ = 0, q → 0) and
the angular dependence in the cross section d
2
σ/dΩdE is controlled by
322 G. Botton
a)
b)
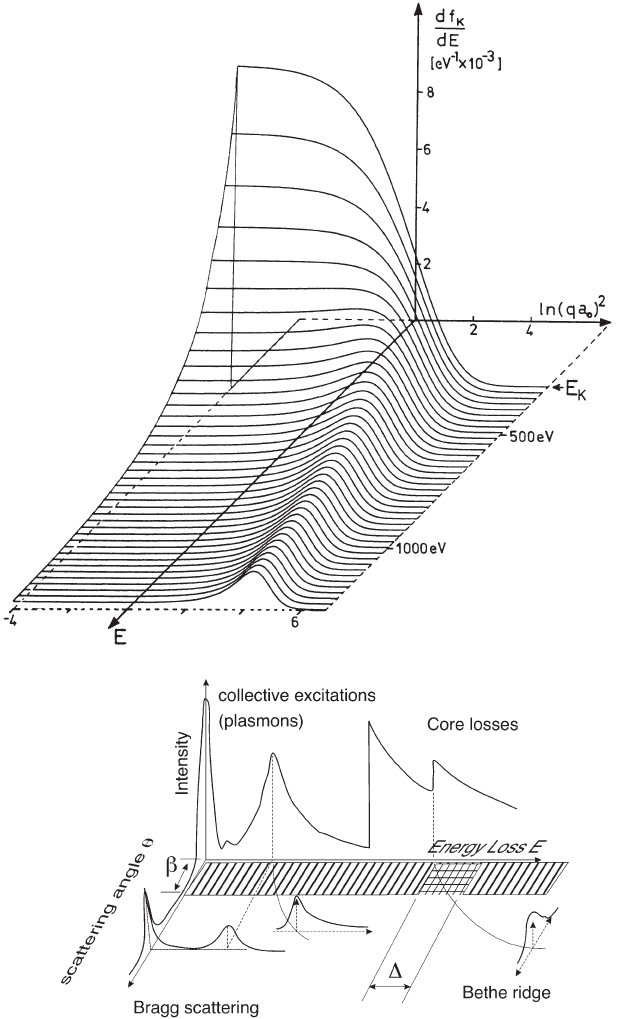
Figure 4–41. (a) Two-dimensional angular and energy distribution of the general oscillator strength
per unit energy loss (df/dE) for the CK edge (also described as the Bethe surface of scattering). The
“hump” at high energy from the edge onset and large scattering vector q is the Bethe ridge. (From
Egerton, © 1996, with permission from Springer Science+Business Media.) (b) Two-dimensional sche-
matic plot of the full energy and scattering angle distribution of inelastic losses including plasmon
losses, core losses, as well as the Bethe ridge and the plasmon dispersions. The diagram shows the
elastic scattering as part of Bragg peaks (as in a crystalline sample). Scattering from atoms or amor-
phous samples would give rise to a broad peak centered at zero scattering angle. The angle (β) and
energy (∆) integration windows for the calculations of the partial cross sections are identifi ed. (Adapted
from Schattschneider and Werner, 2005.)

Chapter 4 Analytical Electron Microscopy 323
the kinematic term of the cross section since the GOS does not vary
strongly with q at small scattering angles. This region of the GOS is
known as the dipole region and represents collisions with a large
impact parameter b (see Figure 4–40 and Section 5.2) and little momen-
tum transfer. Spectra acquired with small scattering angles in electron
energy loss experiments are thus equivalent to optical (X-ray) absorp-
tion spectra where only dipole transitions are allowed. Based on this
equivalence, photoabsorption spectra can be used to improve GOS
models for use in cross-sectional calculations (Egerton & Leapman,
1995; Egerton, 1993). The dipole transitions also imply that the change
of angular momentum quantum number 艎 when the electron is ini-
tially excited from a core level “i” to a fi nal level “f” is ∆艎 = ±1.
At larger energy losses from threshold, corresponding to collision
with nearly-free electrons, the GOS peaks at large scattering angles θ
C
= (E/E
0
)
2
corresponding to what is known as the Bethe ridge. Experi-
mentally, this peak can be readily visualized by collecting energy loss
spectra in thin samples with a spectrometer aperture centered few tens
mrad off the transmitted beam collection angle (thus away from the
forward scattered direction). This acquisition condition is equivalent
to Compton scattering experiments between an incident electron
and a free electron. As discussed in a review by Schattschneider and
Exner (1995), a quantitative analysis of the width of this experimental
peak provides information on the momentum distribution of atomic
electrons. Similarly, by recording diffraction patterns of thin speci-
mens with an energy fi lter (see Section 2.4.1) at high energy loss (few
hundred electronvolts) it is possible to see a ring corresponding to the
Compton scattering peak (Mayer et al., 1995; Egerton, 1996). The full
energy and scattering angle dependence of the entire spectrum includes
therefore the various processes of low-loss scattering (including the
dispersion of plasmon losses, the elastic Bragg scattering (in crystalline
specimens) and the core losses (with the Bethe ridge visible) (Figure
4–41b).
3.4.2 Partial and Total Ionization Cross Sections
Whether we have to compute cross sections for quantifi cation of EDXS
or energy loss spectra, the differential cross sections have to be inte-
grated with respect to angle and energy loss to yield partial or total
cross sections. In the case of energy loss experiments, the spectra are
recorded with a fi xed collection angle β and the partial cross section
is therefore related to the double differential cross section through
integration up to an angle β
d
dE
R
Em v
df q E
dE
d
σ
π
θ
θθ
θ
β
≅
(
)
+
()
∫
4
2
2
0
22
0
22
,
E
(30)
where the GOS is expressed in terms of the scattering vector q and the
scattering angle is θ. By considering the kinematics of scattering (Figure
4–40), q
2
≅ k
2
0
(θ
2
+ θ
2
E
) and the integration can be either carried out over
θ or, after transformation of variables and limits of integration, over q
(Egerton, 1996). The partial cross section follows a simple trend as dσ/
dE ⬀ E
−s
where s is the slope of the function.

324 G. Botton
For the purpose of quantifi cation in energy loss spectroscopy (see
Section 4.2), core shell edge spectra acquired with a collection angle β
are integrated over an energy window ∆. The integrated signal for a
given collection angle β and energy window is thus related to the
partial cross section as
I
1
k
(β,∆) = NI
0
σ
k
(β,∆) (31)
where N is the number of atoms per unit area, I
0
is the incident intensity
(approximated by the number of counts under the zero-loss peak), and
σβ
σ
k
E
E
d
dE
dE
k
k
, ∆
∆
(
)
=
+
∫
(32)
Examples of the values of partial cross section for light elements as
a function of collection angle β are shown in Figure 4–42. These plots
Figure 4–42. Angular dependence of the partial cross sections for lighter
elements. The energy integration is carried out over an energy window ∆
equivalent to 0.2 E
k
where E
k
is the threshold energy. (From Egerton, © 1996,
with permission from Springer Science+Business Media.)