Gardiner V., Matthews H. The changing geography of the United Kingdom
Подождите немного. Документ загружается.

DANIEL DORLING AND MARY SHA
246
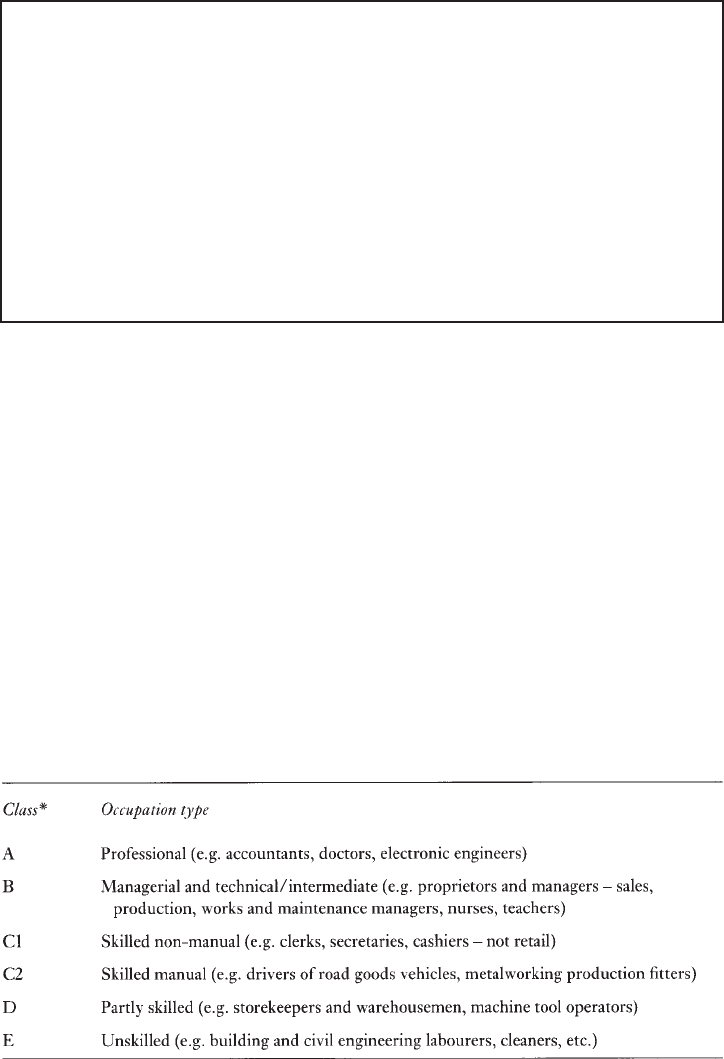
Question 2: What is your occupational class?
To which of the following occupational categories do you belong? (If you are not
currently working refer to your last full-time occupation; if you have never worked
use your partner’s or parent’s class.)
Men Women
A or B +3 +2
C1 +1 +1
C2 0 0
D -2 -1
E -4 -2
The classification of social classes shown in Question box 2 refers to thousands of
occupations which cannot be listed here (for more information see OPCS 1992). Table 12.5
indicates the type of occupations in each category.
Once current class is added as a factor our two students’ chances diverge even further.
Neither have a current occupation and so both have to use their parent’s. Gary’s dad has
been a caretaker in the local school since the shipyard closed and so his life expectancy falls
to 70, whereas Victoria’s father now manages a firm of accountants and so hers rises to 84.
Why should current social class matter so much and why can we use a relative’s or
partner’s class as a proxy? To answer the second part of that question first, most people
when they get an occupation tend to have a similarly graded occupation to their parents and,
as men were more likely to work than women in the past, we use father’s occupation as the
best proxy.
Different explanations have been put forward to explain social class patterns in health
and mortality (these are outlined in the Black Report, which is usually taken as the starting
point for the analysis of such differentials: DHSS 1980). The first explanation is artefact:
TABLE 12.5 Occupational classification
Source: Drever and Whitehead (1997).
Note: *These classes are also referred to as I, II, III non-manual, III manual, IV and V.
LIFE CHANCES AND LIFESTYLES
247
that problems of measurement and the classification of social classes produce the pattern
observed. While there are indeed some problems of this nature, these do not account for
social class differences.
The second possible explanation is natural or social selection, a theory which suggests
that those who are most fit will rise to the top of the social strata and those who are ill or
weak will drop to the bottom. So here the argument is that health differences produce social
class differences, rather than the other way around. While this may be the case for a small
minority, particularly those who are most marginalised, there is evidence that selection only
accounts for a small proportion of differences by social class. For example, most social
class mobility occurs early in working life (Blane 1985).
A third explanation refers to material and structural factors. This concerns
differences between individuals which are the result of socio-economic structural
factors, rather than individual lifestyle factors (discussed next). This explanation places
emphasis on an individual’s position in society in terms of their class background
affecting their education, which then affects their labour market position and their
income, which consequently affects their health through their material living conditions
such as housing.
A fourth explanation of social class differences in health focuses on the cultural,
behavioural and lifestyle factors that are associated with poor health outcomes. This
explanation says that people in lower social classes are more likely to smoke, to have a poor
diet, and so on, and that these behavioural differences lead to different health outcomes.
There is some evidence to support this theory (for example, that a greater proportion of
those in lower social classes smoke) but again, this only accounts for a minority of the class
difference observed.
All of these different types of explanations are likely to play a role, to a greater or
lesser degree, in explaining social class differences in health. We cannot easily isolate one
explanatory factor, as they are interconnected. For example, behaviours are a social as well
as individual phenomenon—what may seem like an individual choice may be framed by
constraints imposed by class. Victoria, for example, may like to spend her time going to
polo matches at Cowdray Park and Gary may prefer playing darts in the local pub—these
are individual behaviours which are shaped by class.
Class introduces an important factor which complicates the estimation of life
expectancy here—that of confounding. Confounding means that the different factors
we are considering are interconnected, and we need to take this into account. For
example, unemployment is concentrated geographically, lower social classes smoke
more, men and women have different dietary habits. In the statistics shown here
confounding is taken into account, where possible, by using studies which control for
such factors.
The Question 2 box referring to class differentials in life expectancy (Drever and
Whitehead 1997) gives a difference of seven years of life expectancy between occupational
classes I and V for men, and a four-year difference for women.
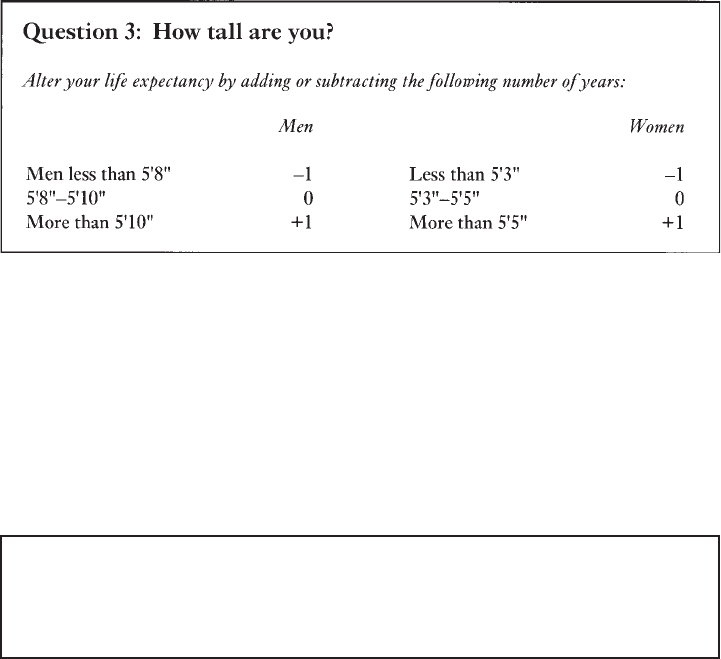
Height
A good example of the effect of confounding is height. A number of studies have reported
that height and mortality are related, such that taller people live longer. For example, findings
DANIEL DORLING AND MARY SHA
248
from the Whitehall study (Davey Smith et al. 1990) show that height is inversely associated
to all cause mortality, coronary heart disease (CHD) and non-CHD mortality. While height
was also related to car ownership and employment grade and other risk factors, controlling
for these factors did not abolish the association between height and mortality. Thus although
height is a confounded variable it is also a valuable piece of independent evidence. Why
should this be? There are two main reasons why height may matter. First, height can be a
proxy for factors such as class. Simple occupational grading does not measure social
advantage as well as does occupational grading in conjunction with height. Second, height
may have simple medical advantages in its own right.
In case you were wondering, Gary, at 5’7" is an inch taller than Victoria, but because
he is under average and she is over—he loses a year and she gains one. Gary is taller than
either of his parents but still one of the shortest when it comes to getting attention at the bar
to buy a drink. Most young people today are taller than their parents were when they reach
adulthood (Usher 1996), but this change has also not been evenly spread across the country,
with height rising fastest in the South where nutrition has been better and in the past people
have been more affluent.
Unemployment
Question 4: Have you been unemployed for the past three
months?
If so deduct two years.
Unemployment carries a risk of premature mortality (Drever and Whitehead 1997).
However, this is not because the unemployed are more likely to be ill or because they
are more likely to be from a lower social class (they are likely to be both of these
things, but when we take these into account the effect is still apparent). Data from the
British Regional Heart Study has shown that differences in mortality between employed
and unemployed men remains after adjustment for factors including smoking and alcohol
consumption (Morris et al. 1994). Why should this be? There are many reasons.
Unemployment decreases a person’s income and status, and so the same factors that
LIFE CHANCES AND LIFESTYLES
249
apply in the case of social class apply here. But in addition to this unemployment carries
an extra social stigma of being rejected from the world of work for which most adults
have been trained and conditioned. Work is central to our identity—one of the first
things we want to know about a person when we meet them is what they do for a living.
Unemployment can lead to depression and even despair and hence can cause
psychological ill health which in turn affects physical health and life expectancy. Most
directly, unemployed people are twice as likely to kill themselves as compared to the
employed population.
The changing geography of unemployment is one of the most important possible
recent influences on the changing map of mortality in Britain. Soon after 1979 unemployment
in Britain rose to unprecedented levels which, for families, was higher than in the 1930s.
This rise was very much concentrated first in the Celtic periphery then in Scotland and the
north of England and Wales, only spreading to the south of the country by the late 1980s.
The coincidence between the geographies of unemployment and the geography of mortality
a decade later is very high and it is likely that rising inequalities in unemployment have had
a large part to play in rising inequalities in premature mortality.
Let’s return to Gary and Victoria. Victoria has never been unemployed, but Gary
has been unemployed many times since leaving school. Most recently he has just
signed on as unemployed, as his course at university has finished and he hasn’t found
a job. So his life expectancy (or more correctly the life expectancy of people in a
similar situation to Gary) falls to 67, eighteen years below Victoria’s. The main reason
for Gary being unemployed and still finding it difficult to find work is that as a young
man growing up on Teesside in the 1990s his chances of finding a job, regardless of
his individual characteristics, are poor. Unemployment rates vary dramatically
geographically. While Gary was struggling to find work in Teesside, Victoria has
found work during the summer in a tea shop in Chichester to finance her skiing holiday
the following winter.
Geographical influences on health
So far we have only considered demographic and social factors which have indirect
geographical causes and consequences, but there are also direct geographical influences on
health.
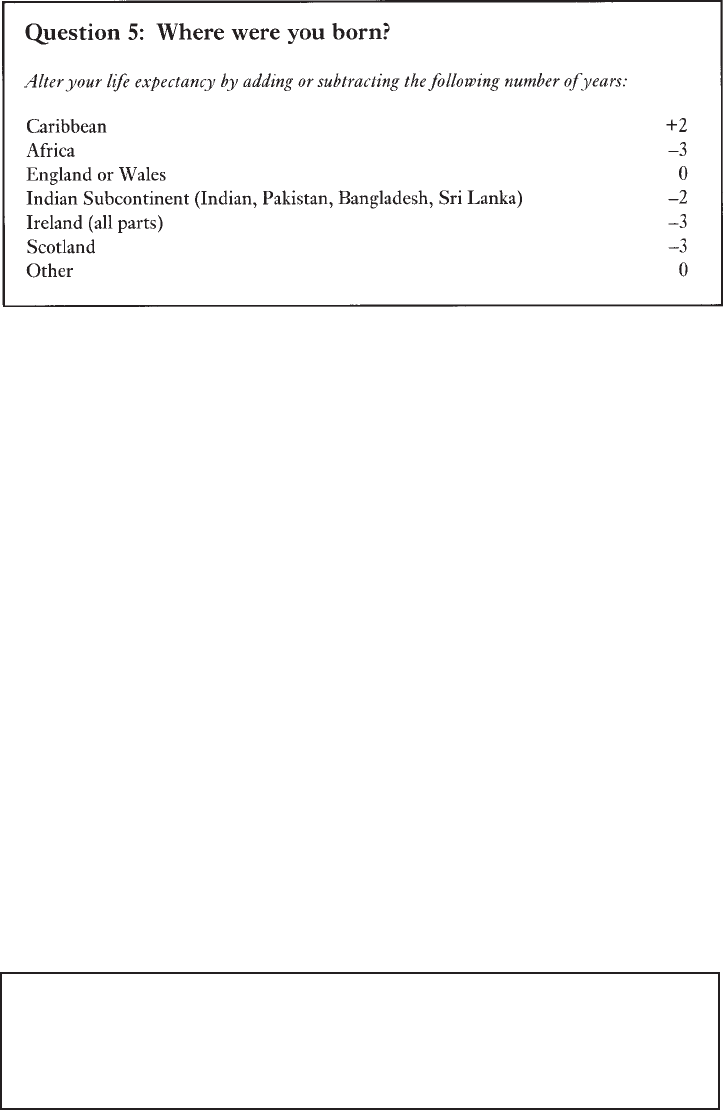
Country of birth
There is well-established evidence that people who live in Britain but were born in different
countries have different life expectancies (see Question 5 box). This is a result of both their
experiences and circumstances when they were young, the selective effects of the migration
that brought them to where they are now, and the effects of the way they are treated once
they have arrived. Britain has welcomed continuous waves of immigrants and at different
times they have tended to settle in different areas in Britain. This may have had a minor
influence on the geography of life chances across the country. Note that in recent years
governments have put laws in place which are implicitly designed to limit the immigration
of black people to Britain.
DANIEL DORLING AND MARY SHA
250
The addition of two years for people born in the Caribbean is likely to be due partly
to the selective effect of the pattern of migration to Britain that occurred mainly in the
1950s and 1960s. In general it was the most mobile and most healthy Caribbean citizens
who came to Britain and so their life expectancies are now higher than the average in this
country. The opposite is true for the more recent migrants from Africa and Asia and also for
people who were born in Ireland. This may be due partly to the ‘push’ factors which brought
many of these people to Britain (as opposed to the ‘pull’ factors for those from the Caribbean)
and also to the effects of living in the parts of the country in which they tended to settle.
However, the country of birth effect that influences the life expectancy of the largest group
of people in Britain is reserved for people born in Scotland. Again, there is no generally
agreed reason why this should be so, but a mixture of factors, including the fact that Scotland
suffered economic recession long before mass unemployment reached England and Wales
in the early 1980s, may well be a factor. These figures were calculated from data published
in Drever and Whitehead (1997).
Both Gary and Victoria were born in England, and so their life expectancies are still
67 and 85. When we looked at social class we referred to the previous as well as the current
generation. There is very little research available about the relative mortality rates of second
generation migrants. Raftery et al. (1990) found that Irish immigrants and second-generation
Irish had raised mortality, and that the effect was not solely a result of social class. However,
they do not say whether they think such findings can be inferred for other ethnic groups.
Thus, although Gary’s mother was born in Scotland we will not adjust his life expectancy as
a consequence. Victoria’s family can trace their origins to the ‘Domesday Book’ and have
lived in southern England ever since.
Region of residence
Question 6: Do you live in England, south of, or in, Gloucestershire,
Warwickshire, Leicestershire or Lincolnshire?
If so add a year, if not subtract a year.
LIFE CHANCES AND LIFESTYLES
251
Many researchers have reported regional inequalities in mortality within the UK. Patterns
have been documented for over a century in Britain, and it is consistently found that
mortality rates are highest in the North and in Scotland and lower in the South. Similar
evidence of a North-South divide is presented by Britton (1990) who, looking at data up
to 1983, argued that there was a continuation, and if anything a worsening, of the regional
gradient in mortality, from high in the North and West to low in the South and East for
both men and women. This is the case for almost all of the main causes of death. In
reference to particular causes of mortality, Strachan et al. (1995) report regional variations
in cardiovascular disease and stroke with a South-East to North-West gradient in mortality,
the North-West having the higher mortality. Similarly, Howe (1986) found regional
differences in heart disease and lung cancer for males; for females the number of deaths
overall from these conditions were less, but the pattern of regional differences was similar
to that for males.
As observed in the Black Report, Britain can be divided into two zones of relatively
high and low mortality (DHSS 1980). Howe (1986) proposes an imaginary line reaching
from the Bristol Channel to the estuary of the Humber separating those experiencing
favourable and unfavourable life chances, whereas Britton (1990) suggests a divide from
the Severn to the Wash separating areas of low and high mortality. The former dividing line
is used here. Again the changing geography of the population may well have a part to play
in the strengthening of this dividing line in mortality in Britain. The population who live
below this line has been growing for the last century, partly due to migration from the
North. If the migrants were less likely to, say, suffer unemployment than those who stayed,
then this changing human geography may have also altered the medical geography of the
country.
Using this geographical division, Gary lives in the northern region and thus loses a
year of life expectancy, taking him to 66, whereas Victoria adds a year as she lives in southern
England. This takes her to 86. These geographical differences in life expectancy are not
merely the effect of the aggregation of particular groups of people in certain places—it is
not just that there are more working-class and unemployed people in the North, for instance.
The differences between areas are a result of the context of a place as well as the concentration
of people who live there. Areas can affect health in a number of ways—there may be
environmental pollution, for example. Also living in a deprived area as opposed to an
advantaged area may mean that you have less access to services which promote good health
—for example, sporting, leisure and community services, and of course health services.
Victoria has many social, cultural and sporting opportunities close to both her home and
university. Where Gary lives there are fewer things to do and young people spend most of
their time hanging around on the streets.
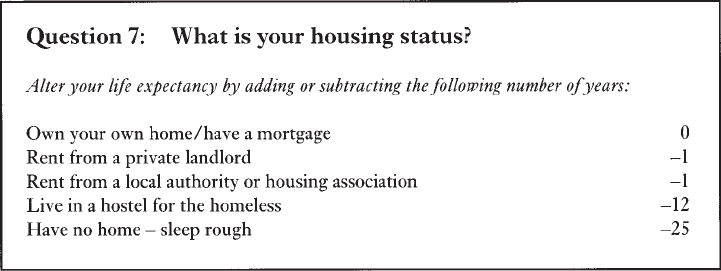
Housing
Housing tenure is also a spatial factor as certain types of housing, for instance council
housing, is often geographically concentrated. Where you live in terms of the type of home
you live in also affects health. The Question 7 box shows the years of life expectancy to add
or subtract according to housing tenure. Tenure patterns have changed particularly rapidly
in the last twenty years—there has been a dramatic rise in the number of owner-occupiers in
the last two decades, rising from 10 million owner-occupiers in 1971 to 16 million in 1993
DANIEL DORLING AND MARY SHA
252
(Dorling 1995). Changes have been partly due to the policy of giving social tenants the
opportunity to buy their property and partly due to the Conservative government’s refusal
to build new social housing. This has led to a residualisation of the social rented sector to
serve particular groups in particular places, which in the extreme concentrates mortality
into particular places. For instance, having a serious medical condition increases your chances
of being allocated a council house whilst decreasing your chances of being granted a
mortgage.
The figures given in the Question 7 box for the traditional housing tenures (owner-
occupation, social housing and private renting) were calculated from data provided in Drever
and Whitehead (1997). These have taken social class and car access into account, so the
effect we observe is not due to these factors. Owning your own home may be beneficial to
health because of the feelings of security and pride it creates. Alternatively, living on a
council estate may adversely affect health if people are confronted with day-to-day problems
such as poor levels of maintenance, and higher than average vandalism and crime. While
the privately rented sector is very mixed the lower life expectancy of this group is probably
due to the fact that on aggregate this type of accommodation is likely to be of poorer quality.
Two groups stand out from the Question 7 box, however—hostel residents and the
street homeless. There is much data available on the health problems encountered by homeless
people. Bines’ survey (1994), the most comprehensive study of the extent of health problems
in the homeless to date, found that people using hostels, living in temporary bed-and-breakfast
accommodation and sleeping rough had many physical and mental health problems
(including musculoskeletal problems, chronic chest or other breathing problems, and
depression and anxiety) at a much greater rate than the general population. It is those who
sleep rough, however, who experience the worst health problems, due to exposure to the
elements, lack of good nutrition, lack of access to washing facilities, and so on. While we
have some data on the health problems of the homeless, there is much less evidence, however,
about their mortality. The source used, referring to mortality rates of hostel residents and
rough sleepers, is Shaw (1998a). Homeless people are more likely than the general population
to die from causes of deaths such as suicide and homicide, pneumonia, bronchitis and TB,
and drug- and alcohol-related causes of death.
Victoria’s parents bought her flat for her when she moved to Bristol. This not only
provides her with a home during her studies but is also a sound investment for her parents.
LIFE CHANCES AND LIFESTYLES
253
Gary rents privately with other students. His life expectancy consequently falls to 65 and
the gap between them is twenty-one years. Tenure thus represents many things other than
current income, family inheritance and wealth being among them.
Behavioural influences on health
In this section we consider actions which affect health which, while having social
determinants (as discussed above) and geographical dimensions, are those factors over which
the individual has most control. The factors we include here are the four main health-related
behaviours: smoking, alcohol consumption, diet and exercise. We also refer to weight, which
is related to these, and briefly cover a less common but far more dangerous activity, injecting
illegal drug use.
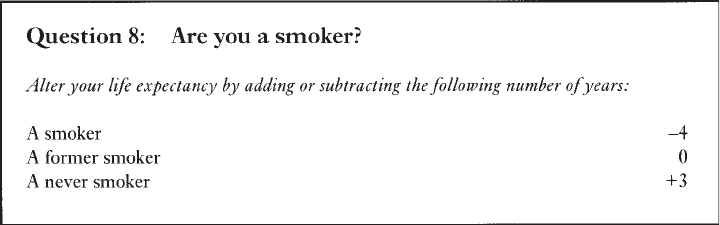
Smoking
The adverse effects of smoking on health are perhaps the most well-known of all health
effects. Approximately 120,000 people die prematurely in the UK each year due to smoking.
The question below shows the average life expectancy lost by a smoker—there is a seven-
year difference between a smoker and someone who has never smoked. There are also
differences according to the amount and type of cigarettes smoked, but for the sake of
simplicity we have used three categories in the Question 8 box. These rates were calculated
from findings published by Doll et al. (1994).
Since the age of 13 Gary has smoked on average twenty cigarettes a day (his parents
both smoke and his grandfather died of lung cancer). Victoria, on the other hand, has never
smoked (taking a few drags of a cigarette at a summer ball at the age of 15 doesn’t count).
While undoubtedly an individual exerts a choice over whether to smoke or not, there are
also social and cultural aspects to this behaviour, as those who are brought up in a household
where their parents smoke are more likely to smoke themselves. People in Gary’s situation
are most likely to die at 61 whereas Victoria’s contemporaries—those who act like she acts
and have the advantages that she has—will live, on average, to 89.
Just as there is a geographical dimension to every other factor affecting health and
lifestyles there is also a spatial dimension to smoking. It is easier and more acceptable to
smoke in areas where it is more usual to smoke and thus the geography of smoking is self-
DANIEL DORLING AND MARY SHA
254
reinforcing. For instance, in those parts of Britain where it is less usual to smoke, fewer
cafés and bars will allow smoking and it is more difficult to buy cigarettes. Where smoking
is more usual it is more difficult, particularly as a child, to avoid smoking. The effects can
clearly be seen when particular causes of death related to smoking, such as lung cancer, are
mapped. What is not so clear is whether changes in the prevalence of smoking have had a
great effect on the geography of mortality in Britain. This is because smoking rates have
fallen fairly uniformly across the country.
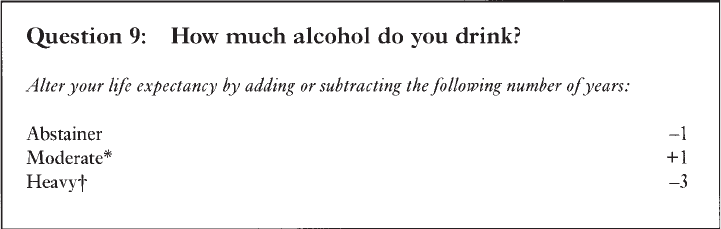
Alcohol consumption
Alcohol consumption also affects health and life expectancy, but the nature of the relationship
is rather different to that for smoking. Also, very little is known about the changing geography
of alcohol consumption.
A moderate intake of alcohol has a protective effect. Those who do not drink alcohol
at all have a year of life expectancy less than those who drink moderate amounts. Those
who drink over the recommended amounts lose three years.
Gary qualifies as a heavy drinker, as he regularly meets his mates in the pub for
more than a few beers. Victoria is a moderate drinker, tending to have a glass of wine with
her evening meal. When she goes out with her friends she drinks sparkling mineral water
and the occasional glass of Pimms. His life expectancy is thus 58 and hers is now 90.
Again these are individual behaviours which have a clear social component, as drinking
habits are as much learnt from one’s cultural context as they are an individual creation.
The map of deaths from cirrhosis of the liver is a good proxy for the map of excess
drinking in Britain.
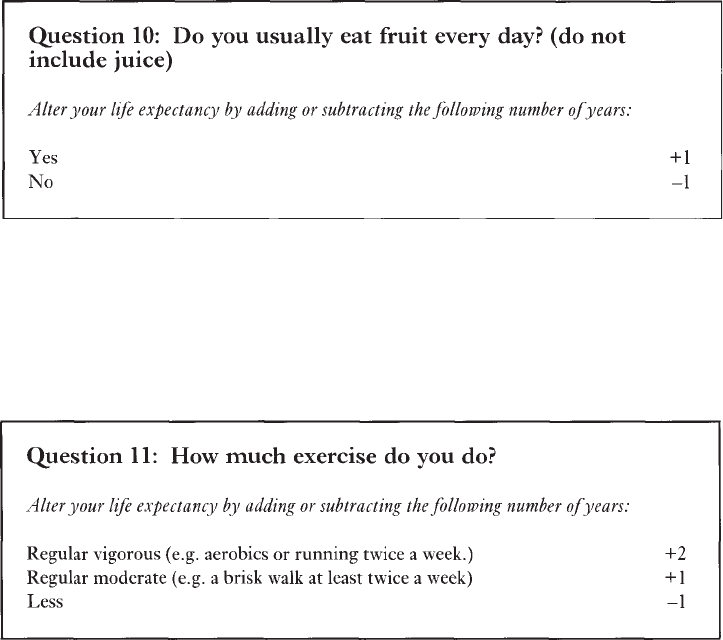
Diet
Eating a healthy diet is also a factor which affects health and life chances. Diet is particularly
associated with cardiovascular disease, and also bowel and stomach cancer. Eating habits
are very difficult to measure, however (Shaw 1998b). In particular, changes in the geography
of eating habits are very under-researched. The rising importance of supermarkets means
that those without a car who do not live near a supermarket may now have to spend more on
LIFE CHANCES AND LIFESTYLES
255
a more restricted choice of foodstuffs. Here we use a simple question which refers to just
one aspect of a healthy diet.
Gary was always told by his mother to eat his greens, but basically he’s a pie and
chips kind of man. He eats fruit now and then, but not usually every day. Victoria on the
other hand is a vegetarian (although she eats fish) and loves to eat fresh salads and vegetables.
She makes it a part of her health routine (which also includes exercise and skin-care) to eat
fresh fruit every day. Gary’s life expectancy is now 57 and Victoria’s is 91.
Exercise
Physical fitness has an independent impact on health—those with sedentary lifestyles
have lower life expectancies compared to those who regularly exercise. The changing
geography of exercise is unknown but it is likely that two factors play a large part. First,
the decline in walking and manual labour has reduced exercise. Second, exercise is now
seen as a recreational activity in some places more than others. Both these factors are
likely to have changed the map of exercise and hence have had an impact on the map of
mortality.
Victoria plays tennis and also goes to aerobics, so she adds two years. Gary is a bit of
a couch potato (he plays a bit of footie every other Sunday with his mates, but that is not
twice a week and they almost always end up in the pub afterwards). Gary’s life expectancy
(and that of many of his mates) is now 56 and Victoria’s is now 93.