Fahlman B.D. Materials Chemistry
Подождите немного. Документ загружается.


Auger electron (Figure 7.15b; Auger electron spectroscopy (AES) will be discussed
later). Especially for ele ments with Z > 11 (i.e., >Na), the electronic shell structure
becomes exceedingly complex, which results in electronic transitions that are
possible from a number of outer shells (Figure 7.17, bottom).
Typically, a variety of X-rays are produc ed during atomic relaxation due to a
cascading effect. For instance, a vacancy in the K shell may be filled with an electron
in an L shell (K
a
emission); the resulting vacancy in the L shell may then be filled
with an electron from the M shell (L
a1
emission), and so forth. By counting the
number and energies of X-rays produced from electrons interacting the sample, it is
possible to both qualitatively and quantitatively (using suitable standards) determine
the chemical composition of the surface being analyzed.
There are two methods used to identify and quantify the X-ray emission: energy-
dispersive X-ray spectros copy (EDS), and wavelength-dispersive X-ray spectros-
copy (WDS).
[36]
In EDS, all of the characteristic X-ray energies reaching the
detector are measured simultaneously. Hence, data acquisition is very rapid across
the entire spectrum. By contrast, WDS measures a single wavelength at a time
through use of a detecting crystal. As the characteristic X-rays are emitted from the
sample, they are diffracted in a regular manner as discussed previously. Not only
does this improve the resolution of WDS to an order of magnitude greater than EDS
(Figure 7.18),
[37]
but als o improves the count rate and deconvolution of overlapping
spectral peaks. Nevertheless, due to its simplicity and speed of analysis, EDS is the
standard method for chemical analysis within TEM (and SEM) instruments. Typi-
cally, if WDS is desired, an instrument known as electron probe microanalyzer
(EPMA) is utilized, often in tand em with SEM imaging.
The spatial resolution of X-ray microanalysis may be described by Eq. 8.In
general, prerequisites for the best spatial resolution include a high-energy electron
beam and extremely thin samples. Though the resolution limits of EDS/WDS will
never match the imaging resolution, it is now possibl e to easily determine the
elemental composition of individual nanoclusters in the 1–5 nm size regime – as
long as they are suitably dispersed with respect to one another (Figure 7.19 ):
R ¼
d þ
ffiffiffiffiffiffiffiffiffiffiffiffiffiffiffiffiffiffiffiffiffiffiffiffiffiffiffiffiffiffiffiffiffiffiffiffiffiffiffiffiffiffiffiffiffiffiffiffiffiffiffiffiffiffiffiffiffiffiffiffiffiffiffi
7:21 10
5
Z
E
o
r
A
1=2
t
3=2
2
þ d
2
r
2
;ð8Þ
where R is the X-ray spatial resolution; d, the beam diameter ; E
o
, the beam energy
(eV); r, the specimen density; and t is the specimen thickness (cm).
In particular, it is possible to overlay the image with the EDS data – a technique
known as elemental dot-mapping, widely used for SEM/EDS analysis (Figure 7.20).
Scanning transmission electron microscopy
An imaging mode that merges both SEM and TEM is also possible on most modern
TEM instruments. This method, referred to as scanning transmission electron
microscopy (STEM), uses a LaB
6
source that produces a focused electron beam
608 7 Materials Characterization
with a high current density and extremely small diameter. Instead of monitoring the
transmitted electrons from a static beam as performed in standard TEM imaging, the
beam within a STEM is scanned across the sample – analogous to SEM. Due to a
higher beam intensity, thicker samples may be analyzed in a STEM; furthermore,
staining is generally not necessary for low-Z elements due to a higher sensitivity to
sample density/composition.
The majority of STEM instruments are simply conventional TEMs with the addi-
tion of scanning coils. As a result, these ‘non-dedicated STEMs’ are capable of TEM/
STEM, as well as SEM imaging for thicker samples. The development of HRTEMs
and ‘dedicated’ STEMs with lens aberration correction
[41]
have now pushed the
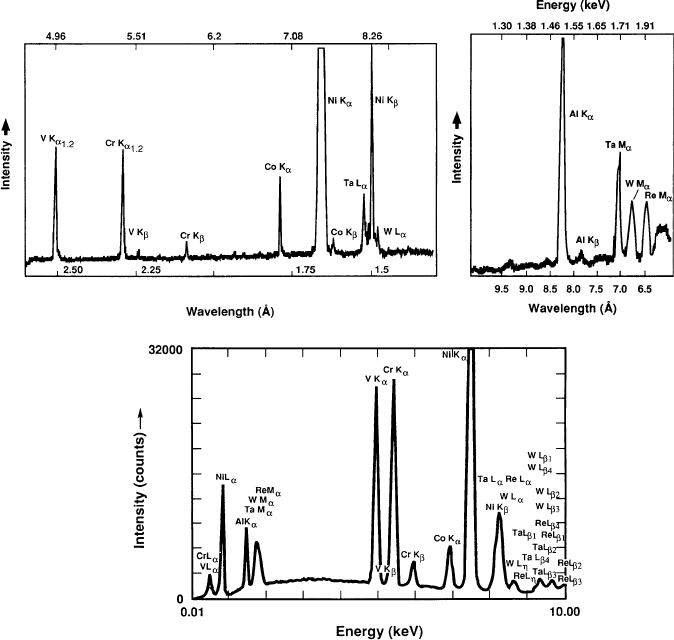
Figure 7.18. Comparison of WDS (top), using LiF and thallium acid phthalate (TAP (1010), respectively)
and EDS for the analysis of a superalloy. A number of X-ray spectral lines such as Ta La,NiKb, and
WLa are hardly discernible using EDS, but readily visible using WDS analysis. Reproduced with
permission from Goldstein, J.; Newbury, D.; Joy, D.; Lyman, C.; Echlin, P.; Lifshin, E.; Sawyer, L.;
Michael, J. Scanning Electron Microscopy and X-Ray Microanalysis, 3rd ed., Kluwer: New York.
Copyright 2003 Springer Science and Business Media.
7.2. Electron Micros copy 609
resolution limits to as low as sub-50 pm, i.e., 0.5 A
˚
– suitable for facile atomic-
resolution imaging.
[42]
Coincidentally, the introduction of this powerful TEM in 2009
comes exactly 50 years after Feynman’s famous speech (Appendix B), in which he
challenged the world to increase the resolution limits of electron microscopes!
In a dedicated STEM, high-angle (elastically) scattered electrons are separated
from inelastic/unscattered electrons through use of a high-angle annular dark-field
(HAADF) detector (Figure 7.21). Since there are no post-sample refocusing lenses,
it is not possible to generate a bright-field image as is standard using a conventional
(HR)TEM. Instead, the image is based on specific interactions between the electron
beam and sample atoms (i.e., elastic/inelastic scattering, unscattered electrons).
Since the incoherently scattered electrons are related to elastic scattering, they are
directly related to the structure and chemical composition of the feature being
imaged (Figure 7.22).
[43]
In particular, the incoherent scattering of an electron is
described by the Rutherford equation (Eq. 9). This equation predicts that the
intensity of the scattered electrons, and resultant image contrast, is strongly depen-
dent on atomic number of the sample atoms. Hence, HAADF–STEM is also referred
to as Z-contrast imaging. It should be noted that HAADF–STEM is strongly
dependent on variations in sample thickness.
[44]
That is, thicker regions of a sample
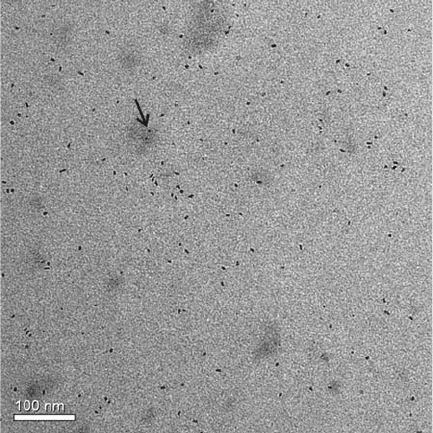
Figure 7.19. Ambiguity in assigning a chemical composition (iron oxide) to individual nanostructures
based on TEM/EDS. The small and large nanoparticles are in the same vicinity on the grid; Depending on
the area selected for analysis, it may be difficult to definitely state if one (or both) comprise iron oxide
(e.g., arrow region). However, by also looking at the relative contrast of the nanoparticles, it is likely that
the smaller structures contain iron (higher density) and the larger nanoparticles comprise lighter elements
(e.g., a carbonaceous, organic-based nanostructure).
[38]
610 7 Materials Characterization
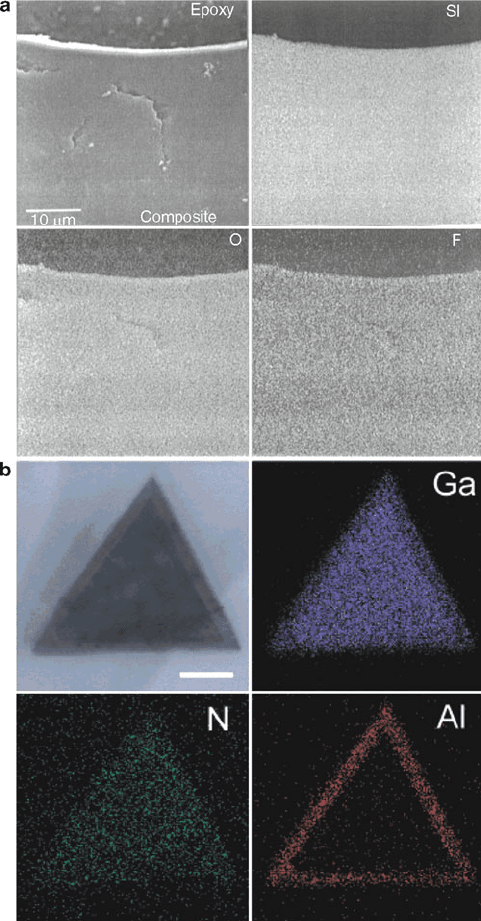
Figure 7.20. Elemental dot-maps. Shown is (a) elemental concentrations of Si, O, and F (as white pixels)
overlaid onto the SEM image of a Nafion resin/silica composite;
[39]
(b) bright-field STEM image of a GaN/
AlN/AlGaN nanowire cross section, with elemental mapping of Ga, N, and Al (scale bar is 50 nm).
[40]
7.2. Electron Micros copy 611
will result in higher image intensities, which may be falsely interpreted as the
presence of species with relatively high atomic numbers:
dsðyÞ
dO
¼
e
4
Z
2
16ðE
o
Þ
2
sin
4
ðy 2
=
Þ
ð9Þ
where ds (y)/dO is the different scattering cross sections as a function of the
scattering angle (y); E
o
, the incident beam energy; e, the electron charge
(1.602 10
19
C); and Z is the atomic number of the scattering nucleus.
A primary limitation of EDS and WDS is the inability to detect light (i.e., low-Z)
elements. Since atomic energy levels are closely spaced for low-Z elements, the
energies of the emitted X-rays will be relatively low.
[45]
As a result, they are masked
by the broad, continuous background spectrum (known as bremsstrahlung
[46]
) that is
most intense at energies below 1 keV. Furthermore, the char acteristic X-ray lines are
less intense for low-Z elements since they exhibit a low X-ray fluorescence yield –
favoring non-emissive Auger
[47]
electron processes rather than X-ray generation
(Figure 7.23). Consequently, it becom es increasingly more difficult to observe X-ray
lines from elements with Z < 11 (Na). Recently, there have been improvements in
the design of EDS windows, which separate the detection system from the electron
microscope.
[48]
Since low -energy X-rays are readily absorbed, new detector designs
feature ultrathin windows and lightweight compositions that facilitate the detection
of elements down as far as beryllium (Z ¼ 4). However, the analysis of these
elements by EDS/WDS is semi-quantitative, at best.
Condenser
lens
Scan
Coils
Objective
lens
Object
CCD
Incoherent Imaging STEM
Bright Field
Detector
Bending Magnet
(EELS)
Source (100, 300 kV
Field Emission Gun)
Annular Detec-
tor (Z-Contrast
Dark Field
Imaging)
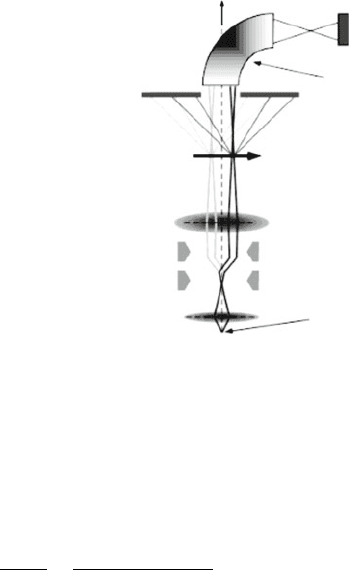
Figure 7.21. Schematic of a dedicated HAADF–STEM. Reproduced with permission from McBride, J. R.;
Kippeny, T. C.; Pennycook, S. J.; Rosenthal, S. J. Nano Lett. 2004, 4, 1279. Copyright 2004 American
Chemical Society.
612 7 Materials Characterization
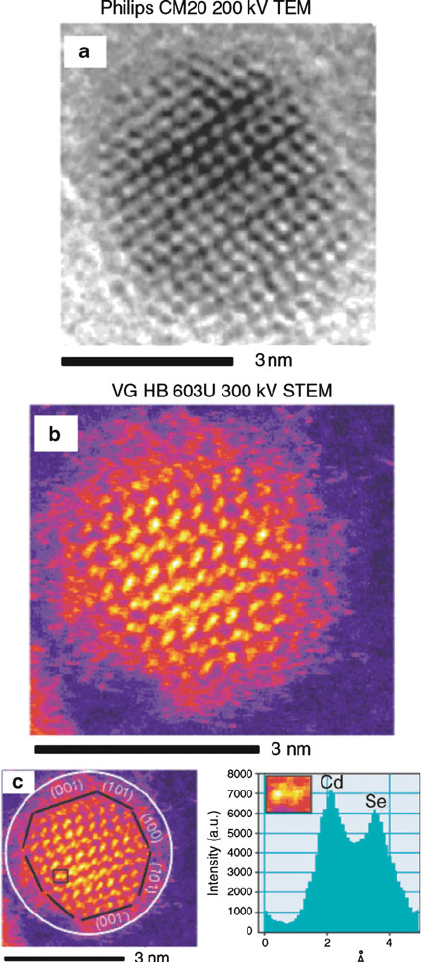
Figure 7.22. Comparison of conventional HRTEM (a), with HAADF–STEM (b). Also shown (c) is the
chemical analysis of an individual CdSe “dumbbell.” The white circle shows the amorphous oxide region,
and the surface of the nanocrystal is outlined in black. Unlike conventional HRTEM, it is also possible to
label the individual nanocrystal facets, such as Cd-rich (001) and Se-rich (001
0
). Reproduced with
permission from McBride, J. R.; Kippeny, T. C.; Pennycook, S. J.; Rosenthal, S. J. Nano Lett. 2004, 4,
1279. Copyright 2004 American Chemical Society.
7.2. Electron Micros copy 613
Electron energy-loss spectroscopy
In order to increase the sensitivity toward the detection of light elements, a technique
known as electron energy-loss spectroscopy (EELS) may be utilized.
[49]
This method
may be carried out within a (S)TEM, and consists of monitoring the loss in energy
(due to inelastic scattering) of the beam electrons as they pass through the sample.
Since it is more difficult to focus X-rays relative to electrons with appropriate lenses,
the collection efficiency for EELS is ca. 80–90%, relative to 5–6% for EDS. This
leads to a greater sensitivity and spatial resolution for EELS, with elemental mapping
of ca. 2A
˚
. The intensity is greater than EDS for light elements since the signal
generated by EELS represents the total sum of the number of X-ray photons and
Auger electrons emitted from the sample. This technique is useful for elements with
Z > 1, and like EDS, is amenable for elemental mapping of a sample surface.
As illustrated in Figure 7.21, a dedicated STEM is usually fitted with an EELS
detector, which collects the low-angle scattered electrons that pass by the HAADF.
Although the beam electrons have energies of several hundred keVs, the electrons
being transmitted through the sample only have energies on the order of a few
eVs. In order to perform EELS, it is therefore necessary to detect very small differ-
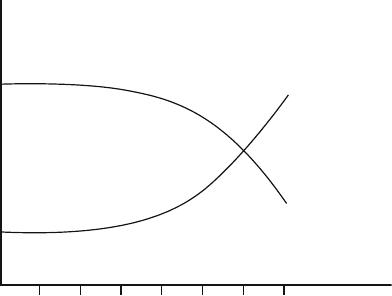
ences in the kinetic energies of the electrons. This is accomplished using a magnetic
prism that exerts a centripetal force on each electron, causing a circular motion. While
in the magnetic field, electrons move along the arc of a circle, whose radius is based on
the speed and kinetic energy of the electron. In reality, there is nothing new with this
concept; a magnetic prism is actually analogous to the dispersion of white light into a
colored spectrum using a glass prism. However, unlike a glass prism, the magnetic
field focuses the electrons as they exit the field, generating a spectrum from the
grouping of electrons that exhibited identical energy losses.
1
0
X-ray yield
Auger yield
Yield per K-shell vacancy
5101520253035
Atomic Aumber (Z)
Figure 7.23. Relative probabilities for X-ray and Auger electron emission during the decay of K-electron
vacancies.
614 7 Materials Characterization

In addition to detecting/quantifying partic ular elements in a sample, EELS also
provides detailed elemental information such as the electronic structure, bonding,
and nearest neighbor distribution of the atoms in the sample.
[50]
A representative
EELS spectrum for a NiO surface is shown in Figure 7.24. The most intense featur es
are peaks corresponding to zero-loss – those electrons that were either unscattered,
or elastically scattered, while traversing through the sample. At relatively small
energy losses (ca. 5–25 eV), a plasmon peak is observed which corresponds to the
collective oscillation of many outer-shell (valence or conduction) electrons. The
most useful application for this peak is the accurate determination of the sample
thickness, of up to several thousand nanometers with a precision of a few percent
(Eq. 10).
[51]
More recently, the plasmon region of the spectrum has been used to
delineate variations in the size and geometry of metal nanoparticles.
[52]
As we saw in
Chapter 6, the plasmon resonance frequency is directly related to the effective
nuclear charge and size/shape of the charge distribution. Hence, the low-loss region
of an EELS spectrum also provides information about bonding interactions and the
dielectric function of the sample.
T / log
I
p
I
z
;ð10Þ
where T is the sample thickness; I
p
, the intensity of the plasmon peak; and I
z
is the
intensity of the zero-loss peak.
At higher energy losses, an EELS spectrum will exhibit a variety of sharp
features kn own as “edge s,” which are diagn ostic for the presen ce of spe cific
elements. The positions of the edges correspond to the binding energies of the
core electrons in the sample. As shown in Figure 7.24 (top), the K-edges for O and
Ni are 5 30 and 860 eV, respectively. Once th e background is subtracted, the area
under each edge pea k(s ) is integrated in or der to determine the elemental con-
centrations. The shape of the peak immediately surro unding the edge is aptly
referred to as the electron-loss near-edge structure (ELNES). As you might expect,
these features are directly dependent on the exact band diagram and density of
states (DOS) of the solid being analyzed. A s such, this profile may be considered
as the electron-sc attering counterpart of X-ray a bsorption n ear-edge structure
(XANES).
[54]
This region of the spectrum relates to the electronic structure,
oxidation state, and bonding hybridization/symmetry of the desired element
(Figure 7.24 (bottom)).
[55]
Whereas the ELNES region typically extends to ca. 20 eV beyond the edge, the
extended energy-loss fine structure (EXELFS) provides chemical information from
the scattering of electrons by neighboring electrons. Accordingly, this region of
the EELS spectrum is the electron-scattering counterpart of extended X-ray absorp-
tion fine structure (EXAFS);
[56]
both being used to determine nearest-neighbor
distances, oxidation states, and coordination numbers of the element being probed
(see Figure 7.24 (bottom)).
The spectral fine details from EELS result from dipole-scattering of the incoming
electrons. Much like IR spectroscopy, the incoming charged electron is influenced by a
7.2. Electron Micros copy 615
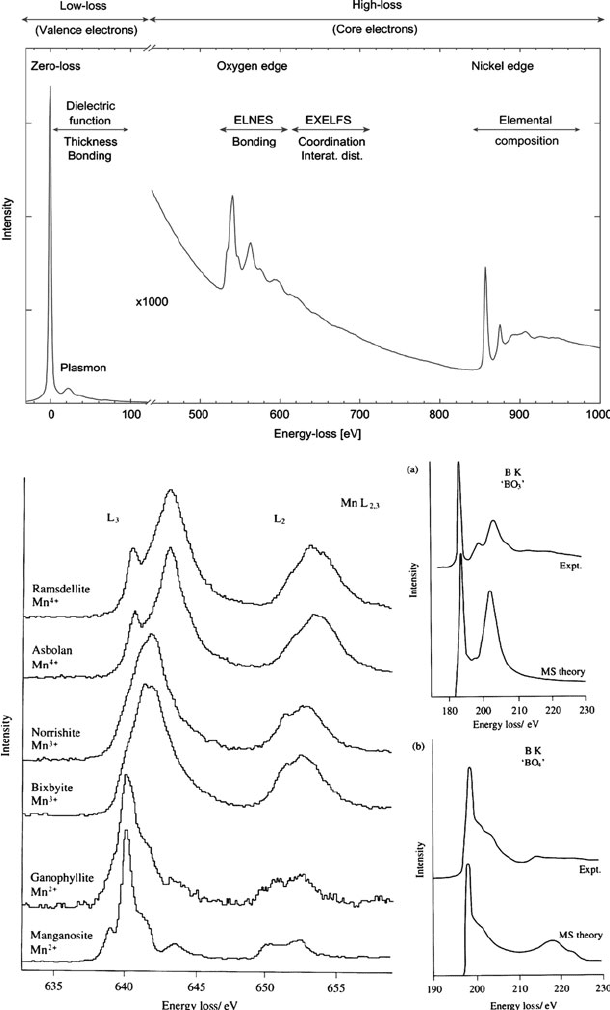
Figure 7.24. Electron energy-loss spectroscopy (EELS) spectra. Shown (top) is a representative EELS
spectrum of a nickel oxide sample. A typical EELS spectrum shows a zero-loss peak that represents the
unscattered or elastically scattered electrons, the near-edge fine structure (ELNES), and extended energy-
loss fine structure (EXELFS). Also shown (bottom) are the “fingerprint” regions of an EELS spectrum,
just beyond the core-electron edges, which provide information regarding the detailed bonding and
chemical environment of the desired element.
[53]
616 7 Materials Characterization
vibrating dipole at the sample surface. Hence, the energy loss of the electron is based on
the amount of energy that was deposited into the vibrational mode.
[57]
The compilation
of the various regions in an EELS spectrum provides a fingerprint of the surface species
being analyzed; hence, this technique is commonly used to probe the localized
vibrational modes of chemisorbed molecules on a surface – relevant for the study of
any heterogeneous process, including the development of novel catalysts for chemical
syntheses, and gas sensors for fuel cell and homeland security applications.
[58]
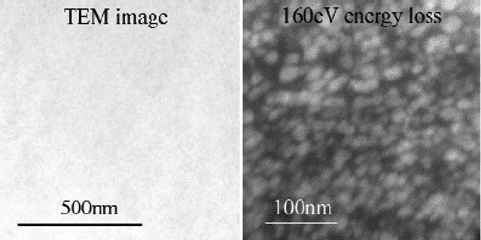
It should be noted that energy-filtered TEM (EF-TEM) images may be formed with
electrons that have lost a specific energy, with respect to a predetermined cut-off
energy of the atomic inner shell. Chemical mapping of the surface is possible in this
mode, which allows one to determine the exact location of elements in the sample – most
useful for surfaces that contain low-Z elements (Figure 7.25). In addition, EFTEM may
be used to illustrate the valence-state distribution of a particular element across a surface,
based on slight differences observed in the ELNES region of the EELS spectrum.
To summarize the many signals one is able to detect using TEM, Figure 7.26
illustrates all of the products arising from interactions between the incident electron
beam and the sam ple. Not only is one able to image the surface via transmitted
electrons or secondary electrons (c.f. SEM), but also interpret the observed image
contrast in terms of the relative atomic masses of the constituent species in the
sample (i.e., bri ght- and dark-field images, energy-filtered image). Further, quanti-
tative elemental analysis is possible via EDS/WDS, AES, and EELS.
7.2.3. Scanning Electron Microscopy (SEM)
In contrast to TEM, with typical sample thicknesses in the range of 10 nm–1 mm,
sample depths for SEM often extend into the 10–50 micron (mm) range. As such, this
technique is most often used to provide a topographic image of much thicker
samples (e.g., Si Wafers, bulk polymers, etc.). However, the electron beam is not
confined to the top of the surface, but also interacts with lower depths of the sample.
Figure 7.25. Energy-filtered TEM showing silica nanoparticles embedded within an organic coating. The
conventional bright-field TEM image (left) shows little/no contrast relative to the EF-TEM image (right).
[59]
7.2. Electron Micros copy 617