Fahlman B.D. Materials Chemistry
Подождите немного. Документ загружается.

to image and record real-time events at the atomic level. Gas inlets (partial pressures
15 Torr) may also be affixed, to allow for imaging of specimens under non-
vacuum conditions. Examples of possible in situ functionalities include:
(i) Heating (up to 1,300 K) – e.g., nanoparticle coalescence,
[77]
real-time growth
of 1-D nanostructures.
[78]
(ii) Nanoindentation – e.g., indentation response of thin films and nanostructures.
[79]
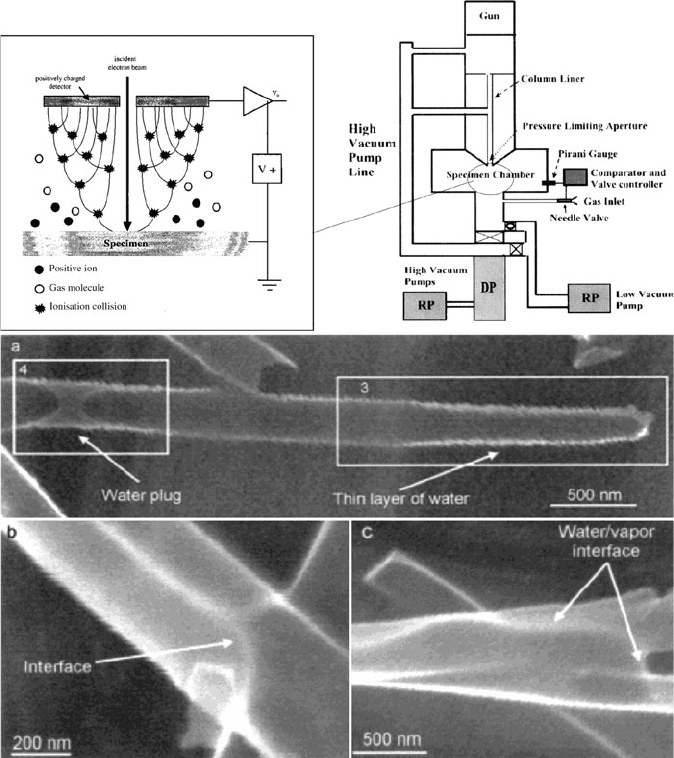
Figure 7.36. Schematic of the differential pumping arrangement of an ESEM (top right)
[74]
and the
cascade amplification process occurring in the gaseous secondary electron detector (GSED) (top left).
[75]
The abbreviations RP and DP refer to the rough pump and diffusion pump, respectively. Also shown
(bottom) is an intriguing application for ESEM – the in situ imaging of water condensation inside a carbon
nanotube (a), and underneath/around the CNT (b, c).
[76]
628 7 Materials Characterization
(iii) Scanning tunneling microscopy (STM)
[80]
– e.g., field emission and electrical
properties of carbon nanotubes.
[81]
(iv) Tomography
[82]
– e.g., 3-D visualization of magnetic tunnel junctions.
[83]
(v) Liquid-phase
[84]
– e.g., nanocrystal growth in solution (!).
[85]
7.3. SURFACE CHARACTERIZATION TECHNIQUES
BASED ON PARTICLE BOMBARDMENT
7.3.1. Photoelectron Spe ctroscopy (PES)
The photoelectric effect, first outlined by Einstein in the early 1900s, refers to the
ejection of ele ctrons from a surface due to photon impingem ent. However, it was
not until the 1960s that this phenomenon was exploited for surface analysis – a
technique referred to as X-ray photoelectron spectroscopy (XPS), or electron spec-
troscopy for chemical analysis (ESCA). This technique consists of the irradiation
of a sample with monochromatic X-rays (e.g., Al K
a
(1.487 keV), Mg K
a
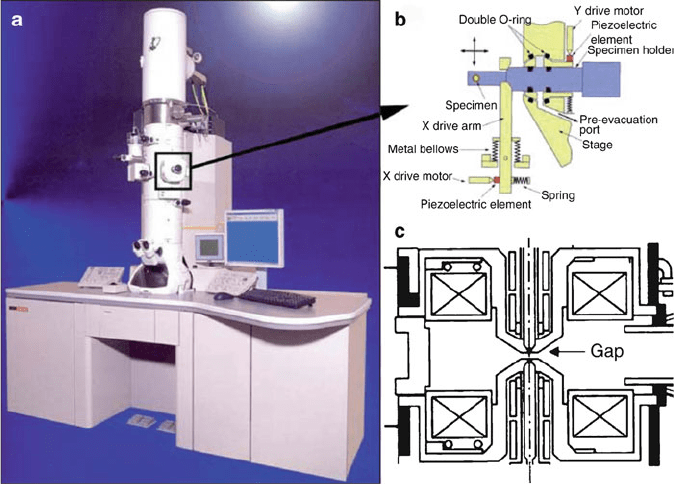
Figure 7.37. Conventional TEM, illustrating the location where the specimen holder is inserted for in situ
experiments. Image (c) shows a front view of the pole piece and the narrow pole-piece gap within which
the specimen holder shown in (b) needs to be inserted. In the case of aberration-free microscopes, the
pole-piece gap can be significantly increased while keeping the resolution high. Reproduced with
permission from Ferreira, P. J.; Mitsuishi, K.; Stach, E. A. MRS Bull. 2008, 33, 83. Copyright 2008
Materials Research Society.
7.3. Surface Characterization Techniques 629
(1.254 keV), Ti K
a
(2.040 keV)), which releases photoelectrons from the sample
surface (Figure 7.38).
[86]
Due to the short free mean path (FMP) of the photoelec-
trons in the solid, this technique provides compositional information from only the
top 1–5 nm of a sample.
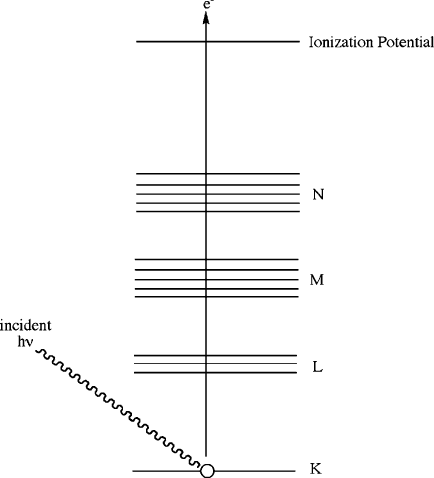
Each atom in the sample has characteristic binding energies of their inner-shell
electrons, referred to as absorption edges. In order to excite the electrons, the energy
of the incident photons must be at least as large as the binding energy of the electrons.
When this energy threshold is exceeded, a large absorption of energy takes place,
followed by the release of photoelectrons with excess kinetic energy (Eq. 11)inorder
to relax the atom back to its stable ground state. Since the binding energy of an atom is
altered by minute changes in its chemical environment (e.g., oxidation state, hybridi-
zation/geometry, etc.), XPS provides both elemental quantification and details regard-
ing the chemical environment of the surface atoms (Figure 7.39):
[87]
E
k
¼ hn E
b
;ð11Þ
where E
k
is the kinetic energy of the emitted photoelectrons; hv, the energy of the
incident photons; and E
b
is the binding energy of the inne r-shell electrons.
In addition to using X-rays to irradiate a surface, ultraviolet light may be used as
the source for photoelectron spectroscopy. This technique, known as ultraviolet
photoelectron spectroscopy (UPS, Figure 7.39), is usually carried out using two
He lines (HeI at 21.2 eV and HeII at 40.8 eV), or a synchrotron source. This
Figure 7.38. The energy-level diagram for X-ray photoelectron spectroscopy (XPS).
630 7 Materials Characterization
technique is oft en referred to as “soft PES,” since the low photon energy is not
sufficient to excite the inner-shell electrons, but rather results in photoelectron
emission from valence band electrons – useful to characterize surface species
based on their bonding motifs. It should be noted that both UPS and XPS are
often performed in tandem with an Ar
þ
source, allowing for chemical analysis of
the sample at depths of 1 mm below the surface.
Though a typical XPS detector collects all emitted photons, regardless of their
ejection angles, it should be noted that angle-resolved XPS (ARPES) and UPS
(ARUPS) may also be carried out. By detecting photoelectrons emitted from a
surface at different emission angles, one obtains the energy of the electrons as a
function of the momentum vector, k. This is referred to as “band mapping,” since
this analysis probes the electronic structure of crystalline materials.
[88]
7.3.2. X-ray Absorption Fine Structure (XAFS)
If a tunable X-ray source such as synchrotron radiation
[89]
is used to generate the
incident photons rather than a monochromatic beam, one can select specific
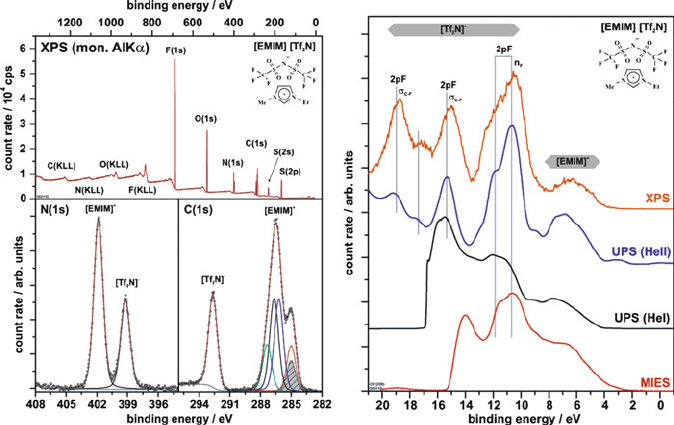
Figure 7.39. XPS spectrum of an ionic liquid, [EMIM][Tf
2
N], detailing the C (1s) and N (1s) regions. Since
there are no peaks from the Au substrate, the film thickness is likely >10 nm. Also shown (right) is the
comparison between XPS, ultraviolet photoelectron spectroscopy (UPS, HeI ¼ 21.2 eV, HeII ¼ 40.8 eV
radiation), and metastable impact electron spectroscopy (MIES). Whereas XPS and UPS provide information
from the first few monolayers of a sample, MIES is used for zero-depth (surface only) analysis, since the
probe atoms are excited He atoms that interact with only the topmost layer of sample. Full interpretations for
these spectra may be found in the original work: Hofft, O.; Bahr, S.; Himmerlich, M.; Krischok, S.; Schaefer,
J. A.; Kempter, V. Langmuir 2006, 22, 7120. Copyright 2006 American Chemical Society.
7.3. Surface Characterization Techniques 631
absorption edges to gain more detailed information regarding the chemical environ-
ment of specific atoms. This technique, known as XAF S, is divided into two spectral
regions – XANES and EXAFS – which are analogous to ELNES and ELEFS in
EELS studies. Whereas XANES is sensitive to the oxidation state and bonding
geometry of the probed element, EXAFS is useful to determine the distances and
co-ordination numbers of neighboring species.
[90]
The small oscillations that are
present in an EXAFS spectru m are indicati ve of the interference effects that occur as
the photoelectrons leave the sample surface. As you might expect, this backscatter-
ing effect becomes most pronounced with increasing photon energies, and with
smaller interatomic distances between the probed atom and its nearest neighbors. As
a further extension of this technique, the X-rays may be reflected from a surface at
an angle in order to yield even more structural information. This techniq ue is
referred to as total external reflection EXAFS, or REFLEXAFS,
[91]
particularly
useful to determine chem ical information from greater sample depths without the
need for destructive Ar
þ
etching.
In order to illustrate the complementary information yielded from XPS and
XAFS, we will consider the work of Gervasini and coworkers, regarding the
characterization of CuO catalysts dispersed on silica and silica/alumina supports.
[92]
The XANES, EXAFS, and XPS spectra for these catalyst species are illustrated in
Figure 7.40. The EXAFS spectrum (Cu K-edge) for a Cu/SiO
2
/Al
2
O
3
catalyst,
calcined in air, has one primary peak at 1.939 A
˚
corresponding to an (octahedral)
environment of six O atoms (Figure 7.46a, thick lin e).
[93]
The lack of othe r O shells
suggests that the surface contains isolated Cu ions, likely as a Cu-aluminate phase.
In contrast, the same catalyst on a SiO
2
support (Figure 7.40a, thin line) shows the
same octahedral environment of O atoms (1.947 A
˚
), and another large peak
corresponding to ca. 5 Cu atoms at an average Cu-Cu distance of 2.987 A
˚
. Since
this is shorter than the Cu-Cu distances in crystalline CuO, the EXA FS spectrum
suggests the formation of amo rphous CuO aggregates on the SiO
2
support.
After reduction of the catalyst in a H
2
stream at the same temperature as calcina-
tion (Figure 7.40b), the Cu/SiO
2
spectrum shows a large peak at 2.547 A
˚
,
corresponding to ca. 8 Cu atoms. The spectrum closely matches that of the fcc
metallic Cu reference, suggesting the presence of small metallic Cu atoms on the
surface. On the Si/Al support, the same spectral features are observed; however,
line-fitting indicates that the Cu atoms are somewhat electropositive until further
reduction takes place at higher temperatures. It was postula ted that this resistance
toward reduction is likely due to the strong association of surface Cu ions with Lewis
acidic aluminum centers of the support.
Not surprisingly, the XANES spectra of Cu/Si and Cu/SiAl (Figure 7.40c)corre-
spond to the absorption edge of Cu
2þ
. However, the spectra are significantly different
from the CuO reference. This suggests the presence of a distorted octahedral geometry
about the Cu ions, where the Cu may be bound to three different types of O atoms:
(i) from the support, (ii) from surface –OH groups, and (iii) from water molecules.
The XPS spectra (Figure 7.40d, e) show a broad peak at 934 eV, corresponding to
the Cu L-edge of Cu(2p ! 3d transiti on). Since the binding energy for Cu
2þ
and
632 7 Materials Characterization
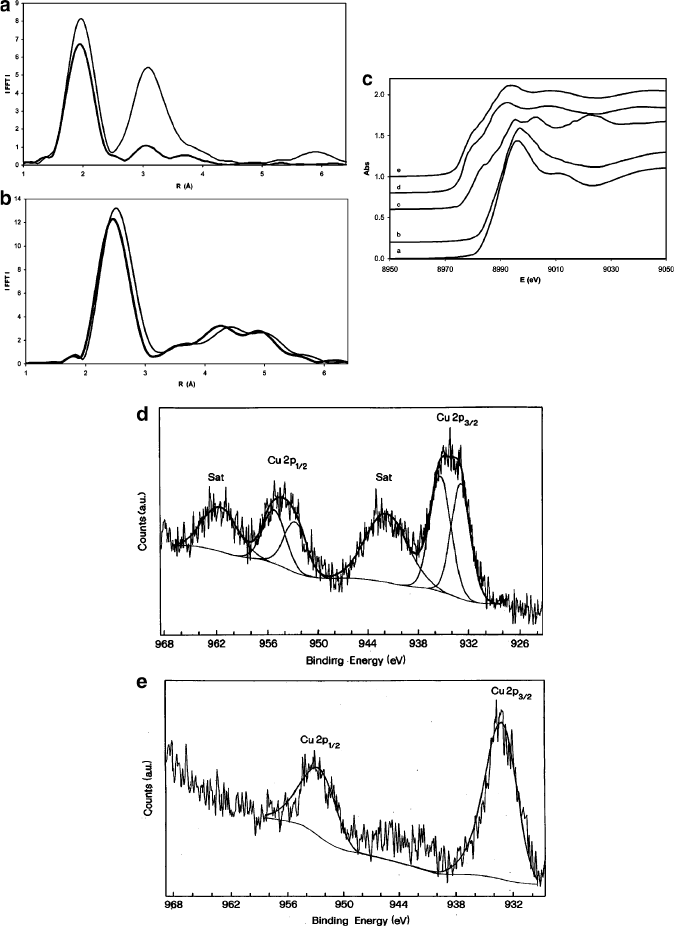
Figure 7.40. XAFS CASE STUDY: surface characterization of dispersed CuO catalysts on silica and
alumina/silica supports. Shown are: (a) EXAFS of the Cu K-edge of the catalyst calcined in air at 543 K.
The thick and thin lines indicate Si/Al and Si supports, respectively; (b) EXAFS of the Cu K-edge of the
catalyst reduced under a H
2
flow at 543 K; (c) Cu K-edge XANES spectra of the calcined catalyst on
(a) SiO
2
, (b) SiO
2
/Al
2
O
3
supports, along with references of (c) Cu foil, (d) Cu
2
O, and (e) CuO; (d) XPS
spectrum of the Cu 2p core level of the calcined catalyst on a Si support; (e) XPS spectrum of the catalyst
on a Si/Al support. Reproduced with permission from Gervasini, A.; Manzoli, M.; Martra, G.; Ponti, A.;
Ravasio, N.; Sordelli, L.; Zaccheria, F. J. Phys. Chem. B 2006, 110, 7851.
7.3. Surface Characterization Techniques 633
Cu
þ
are similar (i.e., 933.6 and 932.5 eV, respectively), the shape of the Cu 2p
peaks was examined in detail to determine the valence states of the surface Cu
species. Whereas Cu on Si/Al exhibits one contribution, Cu on a SiO
2
support
shows the presence of two different Cu species. In particular, this suggests that the
Cu
2þ
ions interact with both ═O and –OH groups from the silica support. Further-
more, satellite peaks from the spin–orbit components
[94]
(i.e., Cu(p
1/2
) and Cu(p
3/2
))
of the Cu(2p) peak are observed only for Cu on a SiO
2
support; this suggests
that the Si/Al support contains Cu atoms in a lower valence state, such as Cu
þ
speciation.
[95]
Lastly, XPS was also used to gleam information regarding the dispersion of Cu on
the two surfaces. The Cu(2p
3/2
), Si(2s), and Al(2p) peaks were integrated to yield the
respective elemental concentrations of each supported catalyst. The molar ratios
between the surface species (i.e., Cu(2p)/Si(2s) or Cu(2p)/Si(2s) þ Al(2p)) and the
total metal species (i.e., Cu/Si or Cu/(Si þ Al), as obtained from inductively coupled
plasma (ICP) analysis) resulted in values near 1.0 and 0.35 for the SiO
2
and SiO
2
/
Al
2
O
3
supports, respectively. The surface deficiency of Cu on the Si/Al support is
proposed to be an artifact of Cu encasement within the pores of aluminum-rich
regions, as also suggested from XAFS.
7.3.3. Ion-Bombardment Techniques
Thus far, the majority of surface techniques have employed the “collide and collect”
principle, where either electrons or X-rays impinge on the sample, and various
emissions are collected/analyzed. However, a number of other ions may also be
used for such bombardment-based analyses. For instance, we already saw an
example (Figure 7.39)ofmetastable impact electron spectroscopy (MIES), in
which metastable He atoms (in an excited 2s
1
state, with an energy of 19.8 eV and
a lifetime of ca. 4,000 s) are directed toward a sample. As the atom collides with the
sample, the 2s electron tunnels into an empty valence orbital in a sample atom,
releasing an Auger electron. A similar surface-relaxation mode may be carried out
by incident He ions, which is termed ion neutralization spectroscopy (INS). Since
the incident atoms/ions are not sufficiently energetic, the beam does not penetrate
through the sample surface. Hence, the spectra resulting from these techniques
provide information regarding the DOS for the topmost surface monolayer of
the sample.
[96]
If a high-energy beam (2–4 MeV) of He (a-particles) or H ions
[97]
collides with a
surface, information may be gained regarding the composition and thickness of a
surface coating (Figure 7.41). This technique is known as Rutherford backscattering
(RBS), very similar to the original scattering experiments conduc ted by Rutherford
in the early 1900s – essential in the early development of a structural description of
the atom. As the energetic ion penetrates the material, it loses energy through
collisions with electrons, and (less frequently) with nuclei. When the positively
charged He
þ
ion approaches the nucleus of a sample atom, it will be electrostatically
repelled. As you would expect, the energy of the backscattered ions will depend on
634 7 Materials Characterization
their incident energy, as well as the mass of the surface atom that causes the scattering.
For instance, contact with high-Z atoms such as gold, will result in the energy of
the backscattered ions being almost equivalent as the incident beam. By measuring
the energy spectrum of the backscattered ions, information on the composition
of the elements, and their origination depth from the sample may be obtained.
Hence, RBS provides facile compositional information regarding a sample, without
the need for a reference sample.
[98]
This technique is most often applied to determine
the chemical composition versus depth for heavy elements in a low-Z matrix, amena-
ble for thicknesses of up to 0.5 mm (for He ions) and 10 mm(forHions).
Based on our previous discussions, it is logical to assume that high-energy ions
may dislodge inner-shell electrons, releasing characteristic X-rays (cf. EDS). This
is the theoretical principle underlying particle-induced X-ray emission (PIXE), which
uses high-energy H
þ
or He
þ
ions (at >2MeV;producedfromavandeGraaff
accelerator
[99]
) as the incident beam. This technique offers a nondestructive quantita-
tive analysis of a sample (for elements with Z 13), often used by archaeologist and
art curators to assist with dating and authenticity assessments. With low detection
limits (ca. 1–10 ppm), and ability to analyze a number of elements simultaneously,
PIXE has also been widely used for the rapid analysis of multilayer thin films for
microelectronics and optoelectronics applications. A recent extension, known as
micro-PIXE, allows one to focus the ion beam to a diameter of ca.1mm, to allow
0 200 400 600 800 1000
Channel
O
C
V
Ni
RBS spectra
0
2
4
6
8
10
12
Normalized Yield
0.5 1.0 1.5
Energy (MeV)
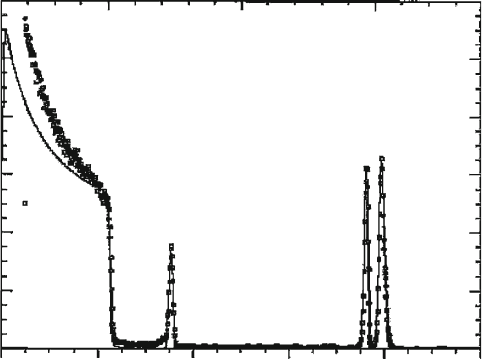
Figure 7.41. Rutherford backscattering (RBS) spectrum of a LiNiVO
4
film (thickness of 240 5A
˚
)ona
carbon substrate. The open squares represent the experimental RBS data, and the continuous line is the
simulated data. Reproduced with permission from Reddy, M. V.; Pecquenard, B.; Vinatier, P.; Levasseur, A.
J. Phys. Chem. B 2006, 110, 4301. Copyright 2006 American Chemical Society.
7.3. Surface Characterization Techniques 635
for a more localized analysis (Figure 7.42). The primary benefit of this technique is the
wide variety of samples that may be analyzed, from liquids to powders. Though no
sample preparation is necessary for PIXE, it should be noted that the analysis is
limited to the top 10–50 mm of the sample, depending on its density.
Among the techniques discussed thus far, the best Z-cutoff for elemental compo-
sition techniques has been Li (for XPS and AES). One ion-bombardment method,
elastic recoil detection analysis (ERDA) ,
[100]
is able to nondestructively quantify
light elements such as hydrogen or deuterium.
[101]
This technique uses a high-
energy ion beam (e.g., He, Au, Cl, C, or O ions), which causes light elements to
be elastically ejected from the surface (i.e., “recoiled”) due to interactions between
the incident beam and their atomic nuclei (Figure 7.43). By choice of the correct
angle between the sample surface and detector, the incident beam is blocked by
“stopper foil” to increase the signal/noise ratio for the measurement.
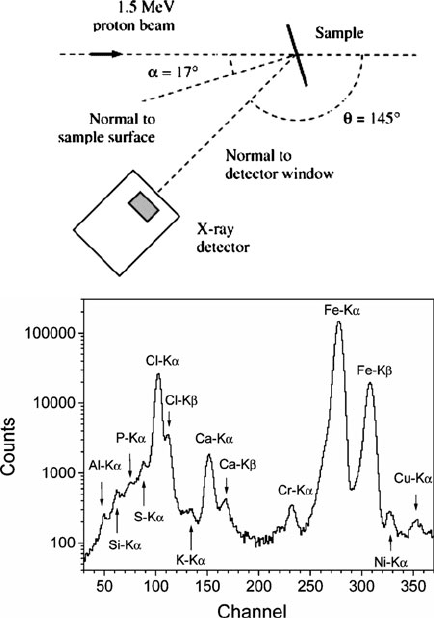
Figure 7.42. Experimental setup and X-ray spectrum resulting from PIXE analysis of single-walled
carbon nanotubes. Reproduced with permission from Naab, F. U.; Holland, O. W.; Duggan, J. L.;
McDaniel, F. D. J. Phys. Chem. B 2005, 109, 1415. Copyright 2005 American Chemical Society.
636 7 Materials Characterization
Secondary-ion mass spectrometry (SIMS)
The most common mode of chemical analysis presented herein has been the
monitoring of elastically/inelastically scattered or recoiled incident beam species,
or the analysis of a secon dary emission pattern. In addition to the release of charac-
teristic X-rays, Auger electrons, and photoelectrons, an incident beam may cause
ionization of the sample. This technique is known as secondary-ion mass spec-
trometry (SIMS),
[102]
which represents the most sensitive surface characterization
technique developed to date, with detection limits of 10
10
–10
15
atoms cm
3
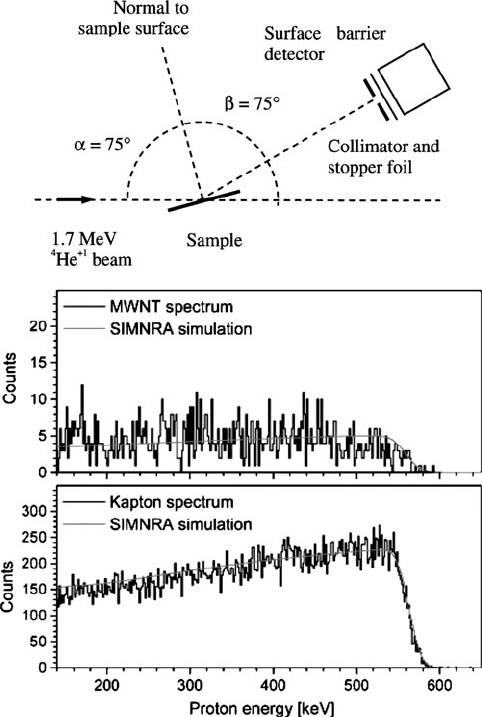
Figure 7.43. Experimental setup and elastic recoil detection (ERD) spectra for multiwalled nanotubes,
and a Kapton polyimide film. A computer program, SIMRA, is useful to simulate ERD as well as other
non-RBS data. Reproduced with permission from Naab, F. U.; Holland, O. W.; Duggan, J. L.; McDaniel,
F. D. J. Phys. Chem. B 2005, 109, 1415. Copyright 2005 American Chemical Society.
7.3. Surface Characterization Techniques 637