Durst F. Fluid Mechanics: An Introduction to the Theory of Fluid Flows
Подождите немного. Документ загружается.


21.7 Laser Doppler Anemometry 705
This effective diameter of the measuring volume has to be smaller than the
diameter of the cross-sectional region of the two laser beams of the incident
optical system:
d
in
=
d
s
cos ϕ
=
5
π
λ
f
1
D
1
1
cos ϕ
(21.102)
The above equations are equivalent to the requirement that the num-
ber of interference fringes in the intersection area (N
fr
)hastobelarger
than the number of the interference fringes N
ph
which can be seen by the
photodetector. A guideline for this relation is:
N
fr
≈
5
4
N
ph
(21.103)
With this, one ensures that the outer area of the interference-fringe pattern,
with its bad signal quality, does not have an influence on the carried out LDA
measurements. A summary of the above equations yields for the number of
fringes within the intersection region of an LDA optical system the following
equation:
N
fr
≈
d
in
∆x
=
10
π
f
1
D
1
tan ϕ (21.104)
Details of the above considerations can be found in the book by Durst
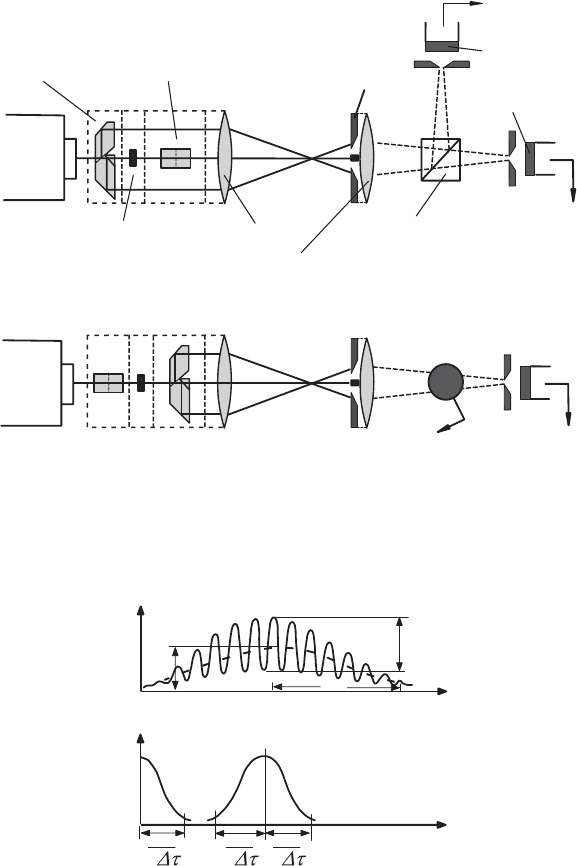
et al. [21.8]. Multidimensional laser Doppler measurements are possible, but
one pair of beams is required per velocity component, i.e. per measured flow
direction. An optical system which allows one to carry out such measurements
with a two-beam configuration is shown in Fig. 21.44.
In the optical systems represented in Fig. 21.44, the Bragg cells are not in-
cluded. When these are introduced into the two pairs of beams, measurements
with frequency shifts in both pairs of the beams, for two-component measure-
ments, are possible, i.e. the directional recognition of the flow velocities can
be measured at the same time for the two velocity components.
21.7.3 Electronic Systems for Laser Doppler
Measurements
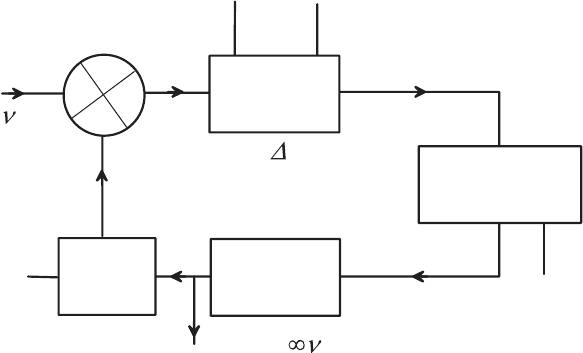
When a scattered particle is traversing the measuring volume of a laser
Doppler optical system, and when the scattered light resulting from this
particle is detected by a photomultiplier, a signal results at the outlet of the
photomultiplier as shown in Fig. 21.45. This signal comprises a low-frequency
component resulting from the Gauss intensity distribution of the laser light.
Furthermore, there is a high-frequency portion that is an inherent part of
the laser Doppler signal. The entire signal thus has a frequency spectrum as
is also shown in Fig. 21.45. It is the high-frequency component of the signal
which is of interest for velocity measurements by LDA.
706 21 Introduction to Fluid-Flow Measurement
Laser
Photo detector 1
Photo detector 2
Collecting lens
Lens
Mask
Prism module 1 Prism module 2
Polarisation filter
Polarisation sensitive
beam splitter
Side view of optical system
Top view of optical system
Fig. 21.44 Two-beam anemometer for two-component LDA measurements of
particle velocity
A
p
A
s
A
A
t
f
Dt
e
2
e
2
e
2
Frequency s
pectrum
of single signals
Signal produced by a single particle
Properties of doppler signals as obtained by
single particles
Fig. 21.45 Typical Doppler signal of a single scattered particle
In principle, it would be sufficient, for determining the Doppler frequency
of a signal originating from a scattered particle, to measure the frequency by
means of a spectrum analyser. The most important components of such an
instrument are indicated in Fig. 21.46. This figure shows a block diagram of

21.7 Laser Doppler Anemometry 707
Squaring and
smoothing unit
Recorder
Sweep-
generator
I,F,-filter
Mixer
V, C, O,
Spectrum analyser
(1)
(4)
(3)
(2)
D
f
0S
f
0
( f
0
,
f
0
)
Fig. 21.46 Working principle of the frequency analyser
the most essential components for scanning the frequency range covered by
the LDA photodetector signal.
In practice, scanning of the expected Doppler frequency range is done
by a filter whose middle frequency is adjusted to a fixed frequency f
0
.For
detection of the Doppler frequency, the Doppler signal s
k
(t)ismixedwith
the signal cos 2πf
0S
t of a voltage-controlled oscillator, and in this way the
Doppler frequency range is scanned by varying the oscillator frequency. When
the signal of the k th particle is represented by:
s
k
(t)=a
k
(t)cos(2πν
k
t + φ
k
) (21.105)
for the momentary value of the mixer outlet (an analogue multiplier), the
following signal holds:
s
M
(t)=a
k
(t)cos(2πν
k
t + φ
k
)cos2πf
0s
t (21.106)
The amplitude of the mixed signal is proportional to the amplitude of the
photodetector signal and has frequency components f
0S
± ν
k
.
Most of the spectrum analysers choose for displacement of the detected
frequency, for their unambiguous operation, the lower of the two frequencies.
When the Doppler frequency to be detected satisfies the conditions
f
0
−
∆f
0
2
≤ f
0s
− ν
k
≤ f
0
+
∆f
0
2
(21.107)
a signal passes the filter and reaches the squaring and integrating part of
the electronics. After squaring and smoothing the frequency-analyser output
signal, the result is recorded.
708 21 Introduction to Fluid-Flow Measurement
The voltage-controlled oscillator is driven by a sawtooth voltage, so that
the frequency of the signal, transmitted by the mixer, increases linearly with
time. As a consequence, the mixture of the Doppler frequencies ν
k
and os-
cillator frequency, which contribute to the output signal of the analyser, also
increases. When the same sawtooth voltage is used for triggering the x-basis
of a plotter, the Doppler spectrum detected by the frequency analyser can
be plotted. The calibration of the x-axis with respect to frequency is carried
out with the voltage output of a suitable oscillator.
In order to be able also to carry out time-resolved laser Doppler measure-
ments, so-called frequency tracking modulators can be employed. In contrast
to the frequency analyser described above, they permit real-time detection
of the Doppler signal. Frequency tracking demodulation yields an analogue
signal whose voltage is always proportional to the component of the local
fluid velocity which the optical system detects.
Another part of the signal processing with analogous instruments provides
the statistical description of the flow velocity, e.g. via the mean velocity and
the components of the fluctuation velocity, and also quantities which can-
not be obtained by a frequency analysis, such as the turbulence spectrum
and the autocorrelation function of the velocities. Difficulties result, how-
ever, from the non-ideal mode of operation of a tracker. They are caused, e.g.
by the often discontinuous signal of the photodetector, which comes from the
fact that only single scattered particles are traversing the measuring volume.
With this demodulated output signal, one does not receive, at every point
in time, information on the momentary fluid motion. Velocity measurements
can only be carried out when a scattering particle is in the measuring vol-
ume. The intermittent measurements can lead to erroneous velocity statistics.
Fluctuations of the recorded Doppler frequencies can also be caused by other
reasons than those of velocity fluctuations in the fluid (e.g. by broadening of
the frequency spectrum due to the presence of the particles in the measuring
volume for finite time). The statistical evaluation of the measurements, by
the combination of an anemometer and a tracker, is made more difficult.
The essential components of a frequency tracking demodulator are repre-
sented in Fig. 21.47. This figure shows that the frequency analyzer, discussed
before, and also the tracker, contain three equal components [frequency mixer,
band-pass filter and voltage-controlled oscillator (VCO)]. Thus the above
explanations, which deal with the properties of the bandpass filter and the
mode of operation of the mixer, are also of significance for the present section
on frequency trackers. The integrator of the tracker corresponds to the time
averaging unit of the frequency analyser. For the discriminator, there is no
comparable component in the frequency analyser. The tracker has, moreover,
in contrast to the frequency analyser, a closed control circuit which drives
the oscillator.
The output signal of the photodetector of an LDA-optical system, similarly
to the processing in a frequency analyser, is mixed with the output signal of
the VCO. Here a signal s
M
(t), results which is led through a narrow bandpass
21.7 Laser Doppler Anemometry 709
Frequency
discriminator
Integrator
Z,F,-Filter
Mixer
V, C, O,
(1) (2)
(6)
D
f
0S
f
0
( f
0
,
f
0
)
Exit
E
D
(3)
Fig. 21.47 Functional principle for offset-heterodyne tracker
filter. Thus, only those signal frequencies of the LDA signal, plus the VCO, are
detected, which are located near the center frequency f
0
of the filter. Because
of the small bandwidth of the bandpass filter (ZF-filter), the signal-to-noise
ratio (SNR) of the LDA signal to be detected, improves considerably due to
the narrowness of the band pass filter. A certain improvement of the signal-
to-noise ratio can also be achieved by a filter in front of the mixer. However,
one has to do this filtering with a filter bandwidth which is broad in relation
to the Doppler frequency, in order to avoid attenuation of the amplitude of
the Doppler signal in turbulent flows. The frequency discriminator generates
a voltage which triggers the VCO in such a way that the modifications of the
Doppler frequency by the VCO are compensated. This is explained below.
The integrator controls the transient behavior due to individual LDA signals
and the stability of the control circuit.
Trackers which operate with a narrow bandpass filter around the cen-
ter frequency f
0
(see Fig. 21.47) function according to the offset-heterodyne
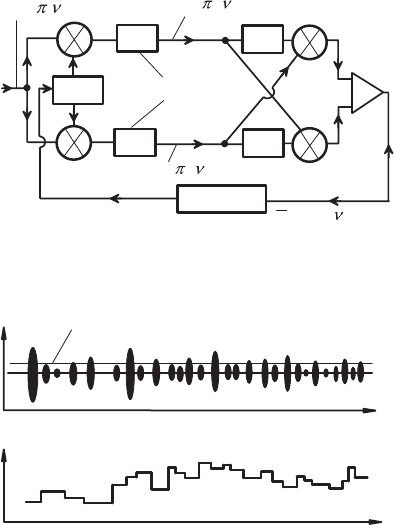
principle. In laser Doppler anemometry, autodyne trackers have also been
developed, of the kind shown in Fig. 21.48.
Whatever the actual working principles of the LDA frequency tracking
demodulators are, they bring about LDA signals as sketched in Fig. 21.49.
In this figure the individual Doppler bursts are shown as high-pass filtered
signals, which serve as an input signal into the tracker. Every time the sig-
nal amplitude of an individual LDA signal exceeds a certain threshold value,
the signal is fed to the tracker which then measures the frequency and thus
changes the output voltage of the preceding signal. The output signal of the
tracker therefore has the form of steps, each step being achieved by a new
710 21 Introduction to Fluid-Flow Measurement
a
cos 2
D
t
a
cos 2
(
D
-
f
os
)
t
0°
90°
V,C,O
Low pass filter
d
/
dt
d
/
dt
-
+
Integrator
a
sin 2
(
D
-
f
os
) t
e
0
a
2
(
D
-
f
os
)
∝
Fig. 21.48 Functional principle of an autodyne tracker for determining the LDA
signal frequency
ν
D
t
t
Threshold level
High pass filtered signal
Tracker output
Fig. 21.49 Typical input and output signals of trackers for LDA measurements
measurement of the laser Doppler frequency. This tracker output signal, in
the form of steps along the time axis, must not be considered as being dis-
advantageous for measuring the statistically averaged properties of a flow.
The stepwise changes of velocity information take place, with sufficient con-
centration of particles, in time intervals which are much smaller than the
characteristic times of the flow, i.e. the time scales at which velocity changes
occur in the flow. It is therefore possible to integrate over several of the
stepwise frequency changes by appropriate electronic devices, to achieve an
averaged output signal for the actual velocity measurements. It is important
to take this pre-averaging into account for precise Doppler measurements.
Finally, a signal-processing system that is extensively employed in laser
Doppler anemometry, the so-called time period measurement system, has to
be explained. Measurement systems of this kind are known as laser Doppler
counters and are extensively applied for LDA measurements. They make use
of signals which, after the photodetector, are fed, often after suitable ampli-
fication, to a bandpass filter. It is here, where the actual Doppler frequency
separation from the low-frequency part of the signal takes place. The resultant
signal is sketched at the top of Fig. 21.50. It is processed further in a special

21.7 Laser Doppler Anemometry 711
Doppler signal burst entering
amplitude discriminator
- Pulse train deduced
from upper level crossings
- Pulse train deduced
from zero crossings
- Pulse train deduced
from lower level crossings
- Gate time
1
2
3
- Valid zero crossing
pulse train
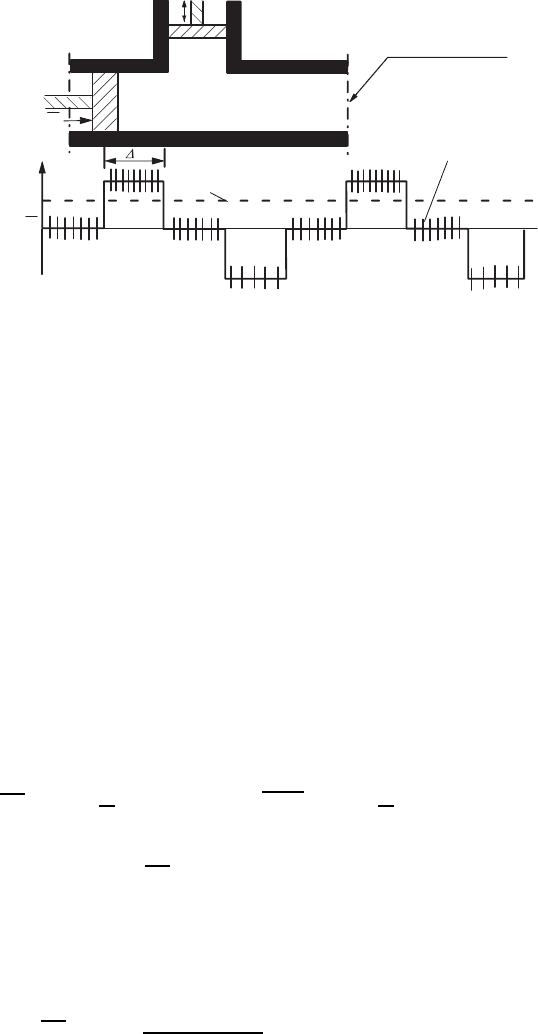
Fig. 21.50 Doppler frequency measurement with period measurement system
electronic system, in order to obtain a sequence of pulses which are also il-
lustrated in Fig. 21.50. The entire signal processing of the counter-electronics
functions as follows:
• The symmetrical signal produced by the input stage of the counter-system
is processed by an amplitude discriminator and a zero-position detector
to generate pulse sequences, which are fed to the several logic mod-
ules to check the validity of the frequency information. One possibility
for generating the required pulse sequences that allow precise frequency
measurements, is shown in Fig. 21.50. In practice, this pulse generation
has proven to be a successful method for the production of the precise
information on Doppler frequency.
• The signals of the two-level detectors (Schmitt triggers) and one zero-
position detector are fed to an appropriate logic circuit to generate the
pulse chains 1, 2 and 3. When the Doppler signal crosses the upper trigger
level, it generates a Schmitt trigger output signal, which is used to provide
a switch signal for a logic circuit whose output is then set to one. The
zero-passage detector signal puts this output back to zero. The changing
influence of the signals from the upper level detector and the zero-passage
detector supplies pulse sequence 1, if the appropriate pulse passes, i.e. the
LDA signal amplitude is satisfactory.
• The pulse sequence 2 is generated by the zero-passage detector only, by
switching the output of an appropriate logic module in such a way that
it switches to and fro between one and zero. A combination of the signals
of the zero-passage detector with those of the Schmitt trigger of the lower
level recognition, yields pulse sequence 3. The output of an appropriate
logic module is set by the lower trigger level and put back by the zero-
passage detector.
• If all three signal chains are present, one will obtain valid information and
use those zero passages for which either output 1 or output 3 is set. In this
way, the influence of multiple zero passages is suppressed for the largest
part, i.e. good LDA measurements are obtained.

712 21 Introduction to Fluid-Flow Measurement
• The gate for the measurement of the duration of an LDA signal opens
with the first valid zero passage and closes one zero passage after the
pulse for which output 1 or output 3 was set. This corresponds to three
zero passages at the end of a Doppler signal, which no longer traverse the
upper or lower trigger level.
The above points show that it is possible, with the aid of counter-systems, to
determine the number of zero passages of an LDA signal, and also the length
of time during which the measured number of pulses is available. With this,
a period-time measurement is possible, which leads to the desired Doppler
frequency of the LDA signals. For each individual LDA signal arriving at
the entrance of the counter-electronics with sufficiently high amplitude, a
Doppler frequency can therefore be determined. The latter is now processed
further, to obtain mean frequencies and standard deviations.
The measured individual frequencies of laser Doppler signals correspond
to one velocity component, i.e. to U
j
(x
i
,t). These individual measurements
have now to be processed further, in order to determine the mean frequency
and the RMS values of the existing deviations from the mean frequency:
<f
D
>= lim
N→∞
1
N
N
k=1
(f
D
)
k
(21.108)
and
<∆f
2
D
>= lim
N→∞
1
N
[(f
D
)
k
− <f
D
>]
2
(21.109)
These averaged quantities can be determined easily, as the knowledge of the
individual frequencies, required for averaging, is known from the Doppler
measurements. However, there is a difference between the time-averaged
quantities which are of importance in turbulence, and the particle-averaged
flow quantities which can be determined from (21.108) and (21.109). This can
be explained in a simple way by means of a sketch of a temporal hypothetical
flow, as shown in Fig. 21.51.
This flow shows a mean motion which is generated by the horizontally
operating piston. Additional flows occur, which once show positively, once
negatively imposed step changes by the motion of the vertically operating
piston. This leads, at the measurement point, to a constant mean velocity
with superimposed step-like flow changes.
Assuming an equal distribution of the scattered particles, it is apparent
that the number of particles which pass the measuring volume depends on
the actual flow velocity, and this can be expressed as follows:
N = c
v
| U
⊥
|| A
v
| (21.110)
The number of the measured particles is proportional to the concentration
of the particles in the fluid, and proportional to the flow velocity vertical
to the surface of the control volume, and of course also proportional to the
21.7 Laser Doppler Anemometry 713
•
•
••
•
•
•
•
•
•
•
•
•
•
•
•
•
•
•
•
•
•
•
•
•
•
•
•
•
•
•
•
•
•
•
•
•
•
•
•
•
•
•
••
•
•
•
•
•
•
•
•
•
•
•
•
•
•
•
•
•
•
•
•
•
•
•
•
•
•
•
•
•
•
•
•
•
•
•
•
•
•
•
•
•
•
•
•
•
•
•
•
•
•
•
•
•
•
•
•
•
•
•
•
•
•
•
•
•
•
r
U
U
U
Measuring point
Time averaged
mean velocity
Particle averaged
mean velocity
Fig. 21.51 Dependence of the particle arrival in the measuring volume on the flow
velocity
surface itself. This makes it understandable why in Fig. 21.51 more particles
appear at higher velocities than at lower velocities. This leads to a value of
the particle-averaged velocity that is higher than the fluid time mean velocity,
as indicated in Fig. 21.51. This fact was often called a “biasing error” in Laser
Doppler anemometry and was presented as a principal problem of the LDA
measurement technique. The above explanations make it clear that this only
has to do with the fact that one usually determines ensemble-mean values,
due to their easy determinability from the LDA signals. However, in most
fluid flow studies mean values in terms of time, which are of importance in
turbulence research, need to be measured. This difference between ensemble
and time averages represents the biasing. This leads to the differences between
the mean values with respect to time and with respect to particles.
In fluid mechanics, it is usual to determine time averages, e.g. for
determining mean quantities of turbulent flows, which are computed as
follows:
f
D
= lim
T →∞
1
T
T
#
0
f
D
dt and ∆f
2
D
= lim
T →∞
1
T
T
#
0
∆f
2
D
dt, (21.111)
where ∆f
D
=(f
D
(t)−f
D
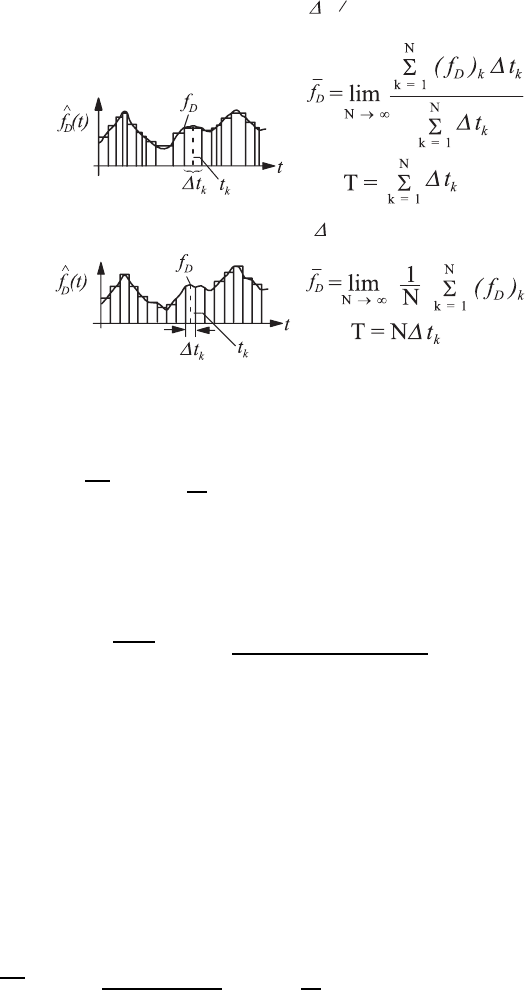
). The above integration can be carried out digitally
for irregular scanning intervals ∆t
k
, as shown in Fig. 21.52. This leads to the
following general equations:
For the time average for ∆t
k
= constant:
f
D
= lim
N→∞
N
k=1
(f
D
)
k
∆t
k
N
k=1
∆t
k
with T =
N
k=1
∆t
k
(21.112)
714 21 Introduction to Fluid-Flow Measurement
Signal processing with time interval
t
k
= constant
Signal processing with time interval
t
k
= constant
Fig. 21.52 Determination of the time average of the Doppler frequency for ∆T
k
=
constant and ∆t
k
= constant
f
D
= lim
N→∞
1
N
N
k=1
(f
D
)
k
with T = N∆t (21.113)
and for the moments which describe the divergence from the mean value the
integration holds that
∆f
n
D
= lim
N→∞
N
k=1
7
(f
D
)
k
−
¯
f
D
8
n
∆t
k
N
k=1
∆t
k
(21.114)
For a stationary random process, the above equations for mean-value deter-
mination conserve their validity for all scanning intervals ∆t
k
, provided that
the scanning process and the scanned quantity (Doppler frequency) are not
correlated with one another. The dissolution of a certain frequency in a flow
requires that the ∆t
k
values are small compared with the time measure of
the flow to be registered.
When the scanning intervals ∆t
k
are chosen to be constant, i.e. ∆t
k
=
∆t = constant, the above equations simplify to
f
D
= lim
N→∞
N
k=1
(f
D
)
k
∆t
k
N
k=1
∆t
k
= lim
N→∞
1
N
N
k=1
f
D
= <f
D
> (21.115)