Chilingarian G.V. et al. Surface Operations in Petroleum Production, II
Подождите немного. Документ загружается.

145
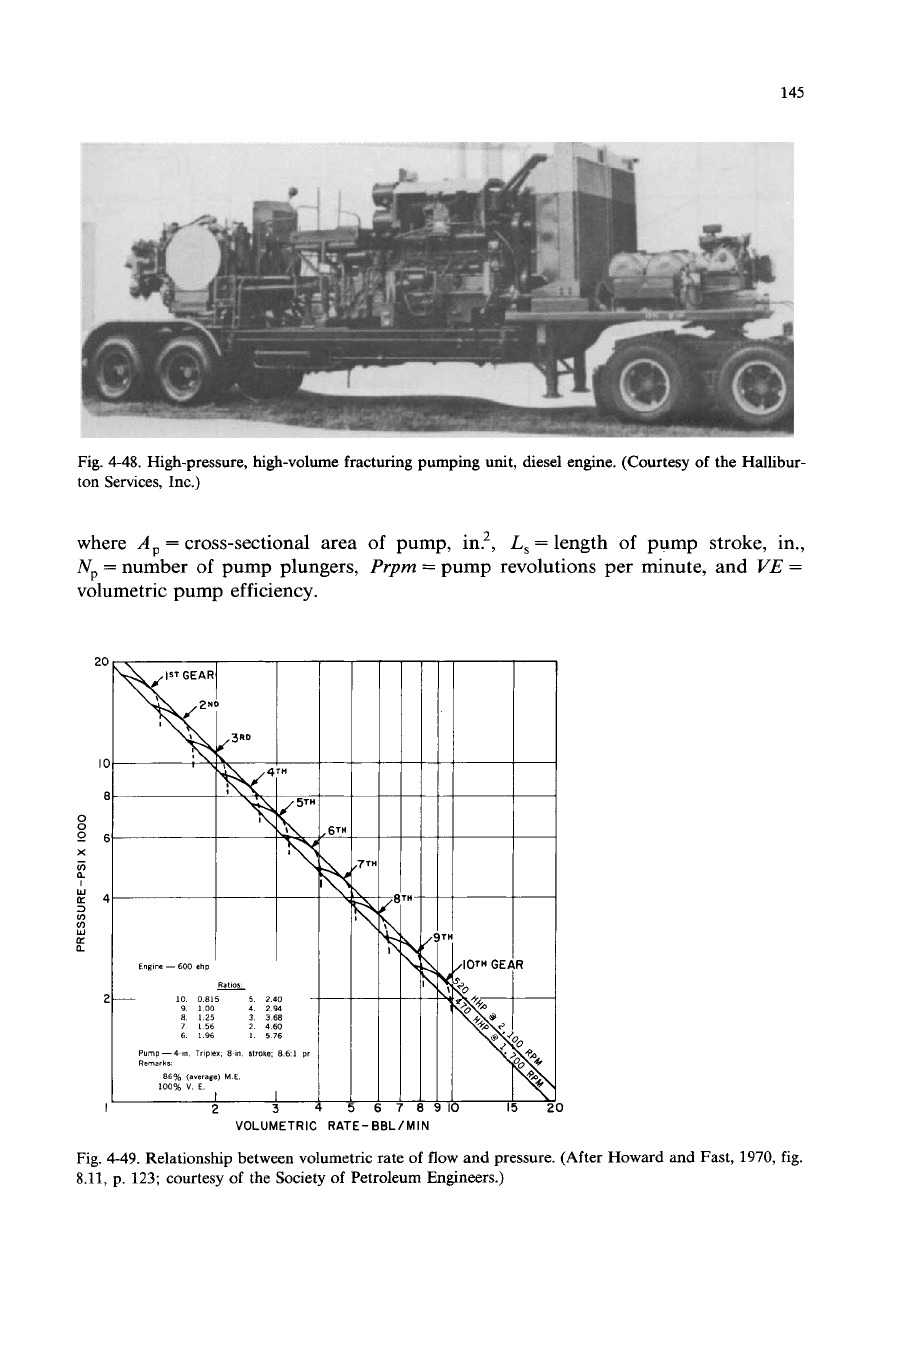
Fig.
4-48.
High-pressure, high-volume fracturing pumping unit, diesel engine. (Courtesy
of
the Hallibur-
ton Services, Inc.)
where
A,
=
cross-sectional area of pump, in?,
L,
=
length of pump stroke, in.,
N,
=
number
of
pump plungers,
Prpm
=
pump revolutions per minute, and
VE
=
volumetric pump efficiency.
Engine
-
600
ehp
Ratlor
10.
0.815
5.
2.40
9.
100
4.
294
8125
3368
7156
2460
6. 1.96
L.
5
76
-
Pump--4
8n
Trlplex.
8
10
slmhe:
8.6:l
Remarks:
86%
(werage)
ME.
100%
V.
E.
I
I
2
3
VOLUMETRIC RATE-
BBLIMIN
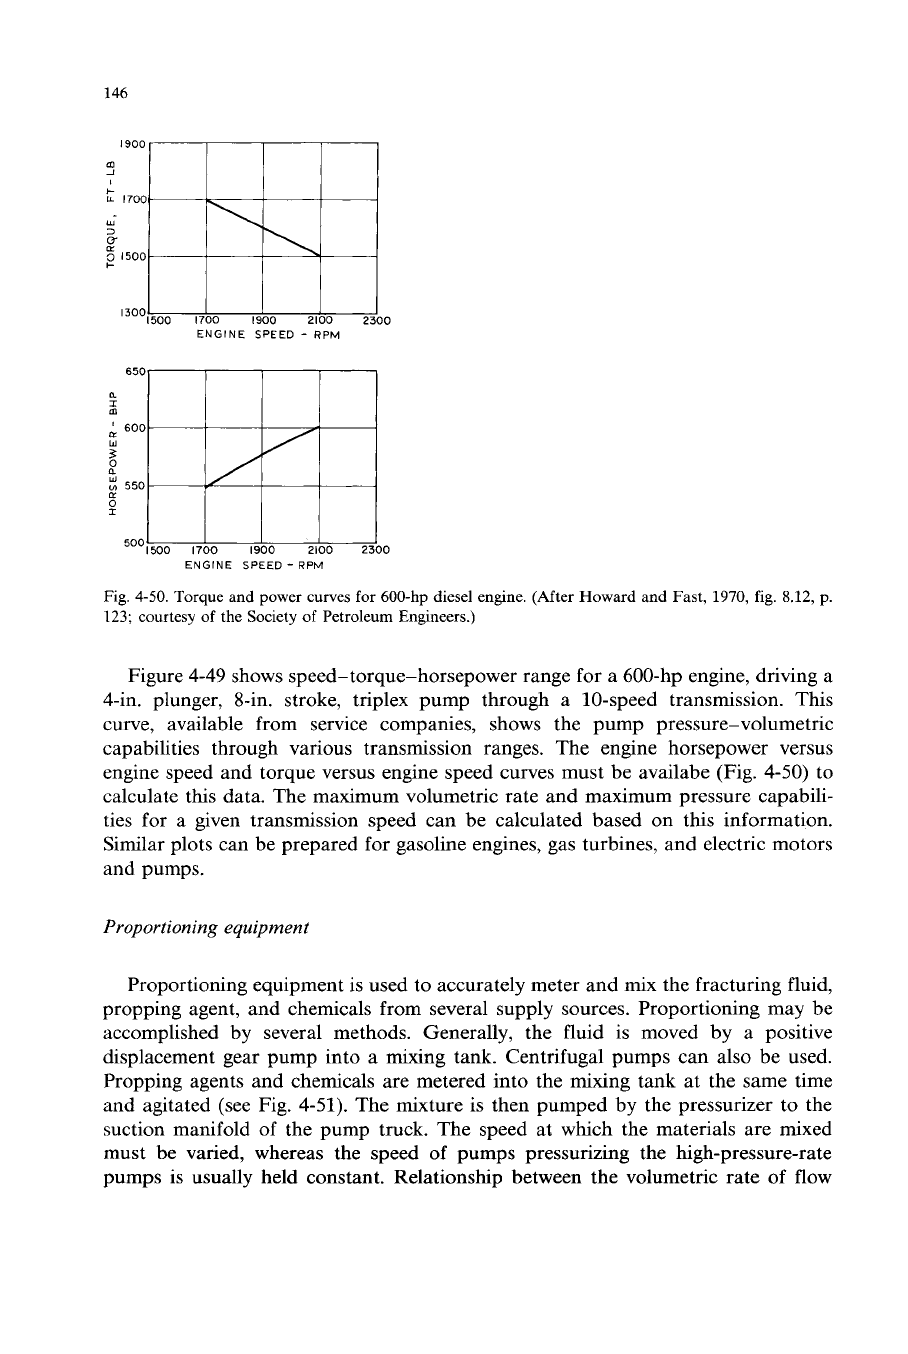
Fig.
4-49.
Relationship between volumetric rate of flow and pressure. (After Howard and Fast,
1970,
fig.
8.11,
p.
123;
courtesy of the Society
of
Petroleum Engineers.)
146
ENGINE
SPEED
-
RPM
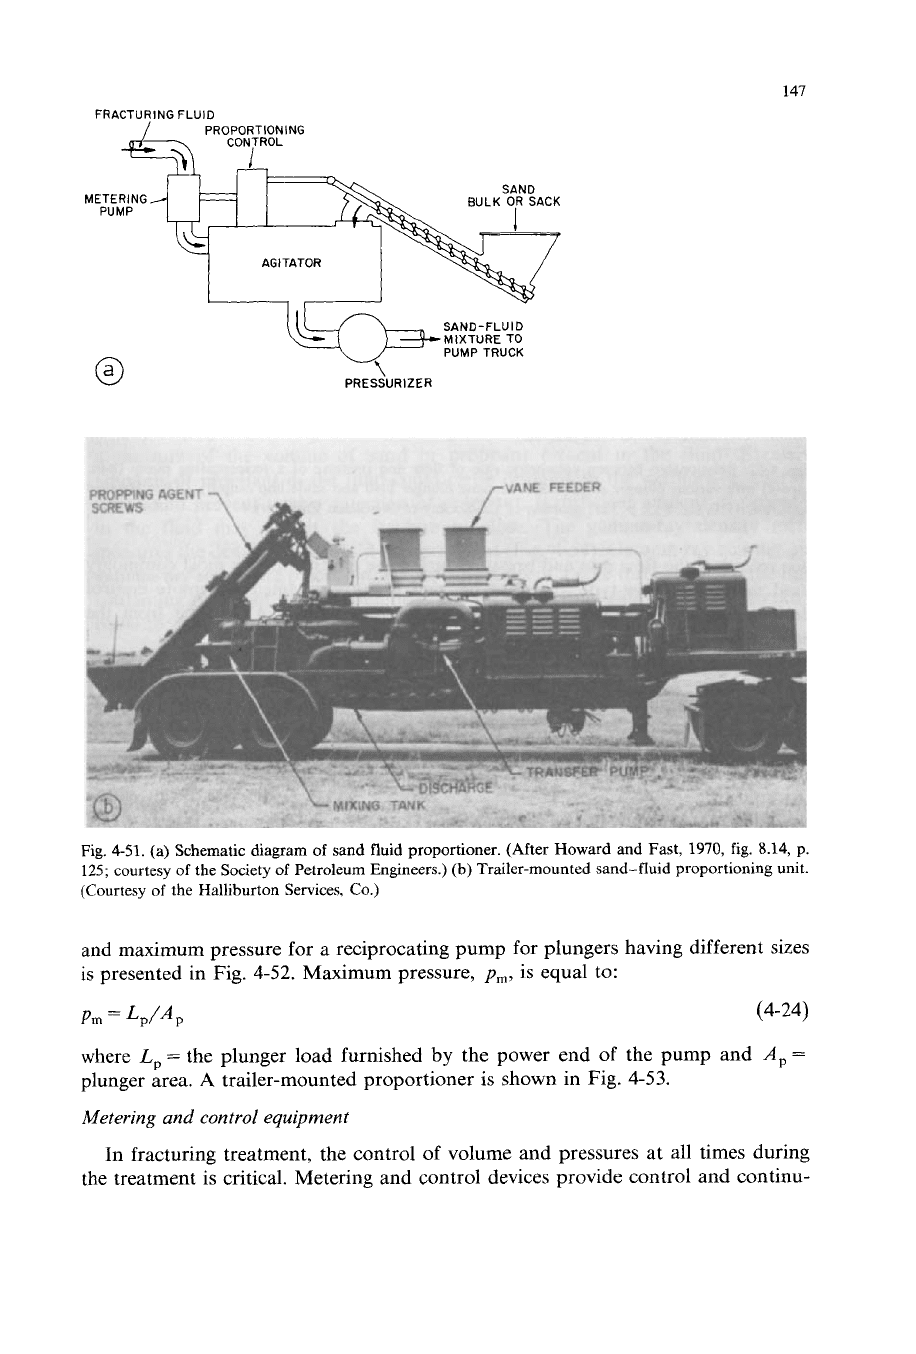
Fig.
4-50.
Torque and power curves for
600-hp
diesel engine. (After Howard and Fast,
1970,
fig.
8.12,
p.
123;
courtesy
of
the Society
of
Petroleum Engineers.)
Figure 4-49 shows speed-torque-horsepower range for a 600-hp engine, driving a
4-in. plunger, 8-in. stroke, triplex pump through a 10-speed transmission. This
curve, available from service companies, shows the pump pressure-volumetric
capabilities through various transmission ranges. The engine horsepower versus
engine speed and torque versus engine speed curves must be availabe (Fig. 4-50) to
calculate this data. The maximum volumetric rate and maximum pressure capabili-
ties for a given transmission speed can be calculated based on this information.
Similar plots can be prepared for gasoline engines, gas turbines, and electric motors
and pumps.
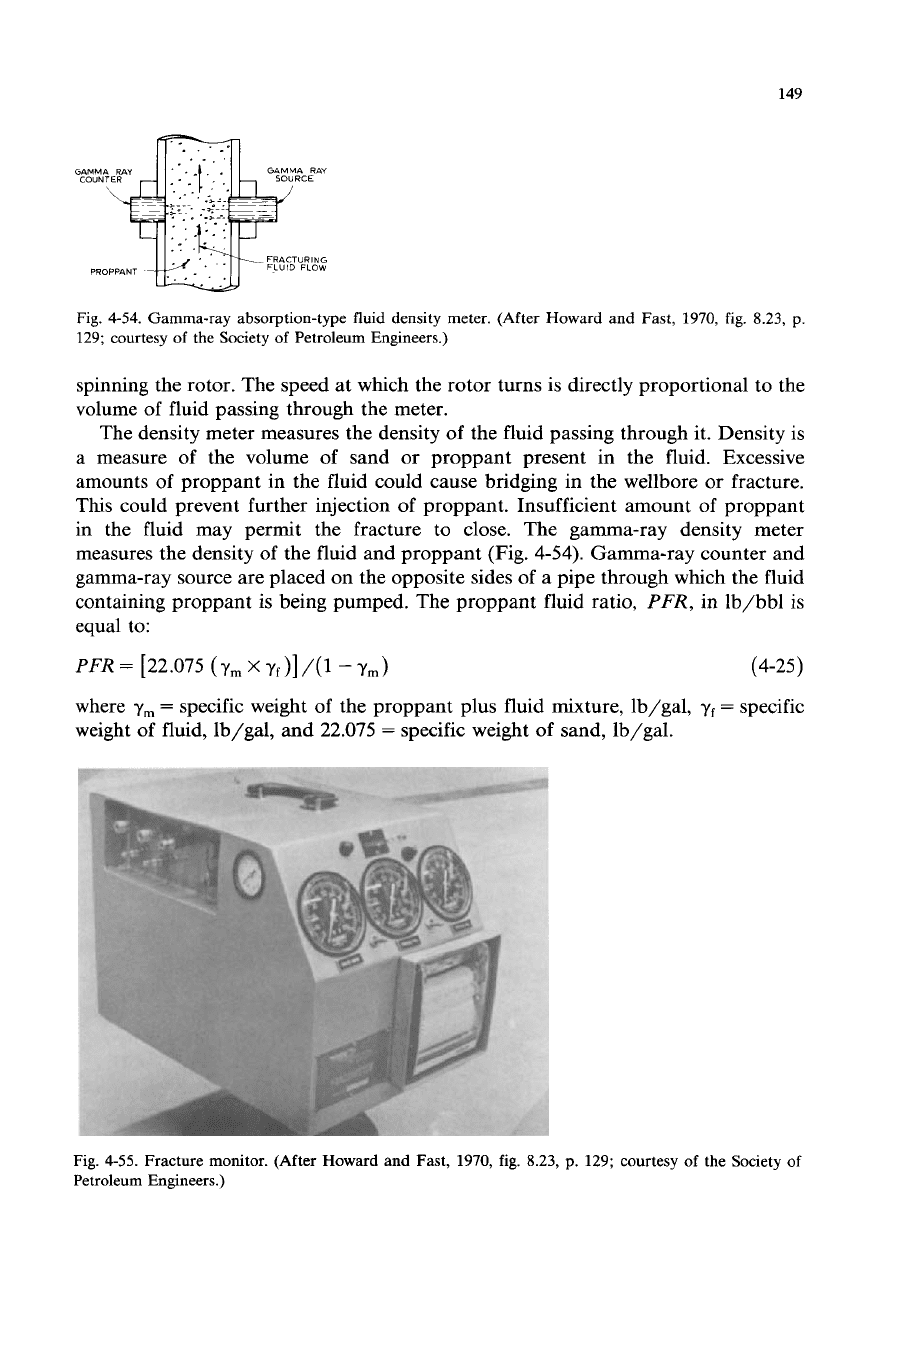
Proportioning equipment
Proportioning equipment is used to accurately meter and mix the fracturing fluid,
propping agent, and chemicals from several supply sources. Proportioning may be
accomplished by several methods. Generally, the fluid is moved by a positive
displacement gear pump into a mixing tank. Centrifugal pumps can also be used.
Propping agents and chemicals are metered into the mixing tank at the same time
and agitated (see Fig. 4-51). The mixture is then pumped by the pressurizer to the
suction manifold
of
the pump truck. The speed at whch the materials are mixed
must be varied, whereas the speed
of
pumps pressurizing the high-pressure-rate
pumps
is
usually held constant. Relationship between the volumetric rate of flow
147
FRACTURING FLUID
PROPORTIONING
PRESSURIZER
Fig.
4-51.
(a) Schematic diagram
of
sand fluid proportioner. (After Howard and Fast,
1970,
fig.
8.14,
p.
125;
courtesy of the Society
of
Petroleum Engineers.) (b) Trailer-mounted sand-fluid proportioning unit.
(Courtesy of
the
Halliburton Services,
Co.)
and maximum pressure for a reciprocating pump for plungers having different sizes
is
presented in Fig.
4-52.
Maximum pressure,
pm,
is
equal to:
Pm
=
Lp/*
p
(4-24)
where
L,
=
the plunger load furnished
by
the power end
of
the pump and
A,,
=
plunger area.
A
trailer-mounted proportioner is shown in Fig.
4-53.
Metering and control equipment
In fracturing treatment, the control of volume and pressures at all times during
the treatment is critical. Metering and control devices provide control and continu-

148
20
I8
16
I
14
I2
g
.
J
Y
s
10
Y
$6
94
2
0
00
PRESSURE-PSI
Fig. 4-52. Relationship between volumetric rate of flow and pressure of a reciprocating pump @-in.
triplex) with various plunger sizes (based
on
same plunger load and same hhp output). (After Howard
and Fast,
1970,
fig.
8.13, p. 125; courtesy of the Society
of
Petroleum Engineers.)
ous record of the flow rate and pressure during the treatment. The most commonly
used meters are flow-type, density-type, and fracture-parameter. Remote control
devices enable control and monitoring of fracturing job at a distance from the
equipment.
A
popular type of flow meter to monitor volumetric rate of flow of liquids
is
shown in Fig.
4-53.
As
fluid flows through the meter, it strikes the rotor blades,
Fig.
4-53.
Flow meter cutaway. (After Howard and Fast,
1970,
fig.
8.18,
p.
128;
courtesy
of
the Society
of
Petroleum Engineers.)
149
Fig. 4-54. Gamma-ray absorption-type fluid density meter. (After Howard and Fast, 1970,
fig.
8.23,
p.
129; courtesy
of
the Society
of
Petroleum Engineers.)
spinning the rotor. The speed at which the rotor turns is directly proportional to the
volume of fluid passing through the meter.
The density meter measures the density of the fluid passing through it. Density is
a measure of the volume
of
sand or proppant present in the fluid. Excessive
amounts of proppant in the fluid could cause bridging in the wellbore or fracture.
This could prevent further injection of proppant. Insufficient amount of proppant
in the fluid may permit the fracture to close. The gamma-ray density meter
measures the density of the fluid and proppant (Fig. 4-54). Gamma-ray counter and
gamma-ray source are placed on the opposite sides of a pipe through which the fluid
containing proppant is being pumped. The proppant fluid ratio,
PFR,
in lb/bbl is
equal to:
(4-25)
where
ym
=
specific weight of the proppant plus fluid mixture, lb/gal,
yf
=
specific
weight of fluid, lb/gal, and 22.075
=
specific weight of sand, lb/gal.
Fig. 4-55. Fracture monitor. (After
Howard
and
Fast, 1970,
fig.
8.23,
p.
129; courtesy
of
the Society
of
Petroleum Engineers.)
150
The density meter provides a continuous monitoring of the proppant-fluid
mixture. By connecting the meter to the supply of proppant and fluid with
pneumatic controllers and control valves, the addition
of
proppant to the fluid is
automatically controlled.
The fracture-parameter meter, which is a portable instrument, provides a remote
indication of injection rate, fluid density, total volume of fluid, and wellhead
pressure (Fig.
4-55).
All information is usually recorded on charts.
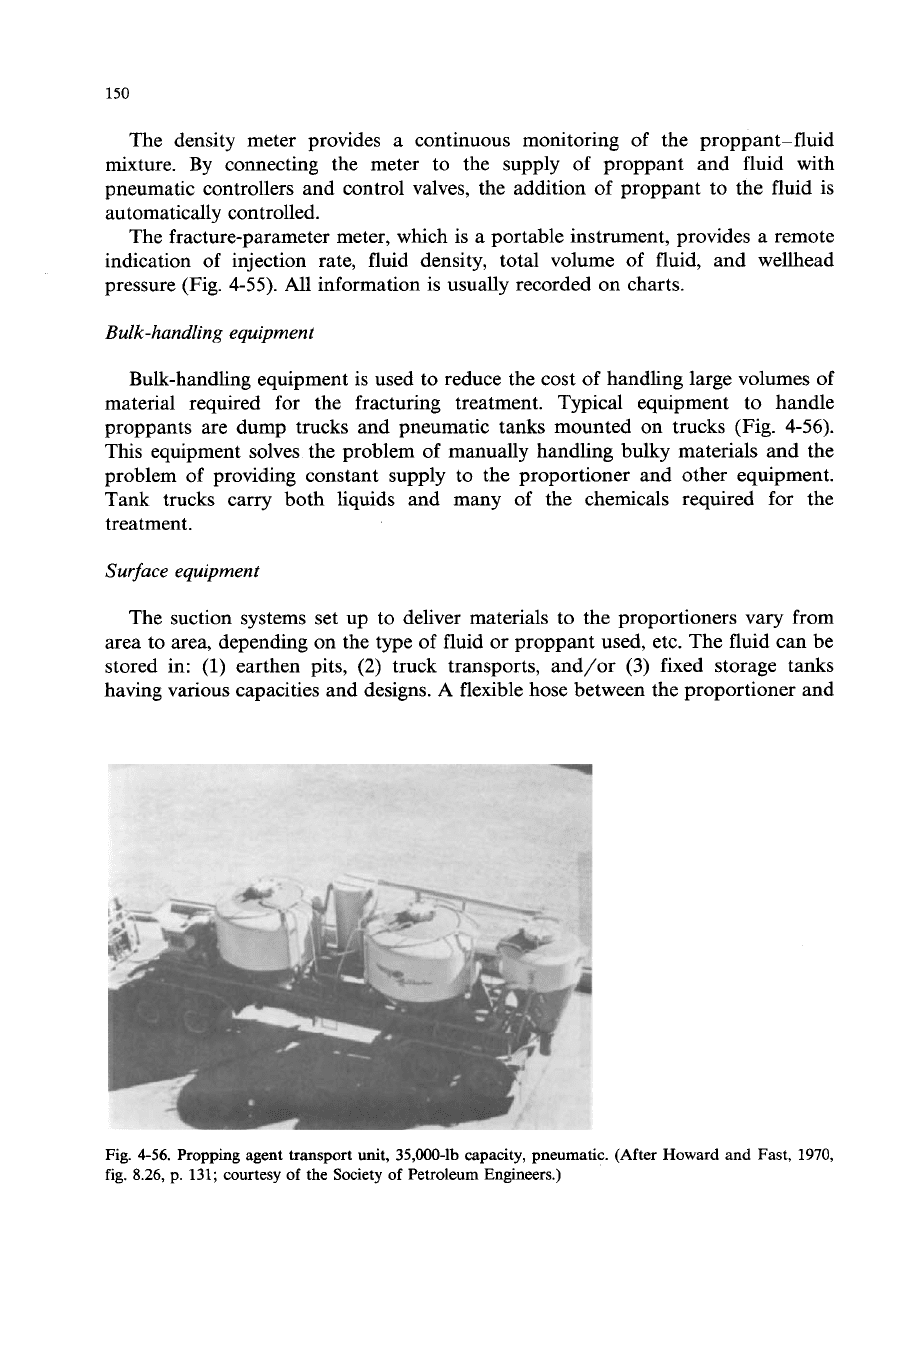
Bulk-handling equipment
Bulk-handling equipment is used to reduce the cost of handling large volumes of
material required for the fracturing treatment. Typical equipment to handle
proppants are dump trucks and pneumatic tanks mounted on trucks (Fig.
4-56).
This equipment solves the problem
of
manually handling bulky materials and the
problem of providing constant supply to the proportioner and other equipment.
Tank trucks carry both liquids and many of the chemicals required for the
treatment.
Surface equipment
The suction systems set up to deliver materials to the proportioners vary from
area to area, depending on the type
of
fluid or proppant used, etc. The fluid can be
stored in:
(1)
earthen pits,
(2)
truck transports, and/or
(3)
fixed storage tanks
having various capacities and designs.
A
flexible hose between the proportioner and
Fig.
4-56.
Propping agent transport unit, 35,OOO-lb capacity, pneumatic. (After Howard and Fast,
1970,
fig. 8.26, p.
131;
courtesy of the Society of Petroleum Engineers.)

151
LEASE
ROAD
I
Fig.
4-57. Typical equipment layout for massive frac operation. (After Schlottman
et
al.,
1981,
fig.
17;
courtesy
of
the
Society of Petroleum Engineers.)
the fluid source constitutes the standard suction manifolding. Several different
systems can be set up because the handling of various fluids, proppants, and
chemicals can be quite different. Figure
4-57
demonstrates the variety of equipment
that is required for a large fracturing operation. Each system has an independent
monitoring system
so
that full control of each product can be maintained.
Pressure, injection rate, type of fluid, number of pumps, and sand/fluid ratio
govern the configuration
of
the system and the size
of
piping used.
As
pointed out
by Howard and Fast
(1970,
p.
131),
in
order
to
minimize the erosion
of
piping
caused by sand-fluid slurries, pumping rates should be kept below
40
ft/s. The
yield pressure must be at least two times the working pressure of the discharge lines
for pressures below
10,000
psi. If the working pressure is greater than
10,000
psi, the
yield pressure should be one and one half times the working pressure. In order to
combat the fatigue forces encountered in the pipe hook-ups, steel tubing with high
152
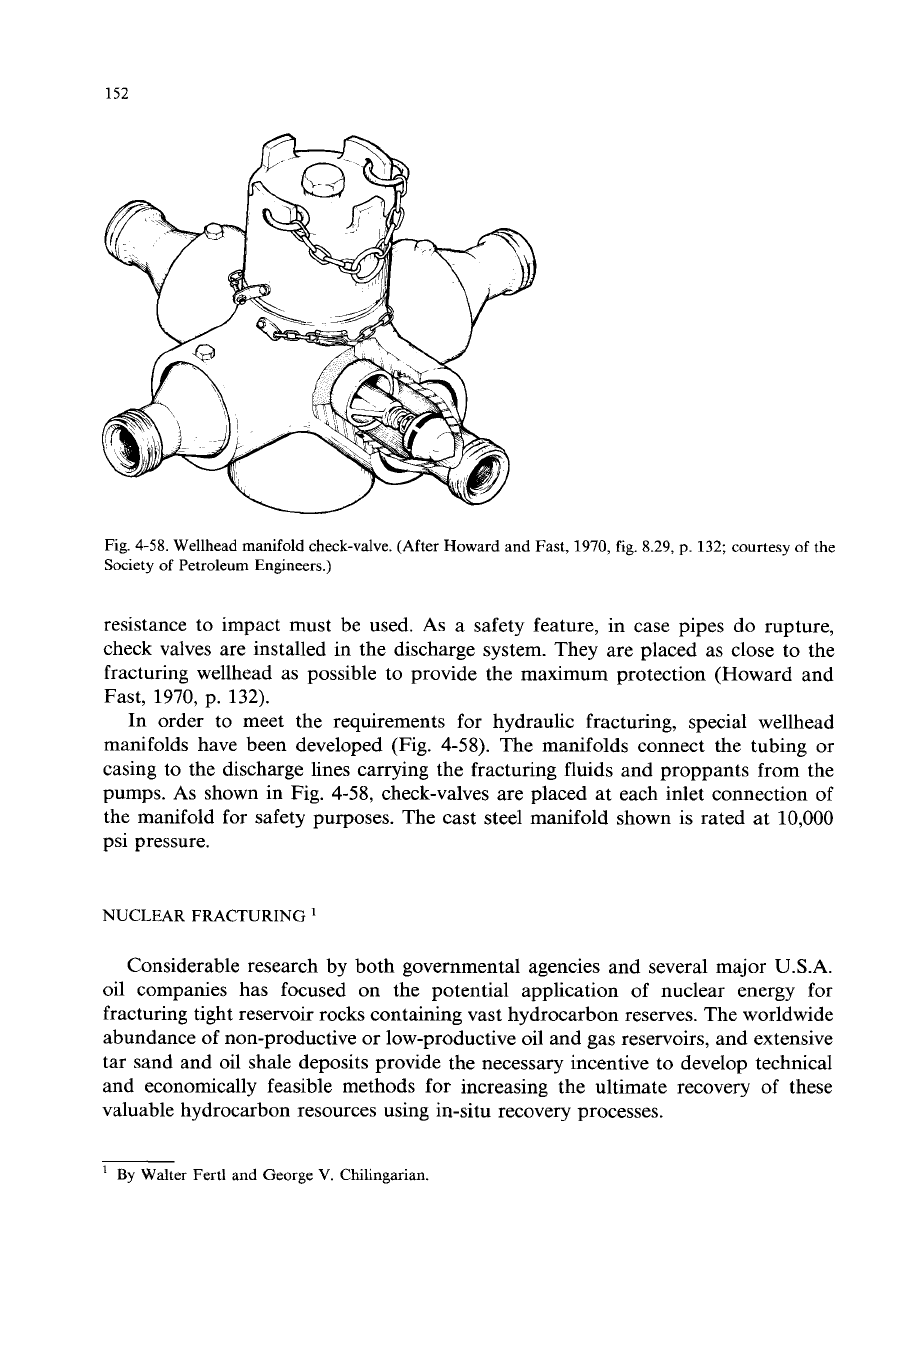
Fig. 4-58. Wellhead manifold check-valve. (After Howard and Fast,
1970,
fig.
8.29,
p.
132; courtesy
of
the
Society
of
Petroleum Engineers.)
resistance to impact must be used.
As
a safety feature, in case pipes do rupture,
check valves are installed in the discharge system. They are placed as close to the
fracturing wellhead as possible to provide the maximum protection (Howard and
Fast,
1970,
p.
132).
In order to meet the requirements for hydraulic fracturing, special wellhead
manifolds have been developed (Fig. 4-58). The manifolds connect the tubing or
casing to the discharge lines carrying the fracturing fluids and proppants from the
pumps.
As
shown in Fig. 4-58, check-valves are placed at each inlet connection of
the manifold for safety purposes. The cast steel manifold shown is rated at
10,000
psi pressure.
NUCLEAR FRACTURING
'
Considerable research by both governmental agencies and several major
U.S.A.
oil companies has focused on the potential application of nuclear energy for
fracturing tight reservoir rocks containing vast hydrocarbon reserves. The worldwide
abundance of non-productive or low-productive oil and gas reservoirs, and extensive
tar sand and oil shale deposits provide the necessary incentive to develop technical
and economically feasible methods for increasing the ultimate recovery of these
valuable hydrocarbon resources using in-situ recovery processes.
'
By
Walter Fertl and George
V.
Chilinganan.
153
The feasibility
of
nuclear fracturing has been demonstrated in several field tests
in the U.S.A. (Gnome test and Gasbuggy, Rulison, and
Rio
Blanco projects) and
other countries. Factors frequently involved are of a technical, economical, political,
environmental, and emotional nature.
From a technical standpoint, the major difference between hydraulic and nuclear
fracturing lies in the fact that whereas a hydraulic fracturing treatment normally
creates a simple fracture, nuclear fracturing forms a cavity
of
several hundred feet in
diameter with a multitude
of
fractures radiating from it into the otherwise tight
reservoir rock. The result is a very large effective wellbore radius (Atkinson and
Lekas,
1963)
which should allow
high
production rates. Oil shales and tar sands
could be retorted in situ and the hydrocarbon resources removed in gaseous or
liquid form, thereby eliminating the need for mining operations. If in-situ thermal
recovery processes, however, are considered, which are to be conducted through a
d
I
!
I
CAVITY
I
1
RADIUS
RADIUS
OF
PERMEABLE ZONE
Fig. 4-59. Schematic presentation
of
a typical post-shot environment using nuclear fracturing. (After
Fertl and Chilingarian, 1978, in: Chilingarian and Yen, 1978,
fig.
A-6, p. 304; courtesy
of
Elsevier
Science Publishers. Also see Boardman et al., 1964.)
154
TABLE
4-VII
Estimated volume of increased permeability for nuclear explosions in reservoir rock (After Coffer et al.,
1964;
courtesy of USAEC)
Yield (in Kt) at Cavity
Depth of Height
of
Volume of gross
scaled depth
of
radius
burial permeable permeability
burial (ft) (ft)
(ft) zone
increase
(ft) (acre-ft)
Kt
ft
10
800
450
100
800
450
500
800
450
1000
800
450
96
110
167
196
252
290
299
346
1720
970
3720
2100
6350
3600
8000
4500
540
620
940
1110
1420
1640
1690
1950
2.1
x
lo3
3.2
x
lo3
1.1
x
104
1.8
x
104
3.8
x
lo4
5.9
x
104
6.4~10~
1.0~10~
fracture system, the hydraulic fracturing techniques appear to be more advanta-
geous than the nuclear mass rubbling process.
Furthermore, in areas where the effectiveness of hydraulic fracturing has been
well established, nuclear fracturing cannot compete because of its high cost.
Guidelines for reservoir characteristics desired in the case of nuclear fracturing
include low reservoir permeability, massive zones bounded by thick impermeable
formations, gas-bearing reservoirs, and low-viscosity oil deposits.
Basically, a nuclear detonation in a wellbore creates a cavity resulting from the
vaporization of the rock and its saturating fluids. Fracture system radiates from this
cavity into the formation. Rock collapse into the cavity forms a chimney-rubble
zone, with most of the molten material and radioactive fission products con-
centrated in the bottom of these zones (Atkinson,
1964).
A schematic presentation
of
a typical post-shot environment resulting from a contained underground nuclear
explosion is illustrated in Fig.
4-59.
Studies of several contained underground nuclear explosions showed that the
nuclear devices have yielded a rather consistent model
of
the geometric features.
Mathematical relationshps have been developed for calculating specific characteris-
tics of the post-shot geometry as a function
of
the yield of the nuclear device, depth
of burial, and type
of
formation (Boardman et al.,
1964;
Bray et al.,
1965).
Table
4-VII
shows
(1)
the variation in cavity radius,
(2)
the volume of rock (in
acre-feet) in which there is a drastic permeability increase, and
(3)
height of the
created permeable zone as a function of yield at the depth of burial of
450
and
800
ft. Although these data are only qualitative, they do show how these parameters are
expected to vary.
For detailed treatment of fracturing, the reader
is
referred to the classical work of
Howard and Fast
(1970)
and excellent treatment of the subject by Craft et al.
(1962)
and Halliburton Company
(1976).