Bhushan B. Nanotribology and Nanomechanics: An Introduction
Подождите немного. Документ загружается.


354 Bharat Bhushan
the analytical expression with different components of friction force. The nonlin-
ear nature of micro/nanoscale friction force and its velocity dependence is apparent
from this expression.The different terms representing different friction mechanisms
are marked on the analytical expression in Fig. 8.29b and their relative order of
precedence with respect to sliding velocity is illustrated schematically. Each of these
mechanismswill be dominantdepending on the specificsliding interface, the rough-
ness distribution on the surfaces sliding past each other and material properties, as
well as the operating conditions such as sliding velocity, normal load and relative
humidity.
8.3.6 Nanoscale Friction and Wear Mapping
Contrary to the classical friction laws postulated by Amontons and Coulomb cen-
turies ago, nanoscale friction force is found to be strongly dependent on the normal
load and sliding velocity.Many materials, coatings and lubricants that have wide ap-
plications show reversals in friction behavior corresponding to transitions between
different friction mechanisms [37,84–86]. Most of the analytical models developed
for explaining nanoscale friction behavior have remained limited in their focus and
have left investigators short-handed when trying to explain friction behavior scaling
multiple regimes. Nanoscale friction maps provide fundamental insights into fric-
tion behavior. They help identify and classify the dominant friction mechanisms, as
wellas determinethe criticaloperatingparametersthat influencetransitionsbetween
different mechanisms [85,86]. Figure 8.30 shows a nanoscale friction map for DLC
with friction mapped as a function of the normal load and the sliding velocity [91].
The contours represent lines of constant friction force. The friction force is seen to
increase with normal load as well as velocity. The increase in friction force with
velocity is the result of atomic-scale stick–slip and is a result of thermal activation
Normal load (nN)
Velocity (μm/s)
10
1
10
3
24
20
16
12
8
4
10
2
3
2.5
2
1.5
1
Fig. 8.30. Contour map show-
ing friction force dependence
on normal load and sliding
velocity for DLC. Contour
lines are constant friction
force lines [91]
8 Nanotribology, Nanomechanics and Materials Characterization 355
of the irreversible jumps of the AFM tip that arise from overcoming of the energy
barrier between adjacent atomic positions, as described earlier. The concentric con-
tour lines, corresponding to constant friction force predicts a peak point, a point
where the friction force reaches a maxima and beyond which any further increase
in the normal load or the sliding velocity results in a decrease in the friction force.
This characteristic behavior for DLC is the result of a phase transformation of DLC
into a graphite-like phase by sp
3
-to-sp
2
phasetransition, as describedearlier. During
the AFM experiments, the Si
3
N
4
tip gives rise to contact pressures in the range of
1.8–4.4GPa for DLC for normal loads of 10–150nN [87]. A combination of the
high contact pressures that are encountered on the nanoscale and the high frictional-
energy dissipation arising from the asperity impacts at the tip–sample interface due
to the high sliding velocities accelerates a phase-transition process whereby a low-
shear-strength graphite-like layer is formed at the sliding interface.
Similar to friction mapping,one way of exploringthe broader wear patternsis to
construct wear mechanism maps that summarize data and models for wear, thereby
showing mechanisms for any given set of conditions to be identified [94–96]. Wear
of sliding surfaces can occur by one or more wear mechanisms, including adhesive,
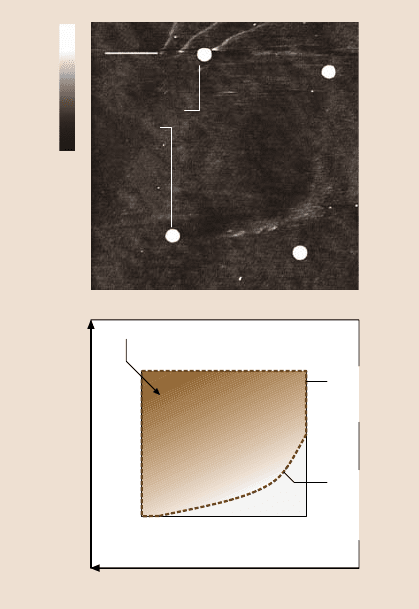
Wear mark
corners
Increasing
normal load
0 – 1000 nN
5 nm
0
Region of highest wear
Wear mark
boundary
(dashed line)
Phase
trans-
formation
boundary
Increasing velocity 0 – 2.5 mm/s
2 μm
Fig. 8.31. Nanowear map
(AFM image and schematic)
illustrating the effect of slid-
ing velocity and normal load
on the wear of DLC resulting
from phase transformation.
The curved area shows debris
lining and is indicative of the
minimum frictional energy
needed for phase transfor-
mation. For clarity, the wear
mark corners are indicated by
white dots in the upper AFM
image and the various zones
of interest over the entire
wear mark are schemati-
cally illustrated in the lower
image [94]
356 Bharat Bhushan
abrasive, fatigue, impact, corrosive,and fretting [5,10]. Tambe and Bhushan [87,94]
performed AFM experiments to develop nanoscale wear maps. Figure 8.31 shows
a nanowear map generated for a DLC sample by simultaneously varying the normal
load and the sliding velocity over the entire scan area. The wear map was generated
for a normal load range of 0–1000nN and sliding velocity range of 0–2.5mm/s.
Wear debris, believed to result from phase transformation of DLC by an sp
3
-to-sp
2
phase transition, was seen to form only for high values of sliding velocities times
normalloads, i.e., only beyondcertain threshold friction-energydissipation [87,94].
Hence the wear regionexhibits a transition line indicating that for low velocities and
low normalloadsthere isno phasetransformation.Forclarity, thewear markcorners
are indicated by white dots in the AFM image (top) and the two zones of interest
over the entire wear mark are illustrated schematically in Fig. 8.31 (top).
Nanoscalefriction and wear mappingare novel techniquesfor investigating fric-
tion force and wear behavior on the nanoscale over a range of operating parameters.
By simultaneously varying the sliding velocity and normal load over a large range
of values, nanoscale friction and wear behavior can be mapped and the transitions
between different wear mechanisms can be investigated. These maps help identify
and demarcate critical operating parameters for different wear mechanisms and are
very important tools in the process of design and selection of materials/coatings.
8.3.7 Adhesion and Friction in a Wet Environment
Experimental Observations
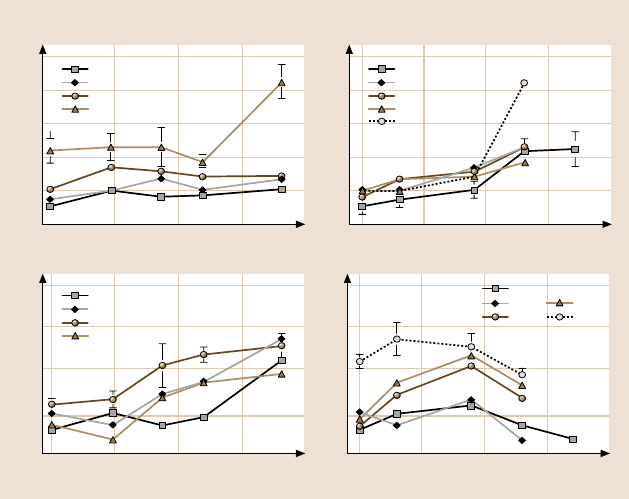
The tip radius and relative humidity affect adhesion and friction. The relative hu-
midity affects adhesion and friction for dry and lubricated surfaces [30, 97, 98].
Figure 8.32 shows the variation of single-point adhesive force measurements as
a function of tip radius on a Si(100) sample for several humidities. The adhesive
force data are also plotted as a function of relative humidity for several tip radii.
The general trend at humidities up to the ambient is that a 50-nm-radius Si
3
N
4
tip
exhibits a lower adhesive force compared to the other microtips of larger radii; in
the latter case, the values are similar. Thus for the microtips there is no appreciable
variation in adhesive force with tip radius at a given humidity up to ambient. The
adhesive force increases as relative humidity increases for all tips.
Sources of adhesive force between a tip and a sample surface are van der Waals
attractionand meniscusformation [5,10,98].Relative magnitudesof the forces from
the two sources are dependent upon various factors, including the distance between
the tip and the sample surface, their surface roughness, their hydrophobicity, and
relative humidity [99]. For most rough surfaces, the meniscus contribution domi-
nates at moderate to high humidities, which arise from capillary condensation of
water vapor from the environment. If enough liquid is present to form a meniscus
bridge, the meniscus force should increase with increasing tip radius (proportional
to tip radius for a spherical tip). In addition, an increase in tip radius results in
increased contact area, which leads to higher values of the van der Waals forces.
8 Nanotribology, Nanomechanics and Materials Characterization 357
250
200
150
100
50
0
0481216
250
200
150
100
50
0
0 25 50 75 100
0.2
0.15
0.1
0.05
0
0481216
Tip radius (μm)
0.2
0.15
0.1
0.05
0
0
Relative humidity (%)
25 50 75 100
0% Rh
15%
45%
62%
Adhesive force (nN)
Si(100)
0%
15%
45%
65%
RH
Adhesive force (nN)
0.05 μm (Si
3
N
4
)
3.8
6.9
9.5
14.5
Coefficient of friction Coefficient of friction
0.05 μm (Si
3
N
4
)
3.8
6.9
9.5
14.5
Fig. 8.32. Adhesive force and coefficient of friction as a function of tip radius at several
humidities and as a function of relative humidity at several tip radii on Si(100) [30]
However, if nano-asperities on the tip and the sample are considered then the num-
ber of contacting and near-contacting asperities forming meniscus bridges increases
with increasing humidity, leading to an increase in meniscus forces. These explain
the trends observed in Fig. 8.32. From the data, the tip radius has little effect on
the adhesive forces at low humidities but increases with tip radius at high humidity.
Adhesive force also increases with increasing humidity for all tips. This observation
suggests that the thickness of the liquid film at low humidities is insufficient to form
continuousmeniscus bridges that would affect adhesive forces in the case of all tips.
Figure 8.32 also shows the variation in the coefficient of friction as a function
of tip radius at given humidity, and as a function of relative humidity for a given tip
radius for Si(100). It can be observed that, for 0% RH, the coefficient of friction is
about thesame for the tip radii exceptfor the largesttip, whichshows ahigher value.
At all other humidities, the trend consistently shows that the coefficient of friction
increases with tip radius. An increase in friction with tip radius at low to mod-
erate humidities arises from increased contact area (higher van der Waals forces)
and higher values of shear forces required for larger contact area. At high humidi-
ties, similarly to the adhesive force data, an increase with tip radius occurs because
of both contact-area and meniscus effects. Although AFM/FFM measurements are
able to measure the combined effect of the contribution of van der Waals and menis-
358 Bharat Bhushan
cus forces towards friction force or adhesive force, it is difficult to measure their
individual contributions separately. It can be seen that, for all tips, the coefficient of
frictionincreaseswith humidityto aboutambient,beyondwhichit starts todecrease.
The initial increase in the coefficient of friction with humidity arises from the fact
that the thickness of the water film increases with increasing humidity,which results
in a larger number of nano-asperities forming meniscus bridges and leads to higher
friction (larger shear force). The same trend is expected with the microtips beyond
65% RH. This is attributed to the fact that, at higher humidities, the adsorbed water
film on the surface acts as a lubricant between the two surfaces. Thus the interface
is changed at higher humidities, resulting in lower shear strength and hence a lower
friction force and coefficient of friction.
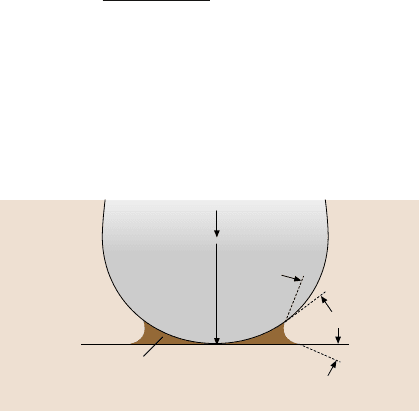
Adhesion and Friction Force Expressions for a Single-Asperity Contact
We now obtain the expressions for the adhesive force and coefficient of friction
for a single-asperity contact with a meniscus formed at the interface, Fig. 8.33.
For a spherical asperity of radius R in contact with a flat and smooth surface with
a composite modulus of elasticity E
∗
and in the presence of liquid with a concave
meniscus, the attractive meniscus force (adhesive force), designated as F
m
or W
ad
is
given by [6,10]:
W
ad
= 2πRγ
(
cosθ
1
+ cosθ
2
)
, (8.6)
where γ is the surface tension of the liquid and θ
1
and θ
2
are the contactangles of the
liquid with surfaces 1 and 2, respectively. For an elastic contact for both extrinsic
(W) and intrinsic (W
ad
) normal load, the friction force is given as,
F
e
= πτ
3
(
W + W
ad
)
R
4E
∗
2/3
, (8.7)
where W is the external load, and τ is the average shear strength of the contacts.
(Surface energy effects are not considered here.) Note that the adhesive force in-
creases linearly with increasing the tip radius, and the friction force increases with
increasing tip radius as R
2/3
andwith normal load as (W+ W
ad
)
2/3
. The experimental
data in support of the W
2/3
dependence on the friction force can be found in various
R
θ
2
θ
1
Liquid with surface tension γ
Flat
Sphere
F
m
F
m
= 2πRγ (cosθ
1
+ cosθ
2
)
Fig. 8.33. Meniscus forma-
tion from a liquid condensate
at the interface for a sphere in
contact with a plane surface

8 Nanotribology, Nanomechanics and Materials Characterization 359
references (see e.g., Schwarz et al. [100]). The coefficient of friction μ
e
is obtained
from (8.7) as
μ
e
=
F
e
(
W + W
ad
)
= πτ
3R
4E
∗
2/3
1
(
W + W
ad
)
1/3
. (8.8)
In the plastic contact regime [6], the coefficient of friction μ
p
is obtained as
μ
p
=
F
p
(
W + W
ad
)
=
τ
H
s
, (8.9)
where H
s
is the hardness of the softer material. Note that, in the plastic contact
regime, the coefficient of friction is independent of the external load, adhesive con-
tributions and surface geometry.
For comparisons, for multiple-asperity contacts in the elastic contact regime the
total adhesiveforce W
ad
is the summationof adhesive forces at n individualcontacts,
W
ad
=
n
i=1
W
ad
i
and μ
e
≈
3.2τ
E
∗
σ
p
/R
p
1/2
+
W
ad
/W
, (8.10)
where σ
p
and R
p
are the standard deviation of the summit heights and average sum-
mit radius, respectively. Note that the coefficient of friction depends upon the sur-
face roughness. In the plastic contact regime, the expression for μ
p
in (8.9) does not
change.
The source of the adhesiveforce, in a wet contact in the AFM experimentsbeing
performedin anambient environment,includesmainly attractivemeniscusforce due
to capillary condensation of water vapor from the environment. The meniscus force
for a single contact increases with increasing tip radius. A sharp AFM tip in contact
with a smooth surface at low loads (on the order of a few nN) for most materials
can be simulated as a single-asperity contact. At higher loads, for rough and soft
surfaces, multiple contacts would occur. Furthermore, at low loads (nN range) for
most materials, the local deformation would be primarily elastic. Assuming that the
shear strength of contacts does not change, the adhesive force for smooth and hard
surfaces at low normal load (on the order of a few nN) (for a single-asperity contact
in the elastic contactregime) would increase with increasing tip radius, and the coef-
ficient of frictionwould decrease with increasing total normal load as (W + W
ad
)
−1/3
and wouldincrease with increasingtip radius as R
2/3
. In thiscase, the Amontonslaw
of friction, which states that the coefficientof friction is independentof normal load
and is independent of apparent area of contact, does not hold. For a single-asperity
plastic contact and multiple-asperity plastic contacts, neither the normal load nor
the tip radius come into play in the calculation of the coefficient of friction. In the
case of multiple-asperity contacts, the number of contacts increase with increasing
normal load; therefore the adhesive force increases with increasing load.
In the data presented earlier in this section, the effect of tip radius and humidity
on the adhesiveforces and coefficient of friction is investigatedfor experimentswith

360 Bharat Bhushan
Si(100) surface at loads in the range of 10–100nN. The multiple-asperity elastic-
contact regime is relevant for this study involving large tip radii. An increase in
humidity generally results in an increase of the number of meniscus bridges, which
would increase the adhesive force. As was suggested earlier, this increase in humid-
ity may also decrease the shear strength of contacts.A combination of an increase in
adhesive force and a decrease in shear strength would affect the coefficient of fric-
tion. An increase in tip radius would increase the meniscus force (adhesive force).
A substantial increase in the tip radius may also increase interatomic forces. These
effects influence the coefficient of friction with increasing tip radius.
Roughness Optimization for Superhydrophobic Surfaces
One of thecrucial surfaceproperties forsurfaces in wet environmentsis non-wetting
or hydrophobicity.It is usually desirable to reduce wetting in fluid flow applications
and some conventional applications, such as glass windows and automotive wind-
shields, in order for liquid to flow away along their surfaces. Reduction of wetting
is also important in reducing meniscus formation, consequently reducing stiction,
friction, and wear. Wetting is characterized by the contact angle, which is the angle
between the solid and liquid surfaces. If the liquid wets the surface (referred to as
a wettingliquid or hydrophilicsurface),thevalueof thecontact angleis 0
◦
≤θ ≤90
◦
,
whereas if the liquid does not wet the surface (referred to as a non-wetting liquid
or hydrophobic surface), the value of the contact angle is 90
◦
<θ≤ 180
◦
. Super-
hydrophobic surfaces should also have very low water contact angle hysteresis.
A surface is considered superhydrophobic if θ is close to 180
◦
. One of the ways
to increase the hydrophobic or hydrophilic properties of the surface is to increase
surface roughness. It has been demonstrated experimentally that roughness changes
contact angle. Some natural surfaces, includingleaves of water-repellentplants such
as lotus, are known to be superhydrophobicdue to high roughness and the presence
of a wax coating. This phenomenon is called in the literature the lotus effect [102].
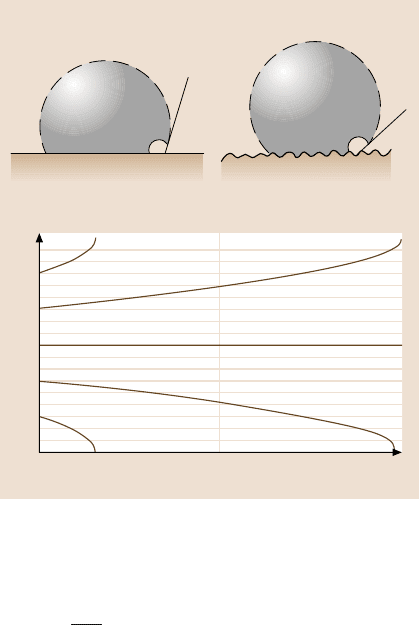
If a droplet of liquid is placed on a smooth surface, the liquid and solid surfaces
come together under equilibrium at a characteristic angle called the static contact
angle θ
0
, Fig. 8.34a. The contact angle can be determined from the condition of the
total energy of the system being minimized. It can be shown that
cosθ
0
= dA
LA
/ dA
SL
, (8.11)
where θ
0
is the contact angle for smooth surface, A
SL
and A
LA
are the solid–liquid
and liquid–aircontact areas.Next,let us considera roughsolid surface witha typical
size of roughness details smaller than the size of the droplet, Fig. 8.34. For a rough
surface,the roughness affects the contact angledue to an increased contact area A
SL
.
For a droplet in contact with a rough surface without air pockets, referred to as
a homogeneous interface, based on the minimization of the total surface energy of
the system, the contact angle is given as [103]
cosθ = dA
LA
/ dA
F
=
A
SL
A
F
(
dA
LA
/ dA
SL
)
= R
f
cosθ
0
, (8.12)
8 Nanotribology, Nanomechanics and Materials Characterization 361
θ
R
f
12
180
150
120
90
60
30
0
1.5
θ
0
θ
Air
Liquid
Solid
Smooth surface
Air
Liquid
Solid
Effect of roughness
θ
0
= 150
θ
0
= 120
θ
0
= 90
θ
0
= 60
θ
0
= 30
a)
b)
Fig. 8.34. (a) Droplet of liq-
uid in contact with a smooth
solid surface (contact angle
θ
0
) and rough solid surface
(contact angle θ), and (b)
contact angle for rough sur-
face (θ) as a function of the
roughness factor (R
f
)forvari-
ous contact angles for smooth
surface (θ
0
) [101]
where A
F
is the flat solid–liquidcontact area (or a projectionof the solid–liquidarea
A
SL
onto the horizontal plane). R
f
is a roughness factor defined as
R
f
=
A
SL
A
F
. (8.13)
Equation (8.13) shows that, if the liquid wets a surface (cosθ
0
> 0), it will also wet
the rough surface with a contact angle θ<θ
0
, and for non-wetting liquids (cosθ
0
<
0), the contact angle with a rough surface will be greater than that with the flat
surface, θ>θ
0
. The dependence of the contact angle on the roughness factor is
presented in Fig. 8.34bfor different values of θ
0
, based on (8.12). It should be noted
that (8.12) is valid only for moderate roughness, when R
f
cosθ
0
< 1 [102].
For high roughness, air pockets (composite solid–liquid–air interface) will be
formed in the cavities of the surface [104]. In the case of partial contact, the contact
angle is given by
cosθ = R
f
f
SL
cosθ
0
− f
LA
, (8.14)
where f
SL
and f
LA
are fractional solid–liquid and liquid–air contact areas. The ho-
mogeneous and composite interfaces are two metastable states of the system. In
reality, some cavities will be filled with liquid, and others with air, and the value of
the contactangle is between thevaluespredicted by (8.12)and (8.14).If the distance
is large between the asperities or if the slope changes slowly, the liquid–air interface
can easily be destabilized due to imperfectness of the profile shape or due to the
362 Bharat Bhushan
θ
d
< θ
0
α > α
0
Liquid
Air
Solid
ds
α
Liquid
Air
Solid
θ
d
> θ
0
θ
d
> θ
0
a)
b)
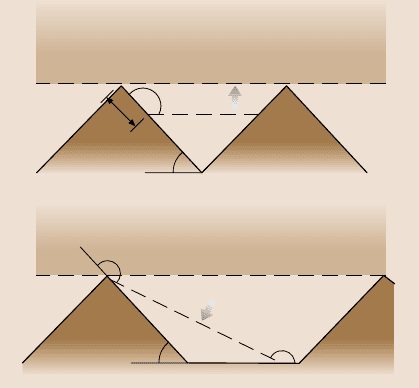
Fig. 8.35. (a) Formation of
a composite solid–liquid–
air interface for sawtooth
and smooth profiles, and
(b) destabilization of the
composite interface for the
sawtooth and smooth profiles
due to dynamic effects. Dy-
namic contact angle θ
d
>θ
0
corresponds to advancing
liquid–air interface, whereas
θ
d
<θ
0
corresponds to the
receding interface [101]
dynamic effects, such as surface waves (Fig. 8.35). Nosonovsky and Bhushan [101]
proposed a stochastic model, which relates the contact angle to the roughness and
takes into account the possibility of destabilization of the composite interface due
to imperfectness of the shape of the liquid–air interface, caused by effects such as
capillary waves.
In addition to the surface roughness, sharp edges of asperities may affect wet-
ting, because they can pin the line of contact of the solid, liquid, and air (also known
as the triple line) and resist liquid flow. Nosonovsky and Bhushan [102] considered
the effect of the surface roughness and sharp edges and found the optimum rough-
ness distribution for non-wetting. They formulated five requirements for roughness-
induced superhydrophobic surfaces. First, asperities must have a high aspect ratio
to provide a high surface area. Second, sharp edges should be avoided, to prevent
pinning of the triple line. Third, asperities should be tightly packed to minimize the
distance between them and avoid destabilization of the composite interface. Fourth,
asperities should be small compared to the typical droplet size (on theorder of a few
hundredmicronsor larger).And fifth,in the caseof hydrophilicsurface,a hydropho-
bic film must be applied in order to have initially θ>90
◦
. These recommendations
can be utilized for producingsuperhydrophobicsurfaces.Remarkably, all these con-
ditions are satisfied by biological water-repellentsurfaces, such as some leaves: they
havetightly packedhemispherically toppedpapillae with high(on theorder ofunity)
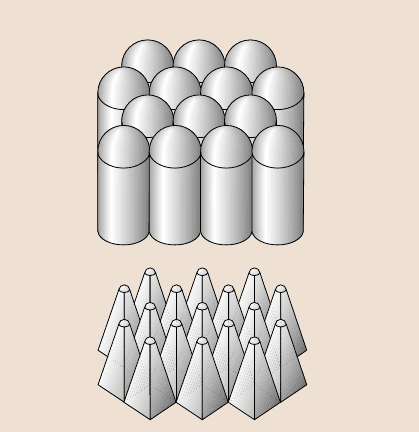
aspect ratios and a wax coating [102]. Figure 8.36 shows two recommended geome-
tries which use either hemispherically topped asperities with a hexagonal packing
pattern or pyramidal asperities with a rounded top. These geometries can be used
for producing superhydrophobicsurfaces.
Burton and Bhushan [105] have provided indirect evidence of an increase in
contact angle and a decrease in adhesive force with the presence of discrete asper-
8 Nanotribology, Nanomechanics and Materials Characterization 363
Optimized surfaces
Fig. 8.36. Optimized rough-
ness distribution – hemi-
spherically topped cylindri-
cal asperities (upper)and
pyramidal asperities (lower)
with square foundation and
rounded tops. Square bases
provide higher packing den-
sity but introduces undesir-
able sharp edges [102]
ities with high aspect ratios based on measurements on smooth hydrophobic films
(cosθ
0
< 0) and those with discrete asperities in a humid environment.
8.3.8 Separation Distance Dependence of Meniscus and van der Waals Forces
When two surfaces are in close proximity, sources of adhesive forces are weak van
der Waals attraction and meniscus formation. The relative magnitudes of the forces
from the two sources are dependent upon various factors including the interpla-
nar separation, their surface roughness, their hydrophobicity, and relative humidity
(liquid volume) [99]. The meniscus contribution dominates at moderate to high hu-
midities and van der Waals forces dominate at asperities a few nm apart. In some
micro/nanocomponents,it is important to know the relative contribution of the two
sources as a function of a given interplanar separation to design an interface for low
adhesion. For example, if two ultrasmooth surfaces come in close proximity with
interplanar separation on the order of a nm, van der Waals forces may dominate and
their magnitude may be reduced by creating bumps on one of the interfaces. This
analysis is also of interest in AFM studies to understand the distance dependence of
adhesive forces as the tip goes in and out of contact.
Stifter et al. [99]modeled the contactof a parabolic-shapedtip and a flat, smooth
sample surface. The tip may represent a surface asperity on an interface or an AFM
tip in an AFM experiment. They calculated van der Waals and meniscus forces as
a function of different parameters, namely, tip geometry, tip–sample starting dis-
tance, relative humidity, surface tension, and contact angles. They compared the
meniscus forces with van der Waals forces to understand their relative importance
in various operating conditions.