Bhushan B. Nanotribology and Nanomechanics: An Introduction
Подождите немного. Документ загружается.

344 Bharat Bhushan
Surface height (nm)
010
250
0
–250
Friction force (V)
010
0.35
0
–0.35
Friction force (V)
0
10
0.35
0
–0.35
Friction force (V)
010
0.35
0
–0.35
Scan distance (μm)
High
friction
Low
friction
Low
friction
High
friction
T
R
T-R
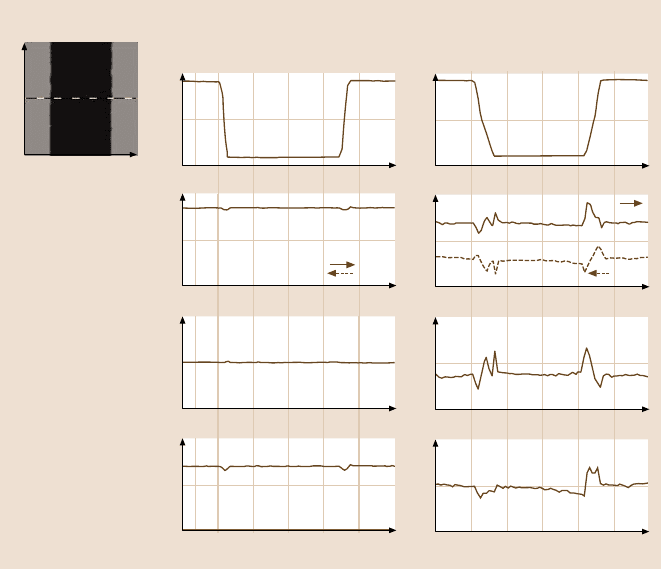
b)
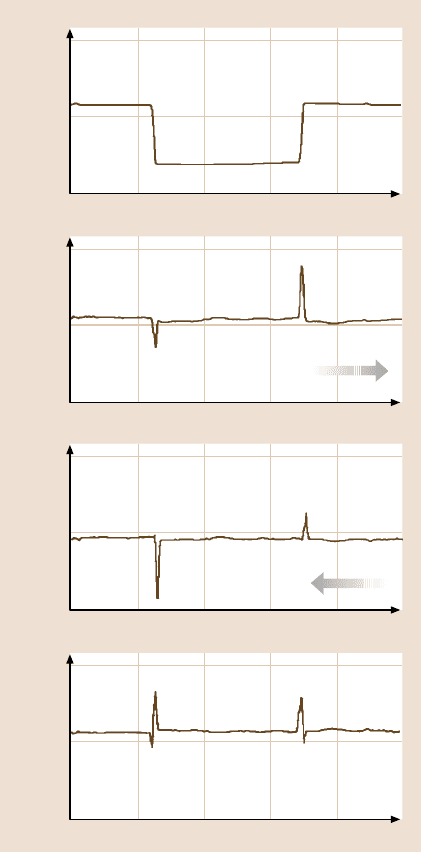
Fig. 8.21. (b) two dimen-
sional profiles of surface
height and friction forces
across a silicon grid pit.
Friction force data in trace
and retrace directions, and
subtracted force data are pre-
sented
with particles having a preferred orientation. The directionality effect in friction on
a macroscale is observed in some magnetic tapes. In a macroscale test, a 12.7-mm-
wide polymeric magnetic tape was wrapped over an aluminum drum and slid in
a reciprocating motion with a normal load of 0.5N and a sliding speed of about
60mm/s [3]. The coefficient of friction as a function of sliding distance in either di-
rection is shown in Fig. 8.23. We note that the coefficient of friction on a macroscale
for this tape is different in different directions. Directionality in friction is some-
8 Nanotribology, Nanomechanics and Materials Characterization 345
Friction force (V)
010
0.35
0
–0.35
Surface slope
2
0
–2
010010
Surface height (nm)
250
0
–250
Scan distance (μm) Scan distance (μm)Scan distance (μm)
0 5.00
μm
0 5.00
μm
0 5.00
μm
a)
b)
Low
friction
High
friction
Low
friction
High
friction
Trace Retrace
–Retrace
Surface
height
Trace Retrace
Surface
slope
Friction
force
–Retrace
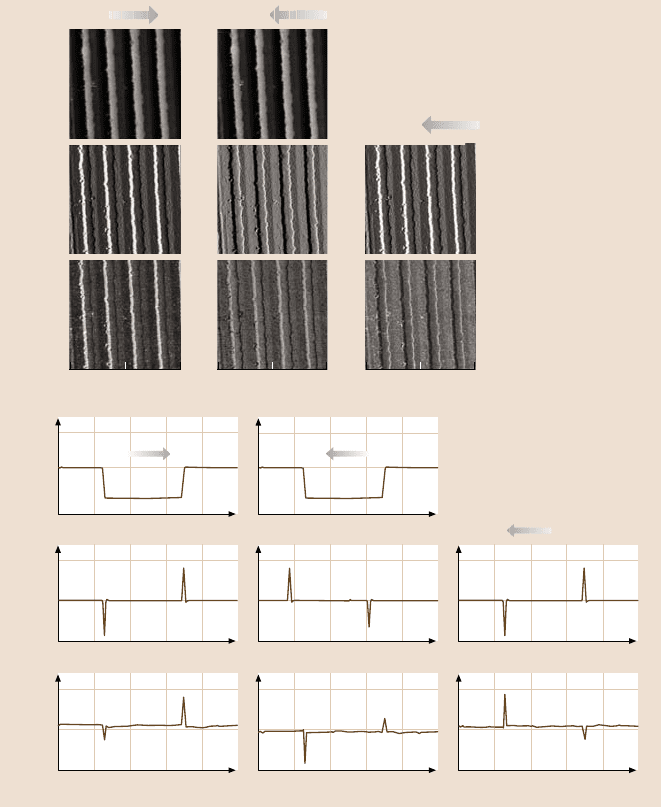
Fig. 8.22. (a) Greyscale images of surface heights, surface slopes and friction forces for
scans across a gold-coated ruling, and (b) two-dimensional profiles of surface heights, surface
slopes and friction forces for scans across the silicon grid pit. Arrows indicate the tip sliding
direction [80]
times observed on the macroscale; on the microscale this is the norm [4, 15]. On
the macroscale, the effect of surface asperities is normally averaged out over a large
number of contacting asperities.
346 Bharat Bhushan
Forward
Forward
Coefficient of friction
Number of drum passes
0 125
0.4
0.3
0.2
0.1
0
25 50 75 100
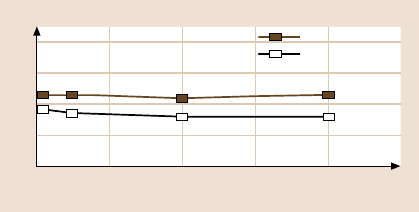
Fig. 8.23. Coefficient of macroscale friction as a function of drum passes for a polymeric
magnetic tape sliding over an aluminum drum in a reciprocating mode in both directions.
Normal load = 0.5 N over 12.7-mm-wide tape, sliding speed = 60 mm/s [65]
8.3.4 Surface-Roughness-Independent Microscale Friction
As just reported, friction contrast in conventional friction measurements is based on
interactions that are dependent upon interfacial material properties superimposed
with roughness-induced lateral forces, and the cantilever twist is dependent on the
sliding direction because of the local surface slope. Hence it is difficult to separate
friction-induced from roughness-induced cantilever twist in the image. To obtain
roughness-independentfriction, lateral or torsional modulation techniques are used
in which the tip is oscillated in-plane with a small amplitude at a constant normal
load, and changes in the shape and magnitude of the cantilever resonance are used
as a measure of the friction force [31–36,82]. These techniques also allow measure-
ments over a very small region (a few nm to a few µm).
Scherer et al. [32] and Reinstaedtler et al. [33, 34] used the lateral mode for
friction measurements (Fig. 8.10b). Bhushan and Kasai [36] used the TR mode
for these measurements (Fig. 8.11). Before engagement, the cantilever is driven into
torsional motion of the cantilever/tipassembly with a given normal vibration ampli-
tude (the vibration amplitude in free air). After engagement,the vibration amplitude
decreases due to the interaction between the tip and the sample, the vibration fre-
quency increases and a phase shift occurs. During scanning, the normal load is kept
constant, and the vibration amplitude of the cantilever is measured at the contact
frequency.
As mentionedearlier,the shift inthe contact resonance frequencyin both the lat-
eral and the TR modes is a measure of the contact stiffness, as shown schematically
in Fig. 8.24. At excitation voltage above a certain value, as a result of micro-slip at
the interface, a flattening of the resonance frequency spectra occurs (Fig. 8.22). At
the lowest excitation voltage, the AFM tip sticks to the sample surface and follows
the motion like an elastic contact with viscous damping, and the resonance curve
is Lorentzian with a well-defined maximum. The excitation voltage should be high
enough to initiate micro-slip. The maximum torsional amplitude at a given reso-
nance frequencyis a function of friction force and sample stiffness, so the technique
8 Nanotribology, Nanomechanics and Materials Characterization 347
TR amplitude (V)
TR amplitude versus frequency
TR amplitude (V)
Frequency (kHz)
Material with two stiffness regions
with no slip
Material with uniform stiffness
with slip (plateau)
Excitation
voltage
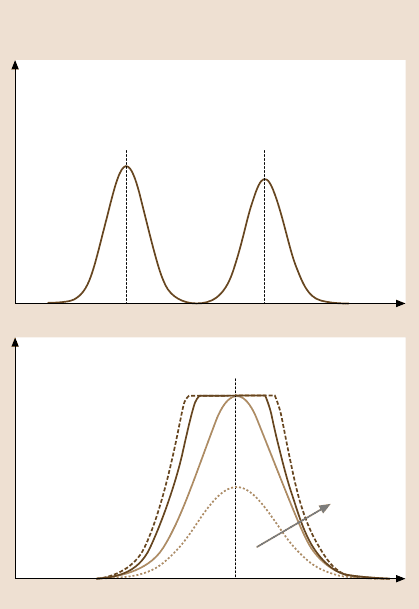
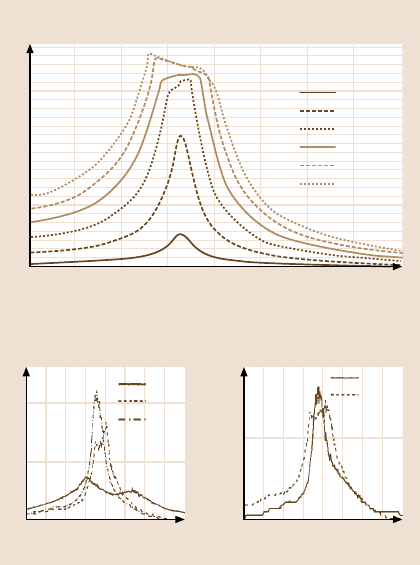
Fig. 8.24. Schematic show-
ing frequency profiles of the
TR amplitude for materials
with two phases and a sin-
gle phase. The maximum
TR amplitude at the contact
resonance frequency of the
resonance curve with a flat-
tened top, resulting from slip,
can be used for friction force
measurement
is not valid for inhomogeneoussamples. If the torsional stiffness of the cantilever is
very high compared to the sample stiffness, the technique should work.
Reinstaedtler et al. [33] performed lateral-mode experiments on bare Si and Si
lubricated with 5-nm-thick chemically bonded perfluoropolyether (Z-DOL) lubri-
cant film. Figure 8.25a shows the amplitude of the cantilever torsional vibration as
a function of frequency on a bare silicon sample. The frequency sweep was ad-
justed such that a contact resonance frequency was covered. The different curves
correspond to different excitation voltages applied to the shear-wave transducer. At
low amplitudes, the shape of the resonance curve is Lorentzian. Above a critical
excitation amplitude of the transducer (excitation voltage = 4V corresponding to
≈ 0.2 nm lateral surface amplitude, as measured by interferometry), the resonance
curve flattens out and the frequency span of the flattened part increases further with
the excitation amplitude. Here, the static force applied was 47nN and the adhesion
force was 15 nN. The resonance behavior of the tip–cantilever system in contact
with the lubricated silicon sample (Fig. 8.25b) was similar to that of the bare sili-
con sample. By increasing the static load, the critical amplitude for the appearance
of the flattening increases. The deviations from the Lorentzian resonance curve be-
348 Bharat Bhushan
Torsional amplitude θ (arb. units)
Frequency (kHz)
230 250
6
5
4
3
2
1
0
240
θ (arb. units)
Frequency (kHz)
210 250
2
1
0
230
θ (arb. units)
Frequency (kHz)
210 250
1
0
230
a)
Si
Excitation
voltage (V)
0.5
2
4
6
8
10
23 nN
70 nN
95 nN
Si
Si
Si+
5 nm
Z-DOL
c) Effect of lubricant filmb) Effect of load
Fig. 8.25. Torsional vibration
amplitude of the cantilever
as a function of excitation
frequency. (a) Measurement
on bare silicon. The differ-
ent curves correspond to
increasing excitation voltages
applied to the transducer and,
hence, increasing surface
amplitudes. (b) Measure-
ment on silicon lubricated
with a 5-nm-thick Z-DOL
layer. Curves for three dif-
ferent static loads are shown.
The transducer was excited
with an amplitude of 5 V.
(c) Measurement with a static
load of 70 nN and an exci-
tation amplitude of 7 V. The
two curves correspond to bare
silicon and lubricated silicon,
respectively [33]
came visible at static loads lower than 95nN. As shown in Fig. 8.25c, the resonance
curve obtained at the same normal load of 70 nN and at the same excitation volt-
age (7 V) is more flattened on the lubricated sample than on the bare silicon, which
led us to conclude that the critical amplitude is lower on the lubricated sample than
on the bare sample. These experiments clearly demonstrate that torsional vibration
of an AFM cantilever at ultrasonic frequencies leads to stick–slip phenomena and
sliding friction. Above a critical vibration amplitude, sliding friction sets in.
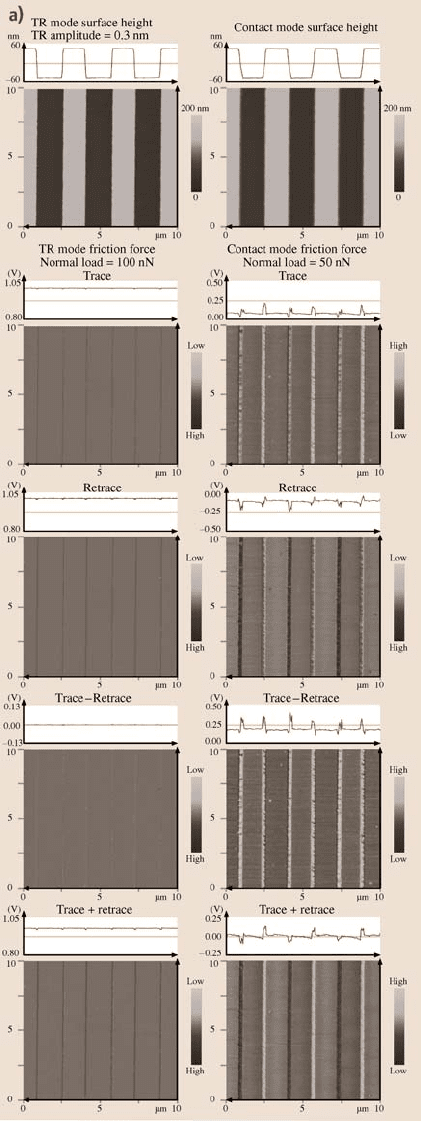
Bhushan and Kasai [36] performed friction measurements on a silicon ruler and
demonstrated that friction data in the TR mode is essentially independent of surface
roughnessand slidingdirection.Figure 8.26ashowssurfaceheight and frictionforce
maps on a silicon ruler obtained using the TR mode and contact-mode techniques.
A comparison is made between the TR mode and contact-modefriction force maps.
For easy comparison, the line scan profiles near the central area are shown on top of
the greyscalemaps. The verticalscales of the frictionforce profilesin the two graphs
areselected to coverthe samerange of frictionforce sothat directcomparisoncan be
made, i.e., 0.25V in full scale for the TR mode corresponds to 0.5V for the contact
modein these measurements.As expected,for the tracescan, small downwardpeaks
in theTR modemap andlargeupwardand downwardpeaks inthe contactmode map
are observed. The positions of these peaks coincide with those of the surface slope;
8 Nanotribology, Nanomechanics and Materials Characterization 349
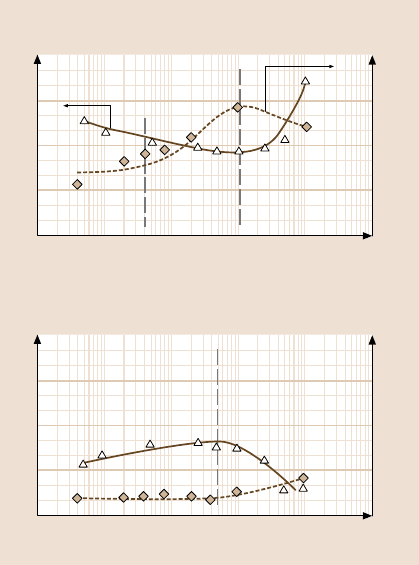
Fig. 8.26. (a) A comparison
between the TR-mode friction
and contact-mode friction
maps together withline scans,
on the silicon ruler. The TR-
mode surface height and
contact-mode surface height
images are also shown
350 Bharat Bhushan
μm
3.0
1.5
0
0 1.5 3.0
b)
Surface height (nm)
Scan distance (μm)
0.0
3.0
60
0
–60
TR amplitude (V)
1.05
0.80
TR amplitude (V)
0.13
0.00
–0.13
TR amplitude (V)
1.05
0.80
Surface height (nm)
60
0
–60
Friction force (V)
0.25
0.00
–0.25
Friction force (V)
0.50
0.25
0.00
Friction force (V)
0.25
0.00
–0.25
Scan distance (μm)
0.0
3.0
Silicon ruler
TR mode friction force
TR amplitude = 0.3 nm
Normal load = 100 nN
Contact mode friction force
Normal load = 50 nN
Trace
Retrace Retrace
Trace
Trace – Retrace Trace – Retrace
Trace + Retrace Trace + Retrace
Fig. 8.26. (b) A comparison of the line scans of the TR-mode friction and contact-mode
friction on a selected pitch of the silicon ruler [36]
therefore, the peaks in the friction signals are attributed to a topography-induced
effect. For the retrace scan, the peak pattern for the TR mode stays similar, but for
the contact mode, the pattern becomes reversed.
The subtraction image for the TR mode shows almost flat contrast, since the
trace and retrace friction data profiles are almost identical. For the contact mode,
the subtraction image shows that the topography-induced contribution still exists.
As stated earlier, the addition image of the TR mode and the addition image of
the contact mode enhance the topography-induced effect, which is observed in the
figure.
A closer look at the silicon ruler images at one pitch was taken, and the associ-
ated images are shown in Fig. 8.26b.The surface height profiles in the TR mode and
contact mode are somewhat different. The TR mode shows sharper edges than those
in the contact mode. The ratios of the change in amplitude at the steps to the change
in the mean amplitude in the TR mode and in the contact mode are a measure of to-
pography effects. The ratio in the contact mode (≈ 85%) is about seven times larger
than that of the TR mode (≈ 12%).
8 Nanotribology, Nanomechanics and Materials Characterization 351
8.3.5 Velocity Dependence on Micro/Nanoscale Friction
AFM/FFM experiments are generally conducted at relative velocities as high as
about 200µm/s. To simulate applications, it is of interest to conduct friction exper-
iments at higher velocities. Furthermore, high-velocity experiments (up to 1 m/s)
would be useful to study the dependence of friction and wear on velocity. One ap-
proach has been to mount samples on a shear-wave transducer (ultrasonic trans-
ducer) and then drive it at very high frequencies (in the MHz range) as reported
earlier, see Fig. 8.10 [31–35,82,83]. The coefficient of friction is estimated based
on the contact resonance frequency and requires the solution of the characteristic
equations for the tip vibrating in contact with the sample surface. The approach is
complex and depends on various assumptions.
An alternative approach is to utilize piezo stages with a large amplitude
(≈100µm) and a relatively low resonance frequency (a few kHz) and measure
the friction force directly using the FFM signal without any analysis, with the
assumptions used in the previous approaches using shear-wave transducers. The
commercial AFM set-up modified with this approach yields sliding velocities up
to 10mm/s [37]. In the modified set-up, the single-axis piezo stage is oriented such
that the scanning axis is perpendicular to the long axis of the AFM cantilever(which
correspondsto the 90
◦
scan-anglemode of thecommercialAFM; see Fig.8.27).The
displacement is monitored using an integrated capacitive feedback sensor, located
diametrically opposite to the piezo crystal, as shown in Fig. 8.27. The capacitive
change, corresponding to the stage displacement, gives a measure of the amount of
displacement and can be used as feedback to the piezo controller for better guid-
ing and tracking accuracy during scanning. The closed-loop position control of
the piezoelectric-driven stages using capacitive feedback sensors provides linear-
ity of motion better than 0.01% with nanometer resolution and a stable drift-free
motion [37].
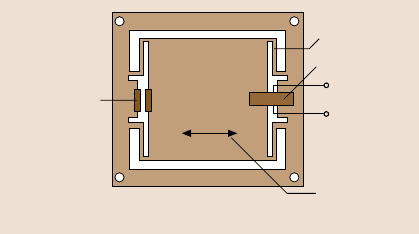
Integrated
capacitive
sensor (target
& probe)
Flexure
design
Piezo crystal
Stage motion
V
i/p
Constructional details of piezo stage
Fig. 8.27. Schematic of cross-sectional view showing construction details of the piezo stage.
The integrated capacitive sensors are used as feedback sensors to drive the piezo. The piezo
stage is mounted on the standard motorized AFM base and operated using independent am-
plifier and controller units driven by a frequency generator (not shown in the schematic) [37]
352 Bharat Bhushan
Friction force (nN)
Velocity (μm/s)
30
20
10
0
10
0
10
5
10
1
10
2
10
3
10
4
200
150
100
50
0
Adhesive force (nN)
Friction force (nN)
Velocity (μm/s)
30
20
10
0
10
0
10
5
10
1
10
2
10
3
10
4
200
150
100
50
0
Adhesive force (nN)
F ~ lnV
Asperity
deformation
dominates
F ~ f(V)
Tribo-
chemical
reaction
Meniscus
force dominates
Si (100) with native SiO
2
Atomic stick-slip
dominates
F ~ lnV
DLC (10 nm FCA)
Phase transformation
of DLC at the tip'
sample interface
Fig. 8.28. Effect of velocity
on friction force at a normal
load of 70 nN and adhesive
force over a wide range of
velocities between 1 µm/s
and 10 mm/s measured over
a25µm scan size on Si(100)
and DLC samples. The dom-
inant friction mechanisms
acting at different velocities
are marked on the figure [84]
Figure 8.28 shows the friction force and adhesive force dependence on sliding
velocity for single-crystal silicon, Si(100), and diamond-like carbon (DLC) with
10-nm thickness deposited using the filtered cathode arc (FCA) deposition tech-
nique [84–87]. The friction force and adhesive force are seen to vary with a change
in velocity and both materials exhibita reversal in friction behaviorat certaincritical
sliding velocities. These reversals correspond to definitive transitions between dif-
ferent dominant friction mechanisms. For Si(100), which is hydrophilic, meniscus
forces are dominant. The initial decrease in friction force with velocity corresponds
to diminishing meniscus contributions. Beyond a certain critical velocity the resi-
dence time of the tip is not sufficient to form meniscus bridges at the sliding inter-
face and the meniscus force contributionto the friction force drops out. At moderate
velocities, tribochemicalreactions at the tip–sample interface, in which a low-shear-
strength Si(OH)
4
layer is formed [42,88], also reduce friction. At high sliding ve-
locities, deformation of asperities resulting from the high-velocity impacts becomes
dominant and governs the friction behavior (see Fig. 8.29a). For DLC, being par-
tially hydrophobic, meniscus forces are not dominant. The increase in friction force
with velocity arises from atomic-scale stick–slip. Based on a thermally-activated
Eyring model incorporated by Bouhacina et al. [89], the potential barrier divided
by absolute temperature required for making jumps during stick–slip follows the
8 Nanotribology, Nanomechanics and Materials Characterization 353
Friction
force
Scan length
Low sliding
velocity
High sliding
velocity
Atomic scale
stick-slip
Meniscus force
contribution
Deformation
Impact wear
debris
Zone of plastic
deformation
Meniscus bridges
Individual
atoms
Dominant for hydrophilic and
partially hydrophobic surfaces
Atomic
stick-slip
Micro/nanoscale
stick-slip
Tribochemical
reactions
Plastic
deformations
Meniscus
bridges
Viscous
fluid film
shearing
Asperity
impacts
Localized melting/
phase transformations/
coating removal
Atomic stick-slip
contribution
Meniscus
contribution
Viscous
fluid film
shearing
contribution
Asperity
deformation
contribution
V
V
b
V
V
a
η
l
V
h
πN
0
•
z
a)
b)
Analytical expression for micro/nanoscale friction
Dominant friction mechanisms with increasing velocity
F = c ln
+ φ
adh
W – φ
m
R
t
ln
aτ
a
+ (l – a) kWV
7/3
+
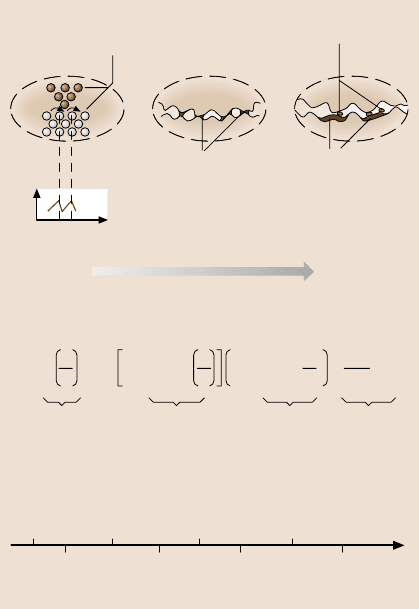
Fig. 8.29. (a) Schematic il-
lustrating various dominant
regimes of friction force at
different relative sliding ve-
locities from atomic scale
stick–slip at low velocities
to meniscus force contribu-
tion at mid velocities and
deformation-related energy
dissipation at high velocities,
and (b) comprehensive ana-
lytical expression for velocity
dependence of nanoscale
friction with the dominant
friction mechanisms [85]
logarithm of the velocity, and is responsible for the logarithmic dependence on ve-
locity shown by friction force. Further work by Gnecco et al. [90] showed that this
increase continues up to a certain sliding velocity and then levels off.Athighve-
locities, the large frictional-energy dissipation results in a phase transformation of
DLC to a graphite-like phase which is responsible for low friction.
For Si(100), the adhesive force is constant initially but then starts to increase
beyond a certain velocity. The increase in the adhesive force for Si(100) is believed
to be the result of a tribochemicalreaction. This layer gets replenishedcontinuously
during sliding and results in a higher adhesive force between the tip and sample
surface. For DLC, the adhesive force starts to increase beyond a critical velocity
and is believed to be the result of phase transformation of DLC to a graphitic phase
at the tip–sample interface [87,92,93].
For the development of a comprehensive friction model that encompasses vari-
ous friction mechanisms and accounts for the velocity dependence of each mecha-
nism, it is necessary to take into consideration the atomic-scale stick–slip, the adhe-
sive contributions arising from meniscus forces and the deformation of asperities at
the sliding interface resulting from high-velocity impacts [85]. Figure 8.29b gives