Bhushan B. Handbook of Micro/Nano Tribology, Second Edition
Подождите немного. Документ загружается.

© 1999 by CRC Press LLC
tip displacement in the lateral (x) direction. A U-shaped electromagnet was set to pull the tip assembly
to overcome the frictional force. (An amorphous iron alloy plate was attached to the spring to obtain an
effective pulling force.) Thus the friction force was measured by measuring the current that was required
to hold the tip stationary.
This design was modified later by Kaneko et al. (1991). The major modifications in the design are that
(1) the sample is no longer supported by a parallel-leaf spring unit and is directly mounted to a piezotube
scanner (which may give more stability while scanning the sample), and the tube scanner is used instead
of piezoelectric tripod to move the sample, (2) the friction force (tip motion) is sensed by the voltage
difference applied between two parallel electrodes rather than the current passing a coil around a magnet,
and (3) the tip is mounted on a single-leaf spring. Figure 1.29 shows the new FFM design presented by
Kaneko et al. (1991). The piezoelectric tripods have larger z-travel (on the order of 10 µm) than piezotube
scanners (couple of microns); however, tube scanners were used in their newer designs so that commercial
controllers designed for tube scanners could be used. This tube scanner had an outer diameter of 10 mm,
an inner diameter of 8 mm, and an effective length of 40 mm. For friction measurements, a diamond
tip was used which was ground to the shape of a three-sided pyramid, whose point was sharpened to a
radius of 0.1 mm with an apex of 90° (Figure 1.25). The tip was mounted on one end of a single-leaf
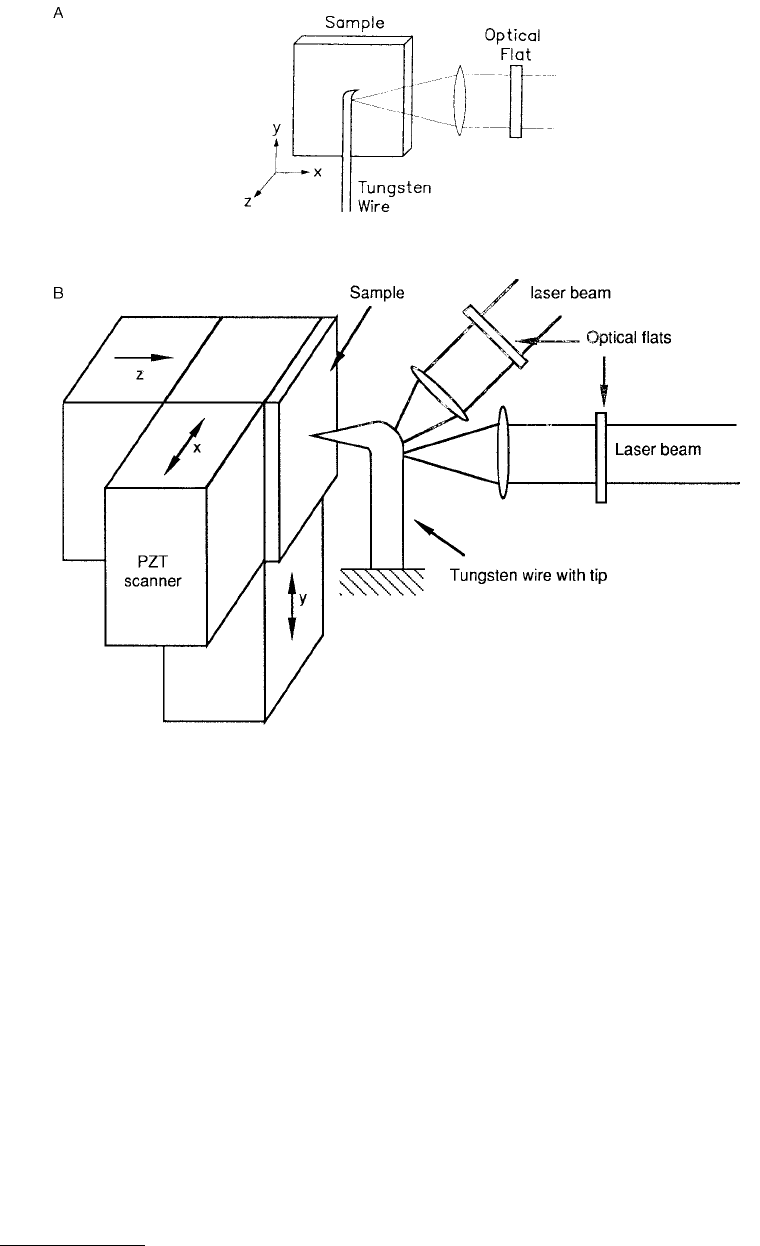
FIGURE 1.27 Schematics of the FFM designs (A) in which friction force is measured by measuring the cantilever
deflection in the lateral direction by optical interference (Mate et al., 1987) and (B) in which friction and normal
forces are measured by measuring the cantilever deflections in both lateral and normal directions.
© 1999 by CRC Press LLC
spring (length = 3 to 6.5 mm, width = 0.2 mm, thickness = 20 µm, and spring constant = 0.3 to 3 N/m).
The single-leaf spring was mounted perpendicular to a parallel-leaf spring unit (length = 5 to 10 mm,
width = 1 mm, thickness = 20 µm, and spring constant = 3 to 24 N/m). The tip-to-sample contact was
established by observing the parallel-leaf spring vibration resulting from the vibrating tip; when in
contact, there is an absence of parallel-leaf spring vibration. Applied normal force was obtained by the
tube scanner displacement and the stiffness of the single-leaf spring. The tip assembly shown in
Figure 1.29 consists of two flat electrodes (2 mm square) attached to the ends of the parallel-leaf spring
unit and an elastic member. The gap between the electrodes (typically 0.1 mm) is adjusted by a screw.
The attractive force between the electrodes is controlled by the control unit to move the parallel-leaf
spring to the zero-friction position. For friction measurement, the sample is scanned against the tip. The
friction force being applied at the tip deflects the parallel-leaf spring which is sensed by an optical head.
A control unit generates a voltage signal applied to the electrodes in order to move the associated leaf-
spring back to zero displacement by overcoming the friction force. Thus, friction force is measured by
measuring the required voltage difference between the electrodes.
1.3.3.3 Meyer and Amer’s and Fujisawa et al.’s Designs
Meyer and Amer (1990b) modified their AFM design to measure both surface topography and friction
forces simultaneously. In the case of surface topography, the bending of the cantilever was detected with
a segmented photodiode detector, typically a bicell. Additionally, lateral forces induce a torsion of the
cantilever which, in turn, causes the reflected laser beam to undergo a change in a direction perpendicular
to that due to surface topography. Thus, with a simple combination of two orthogonal bicells i.e., a
quadrant photodiode detector, one is able to measure, simultaneously yet independently, lateral forces
while imaging. Thus, the optical beam deflection method allows measurements of both orientation and
displacement of the cantilever beam. Marti et al. (1990) independently developed the same measurement
technique.
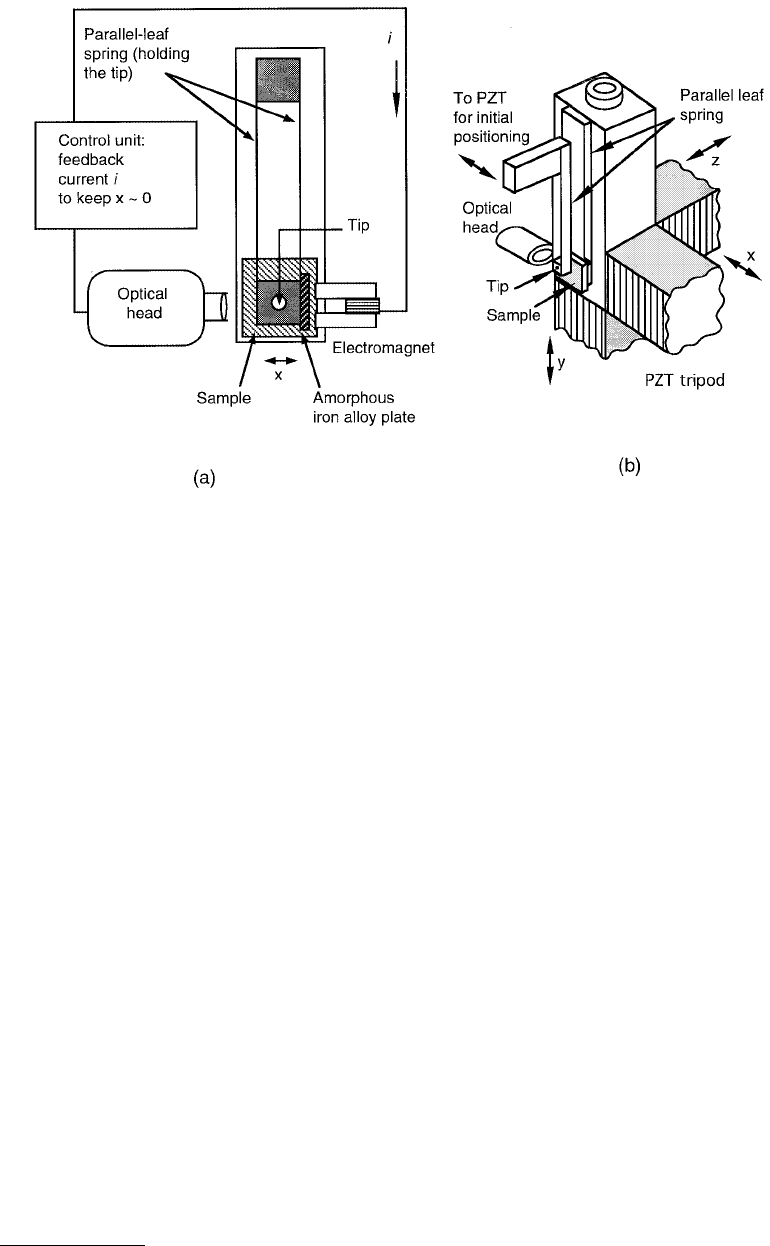
FIGURE 1.28 Schematics of an FFM. (a) The overall setup showing the tip assembly (sample support assembly
not shown) and the associated instrumentation and (b) parallel spring unit for supporting and loading the sample.
Normal force is measured by the deflection of the parallel spring unit in (b). Friction force is measured by measuring
the current that is required to hold the tip stationary; the tip displacement is sensed by the optical head. (From
Kaneko, R. (1988), J. Micros., 152(2), 363–369. With permission.)
© 1999 by CRC Press LLC
Fujisawa et al. (1994) used a combination of optical beam deflection and optical interferometry
methods to measure force components being applied at the tip in the three directions, Figure 1.30b. In
general, friction force has two components F
X
and F
Y
with tip sliding on a rough surface, Figure 1.30a.
One normal and one of the lateral components of the forces (F
X
and F
Y
) were measured using the AFM
signal. The lateral force (F
X
) was measured using the LFM signal. They used the optical interference
method to independently measure normal force component F
Z
. In this method, the distance between
the cleaved end of the optical fiber and the rear of the cantilever is measured, which uses the interference
between the light reflected at the end of the optical fiber and at the rear of the cantilever (Rugar et al.,
1989). With the measurements of AFM signal and optical interference signal, one can then obtain F
Y
and
F
Z
independently.
1.3.3.4 Marti et al.’s Design
Hipp et al. (1992) mounted both forces’ sensors and scanning unit on the microscope head, Figure 1.31a.
In this design, the sample is separated from the scanning piezo to accommodate any kind and size of
samples. This design is referred to as a stand-alone AFM/FFM. The optical beam deflection was used in
a collinear arrangement in order to detect normal and friction forces acting on the cantilever beam,
Figure 1.31b. The adjustment of the optics and the calibration of forces were performed with accessible
micrometer screws. The microscope includes an automatic coarse and fine approach facility. This machine
is commercially available from CSEM, Neuchâtel, Switzerland.
The three force measurement techniques described thus far have their advantages and disadvantages.
For example, the use of two laser beams in Mate et al.’s design adds an additional complexity in the
design of the apparatus; however, the friction and normal forces are measured independently. Kaneko
et al.’s design does not have the capability of measuring the surface topography and friction force
simultaneously. The topography and friction force of their samples were measured separately (Kaneko
et al., 1991). This is a significant drawback as any correlation between local variations in friction force
and the surface topography cannot be easily observed. In the Meyer and Amer and Marti et al. designs,
both friction and normal forces can be measured simultaneously by using a single laser beam. Their
technique is compact and cheaper to fabricate and is commercially used. Friction force can be measured
and calibrated relatively easily for all of these instruments.
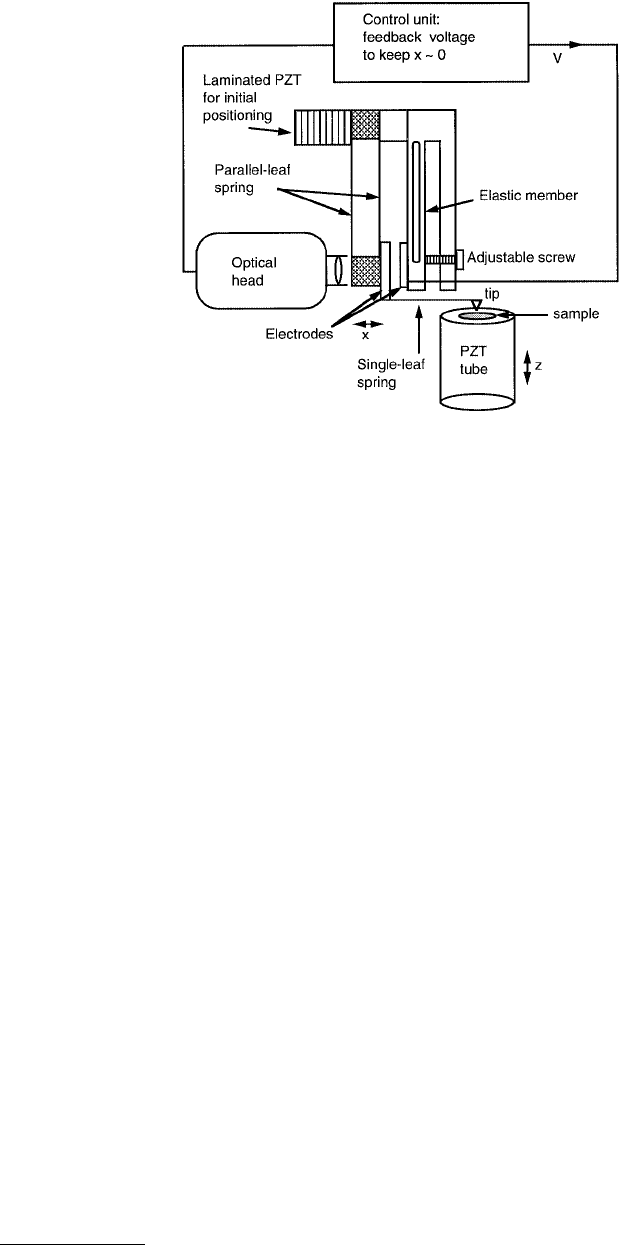
FIGURE 1.29 Schematic of an FFM in which the sample is mounted directly on the piezoscanner as opposed to
on a parallel spring unit and the tip is mounted on a single-leaf spring instead of on a parallel-leaf spring unit as
shown in Figure 1.28. (From Kaneko, R. et al. (1991), Adv. Inf. Storage Syst., 1, 267–277. With permission.)
© 1999 by CRC Press LLC
1.3.3.5 Commercial FFMs
Most commercial AFMs listed under the AFM section come with FFM capability. We now describe a
commercial FFM from Digital Instruments, Inc. (NanoScope III; Anonymous, 1992c; Bhushan and Ruan,
1994a; Ruan and Bhushan, 1994a–c). This instrument can provide simultaneous measurements of friction
force and surface topography. The schematic of this instrument is shown in Figure 1.17 and has been
described in detail previously. The original design of this AFM version comes from Meyer and Amer
(1988). The hardware modification of this instrument in order to measure friction force is also based on
the same authors’ suggestion (Meyer and Amer, 1990b). Bhushan (1995), Bhushan et al. (1994a–e,
1995a,b), and Ruan and Bhushan, (1994b,c) have used a 115-µm wide-legged triangular cantilever with
square pyramidal PECVD Si
3
N
4
tips (see Figure 1.23 and Table 1.2) for friction measurements. Square
pyramidal Si tips with a rectangular beam with 450-µm length, 40-µm width, and 2-µm thickness have
also been used for friction measurements.
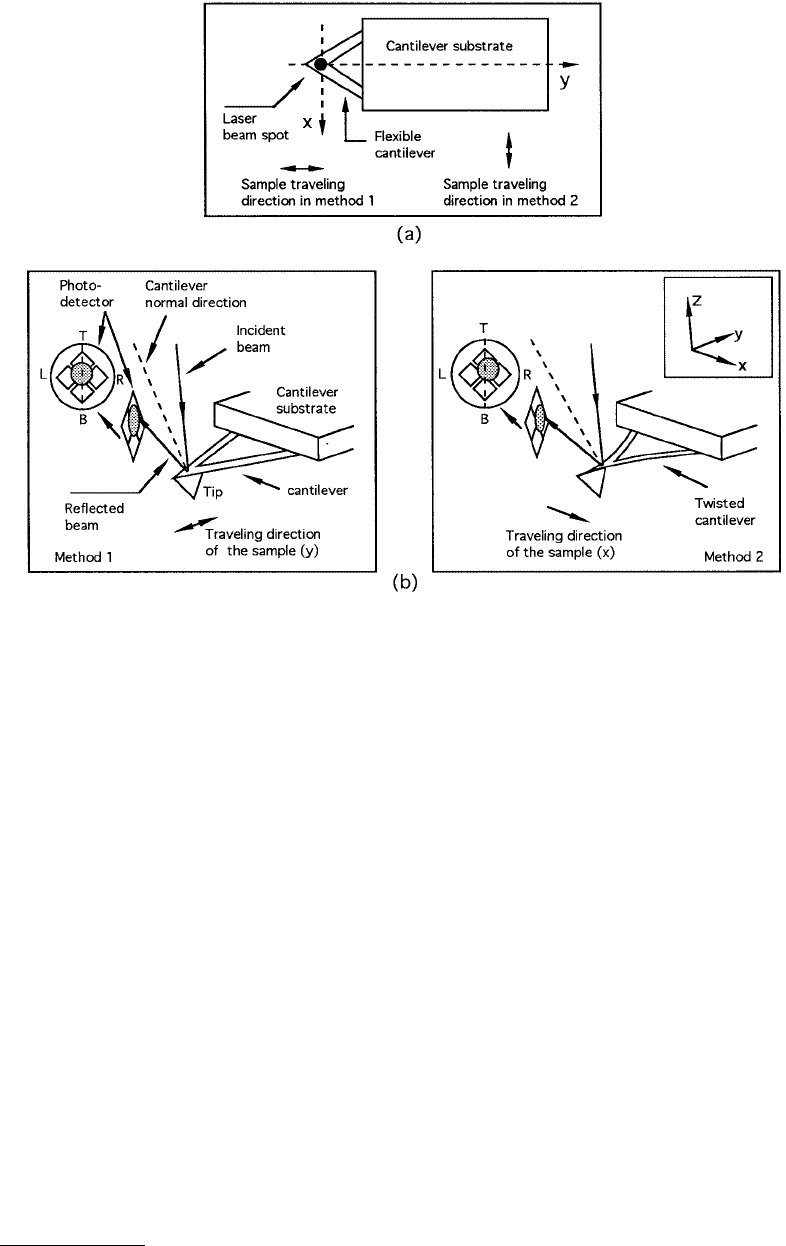
Friction force can also be measured in the height mode defined earlier in the AFM section (referred
to as method 1 in Figure1.32). In addition to T and B photodiodes present with AFM design (Figure 1.17),
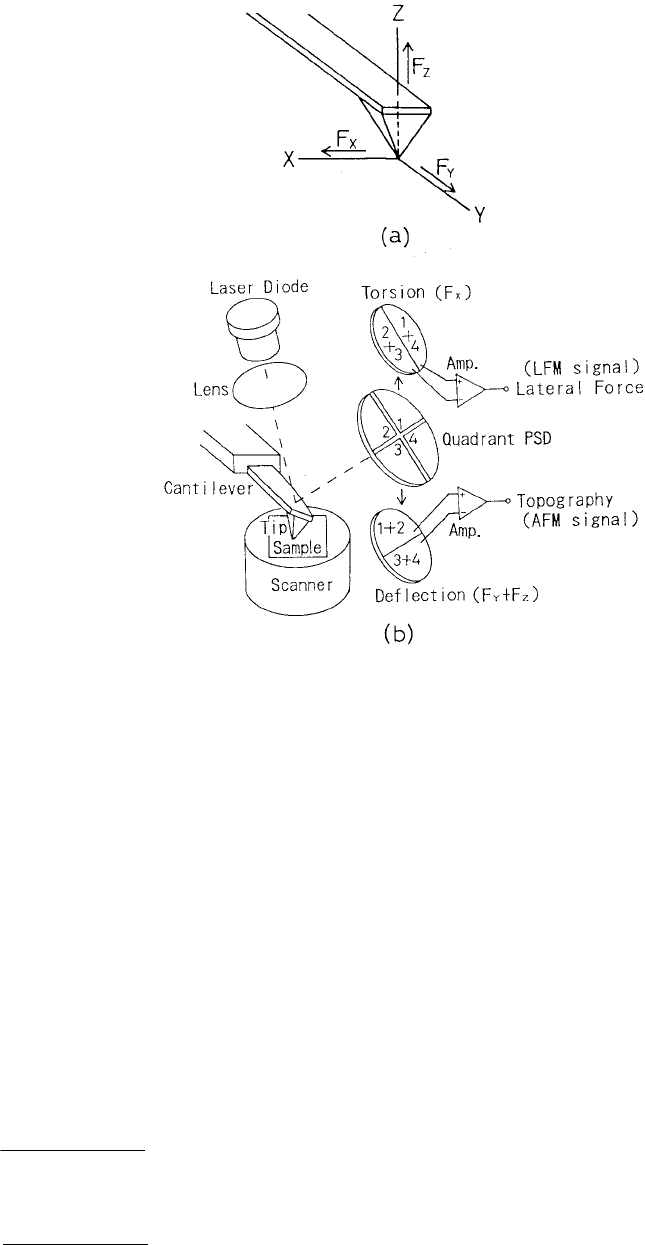
FIGURE 1.30 (a) Schematic representation of X, Y, and Z components of force (F
X
, F
Y
, and F
Z
) acting at the end of
the cantilever tip and (b) schematic of an FFM used to measure force components using optical beam deflection and
optical interferometry methods. (From Fujisawa, S. et al. (1994), Rev. Sci. Instrum., 65, 644–647. With permission.)*
* Color reproduction follows page 16.

© 1999 by CRC Press LLC
the other two photodiodes (“L” and “R”) are arranged horizontally. Their purpose is to measure the
“lateral” or “frictional” force exerted on the cantilever by the sample in the so-called aux mode (referred
to as method 2 in Figure 1.32). If the sample is scanned back and forth in the x-direction as shown in
Figure 1.32, friction force between the sample and the tip will produce a twisting of the cantilever in the
x-direction, schematically shown in Figure 1.32b (right). The laser beam will be reflected out of the plane
defined by the incident beam and the vertically reflected beam from an untwisted cantilever. This produces
an intensity difference of the laser beam received between the left and right (L and R) photodiodes. The
FIGURE 1.31 (a) Block schematic of the stand-alone AFM/FFM and (b) schematic of the collinear detection system.
(From Hipp, M. et al. (1992), Ultramicroscopy, 42–44, 1498–1503. With permission.)
© 1999 by CRC Press LLC
differential signal from the left and right photodiodes [(L – R)/(L + R)] provides the “FFM” signal which
reflects being applied at the tip–sample interface.
1.3.3.5.1 Friction Measurement Methods
Based on the work by Ruan and Bhushan (1994a), we now describe in more detail the two methods for
friction measurements. (Also see Meyer and Amer, 1990b.) We define a scanning angle to be the angle
relative to the y-axis in Figure 1.32a. This is also the long axis of the cantilever. A 0° scanning angle
corresponds to the sample scanning in the y-direction, and a 90° scanning angle corresponds to the
sample scanning perpendicular to this axis in the xy-plane (in x-axis). If the scanning angle is in both
y– and –y-directions, we call this “parallel scan.” Similarly, a “perpendicular scan” means the scanning
direction is in the x- and –x-directions. The sample traveling direction for each of these two methods is
illustrated in Figure 1.32b.
In method 1 (using the height mode with parallel scans) in addition to topographic imaging, it is also
possible to measure friction force when the scanning direction of the sample is parallel to the y-direction
(parallel scan). If there was no friction force between the tip and the moving sample, the topographic
feature would be the only factor which could cause the cantilever to be deflected vertically. However,
friction force does exist on all contact surfaces where one object is moving relative to another. The friction
force between the sample and the tip will also cause a cantilever deflection. We assume that the normal
force between the sample and the tip is W
0
when the sample is stationary (W
0
is typically in the range
of 10 to 200 nN), and the friction force between the sample and the tip is W
f
as the sample scans against
FIGURE 1.32 (a) Schematic defining the x- and y-directions relative to the cantilever and showing the sample
traveling direction in two different measurement methods discussed in the text. (b) Schematic of deformation of the
tip and cantilever shown as a result of sliding in the x- and y-directions. A twist is introduced to the cantilever if the
scanning is in the x-direction (right). (From Ruan, J. and Bhushan, B. (1994), ASME J. Tribol., 116, 378–388. With
permission.)
© 1999 by CRC Press LLC
the tip. The direction of friction force (W
f
) is reversed as the scanning direction of the sample is reversed
from positive (y) to negative (–y) directions (
→
W
f (y)
=–
→
W
f (–y)
).
When the vertical cantilever deflection is set at a constant level, it is the total force (normal force
and friction force) applied to the cantilever that keeps the cantilever deflection at this level. Because the
friction force is in opposite directions as the traveling direction of the sample is reversed, the normal
force will have to be adjusted accordingly when the sample reverses its traveling direction, so that the
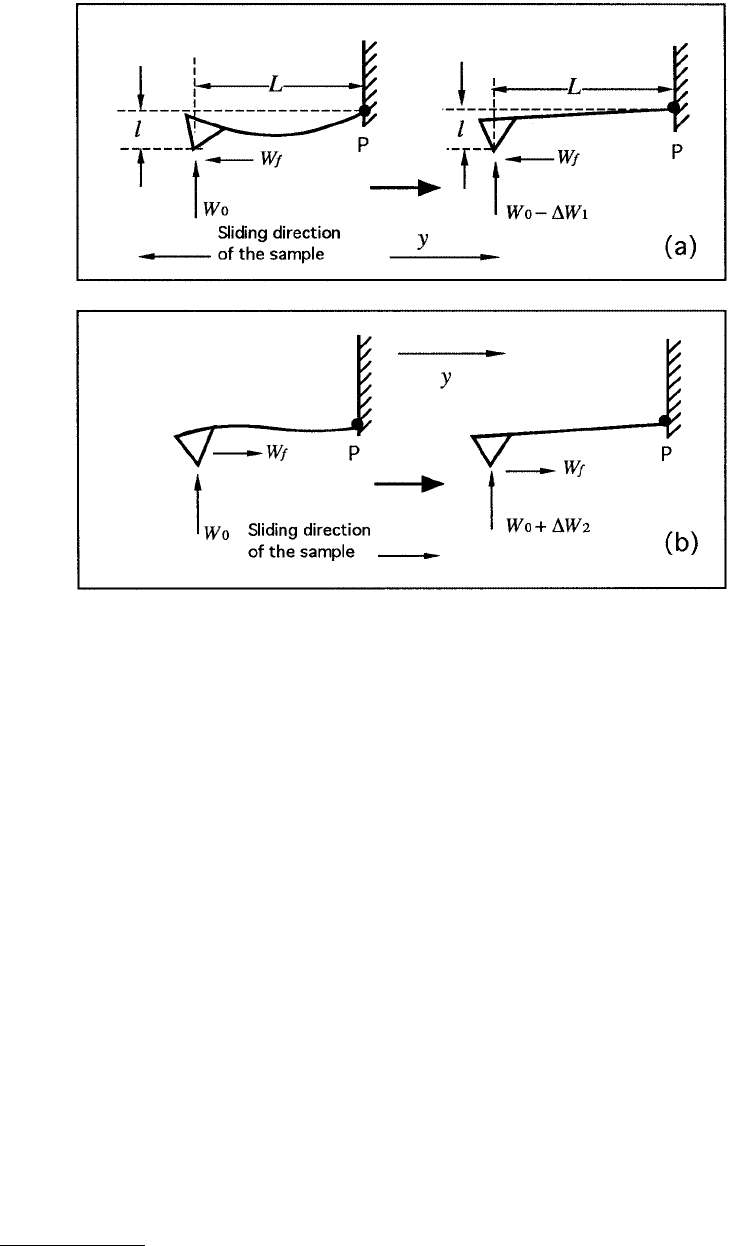
total deflection of the cantilever will remain the same. We can calculate the difference of the normal force
between the two traveling directions for a given friction force W
f
. First, by means of a constant
deflection, the total moment applied to the cantilever is constant. If we take the reference
point to be the point where the cantilever joins the cantilever holder (substrate), point P in
Figure 1.33, we have the following relationship:
(1.1)
or
(1.2)
FIGURE 1.33 Schematic showing an additional bending of the cantilever due to friction force when the sample is
scanned in the y- or –y-direction (left). This effect will be canceled by adjusting the piezo height by a feedback circuit
(right). (From Ruan, J. and Bhushan, B. (1994), ASME J. Tribol., 116, 378–388. With permission.)
WWLWlWWLWl
ff01 02
−
()
+=+
()
−∆∆,
∆∆WWLWl
f12
2+
()
= .
© 1999 by CRC Press LLC
Thus,
(1.3)
where ∆W
1
and ∆W
2
are the absolute value of the changes of normal force when the sample is traveling
in –y and y-directions, respectively, as shown in Figure 1.33; L is the length of the cantilever; and l is
vertical distance between the end of the tip and point P. The coefficient of friction (µ) between the tip
and the sample is then given as
(1.4)
In all circumstances, there are adhesive and interatomic attractive forces between the cantilever tip
and the sample. The adhesive force can be due to water from the capillary condensation and other
contaminants present at the surface which form meniscus bridges (Mate et al., 1989; Blackman et al.,
1990; O’Shea et al., 1992) and the interatomic attractive force includes van der Waals attraction (Burnham
et al., 1991). If these forces (and indentation effect as well, which is usually small for rigid samples) can
be neglected, the normal force W
0
is then equal to the initial cantilever deflection H
0
multiplied by the
spring constant of the cantilever. (∆W
1
+ ∆W
2
) can be measured by multiplying the same spring constant
by the height difference of the piezotube between the two traveling directions (y- and –y-directions) of
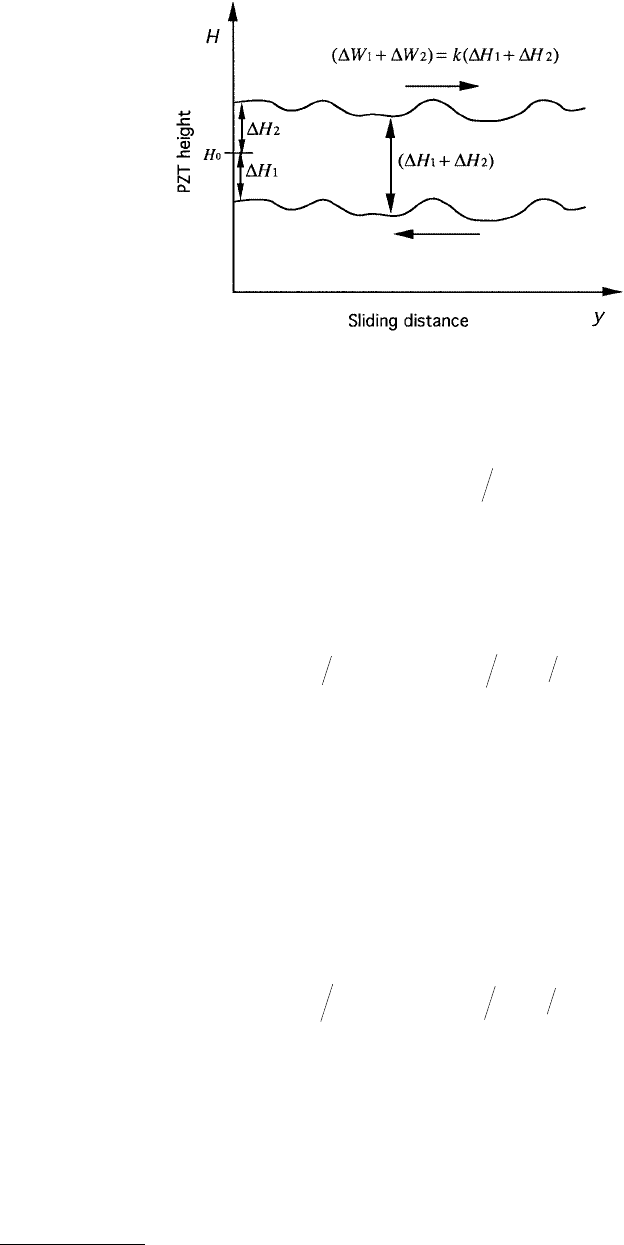
the sample. This height difference is denoted as (∆H
1
+ ∆H
2
), shown schematically in Figure 1.34. Thus,
Equation 1.4 can be rewritten as
(1.5)
Because the piezotube vertical position is affected by the surface topographic profile of the sample in
addition to the friction force being applied at the tip, this difference has to be taken point by point at
the same location on the sample surface, as shown in Figure 1.34. Subtraction of point-by-point mea-
surements may introduce errors, particularly for rough samples. We will come back to this point later.
In addition, precise measurement of L and l (which should include the cantilever angle) are also required.
FIGURE 1.34 Schematic illustration of the height difference of the piezotube scanner as the sample is scanned in
the y- and –y-directions. (From Ruan, J. and Bhushan, B. (1994), ASME J. Tribol., 116, 378–388. With permission.)
WWWLl
f
=+
()()
∆∆
12
2,
µ= = +
()
[]
()
WW W W W Ll
f 0120
2∆∆ .
µ= = +
()
[]
()
WW H H H Ll
f 0120
2∆∆ .

© 1999 by CRC Press LLC
If the adhesive forces between the tip and the sample are large enough that they cannot be neglected,
one should include them in the calculation. However, there could be a large uncertainty in determining
this force, and thus an uncertainty in using Equation 1.5. An alternative approach is to make the mea-
surements at different normal loads and to use ∆(H
0
) and ∆(∆H
1
+ ∆H
2
) from the measurements in
Equation 1.5. Another comment on Equation 1.5 is that, since only the ratio between (∆H
1
+ ∆H
2
) and
H
0
comes into this equation, the piezotube vertical position H
0
and its position difference (∆H
1
+ ∆H
2
)
can be in volts as long as the vertical traveling distance of the piezotube and the voltage applied to it
have a linear relationship. However, if there is a large nonlinearity between the piezotube traveling distance
and the applied voltage, this nonlinearity must be included in the calculation.
It should also be pointed out that Equations 1.4 and 1.5 are derived under the assumption that the
friction force W
f
is the same for the two scanning directions of the sample. This is an approximation since
the normal force is slightly different for the two scans and there may also be a directionality effect in
friction. However, this difference is much smaller than W
0
itself. We can ignore the second order correction.
Method 2 (aux mode with perpendicular scan) to measure friction was suggested by Meyer and Amer
(1990b). The sample is scanned perpendicular to the long axis of the cantilever beam (i.e., to scan along
the x- or –x-direction in Figure 1.32a) and the output of the horizontal two quadrants of the photodiode
detector is measured. In this arrangement, as the sample moves under the tip, the friction force will cause
the cantilever to twist. Therefore the light intensity between the left and right (L and R in Figure 1.32b,
right) detectors will be different. The differential signal between the left and right detectors is denoted
as FFM signal [(L – R)/(L + R)]. This signal can be related to the degree of twisting, hence to the
magnitude of friction force. Again, because of a possible error in determining normal force due to the
presence of an adhesive force at the tip–sample interface, the slope of the friction data (FFM signal vs.
normal load) needs to be taken for an accurate value of coefficient of friction.
While friction force contributes to the FFM signal, friction force may not be the only contributing
factor in commercial FFM instruments (for example, Nanoscope III). One can notice this fact by simply
engaging the cantilever tip with the sample. Before engaging, the left and right detectors can be balanced
by adjusting the position of the detectors so that the intensity difference between these two detectors is
zero (FFM signal is zero). Once the tip is engaged with the sample, this signal is no longer zero even if
the sample is not moving in the xy-plane with no friction force applied. This would be a detrimental
effect. It has to be understood and eliminated from the data acquisition before any quantitative mea-
surement of friction force becomes possible.
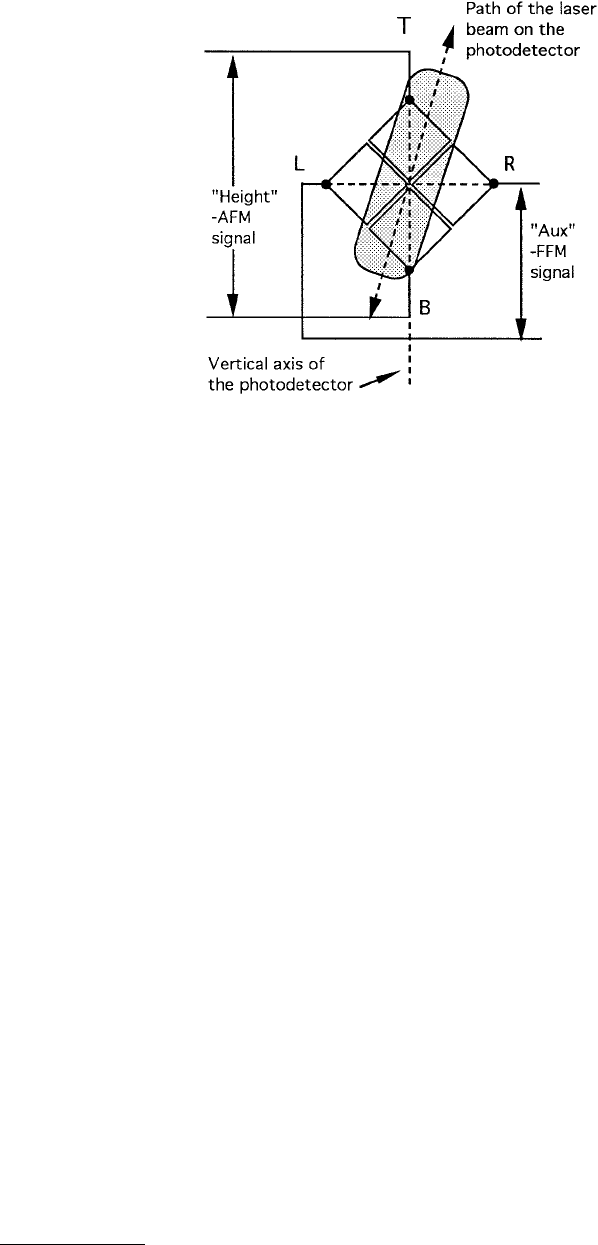
One of the fundamental reasons for this observation is the following. The detectors may not have been
properly aligned with respect to the laser beam. To be precise, the vertical axis of the detector assembly
(the line joining T–B in Figure 1.35) is not in the plane defined by the incident laser beam and the beam
reflected from an untwisted cantilever (we call this plane the “beam plane”). When the cantilever vertical
deflection changes due to a change of applied normal force (without having the sample scanned in the
xy-plane), the laser beam will be reflected up and down and form a projected trajectory on the detector.
(Note that this trajectory is in the defined beam plane.) If this trajectory is not coincident with the vertical
axis of the detector, the laser beam will not evenly bisect the left and right quadrants of the detectors,
even under the condition of no torsional motion of the cantilever, see Figure 1.35. Thus, when the laser
beam is reflected up and down due to a change of the normal force, the intensity difference between the
left and right detectors will also change. In other words, the FFM signal will change as the normal force
applied to the tip is changed, even if the tip is not experiencing any friction force. This (FFM) signal is
unrelated to friction force or to the actual twisting of the cantilever. We will call this part of the FFM
signal FFM
F
, and the part which is truly related to friction force, FFM
T
.
The FFM
F
signal can be eliminated. One way of doing this is as follows. First, the sample is scanned
in both the x- and –x-directions and the FFM signal for scans in each direction is recorded. Because
friction force reverses its directions when the scanning direction is reversed from x- to –x-direction, the
FFM
T
signal will have opposite signs as the scanning direction of the sample is reversed (FFM
T
(x) =
–FFM
T
(–x)). Hence, the FFM
T
signal will be canceled out if we take the sum of the FFM signals for the
two scans. The average value of the two scans will be related to FFM
F
due to the misalignment,
© 1999 by CRC Press LLC
(1.6)
This value can therefore be subtracted from the original FFM signals of each of these two scans to obtain
the true FFM signal (FFM
T
), or, alternatively, by taking the difference of the two FFM signals, one directly
gets the FFM
T
value
(1.7)
Ruan and Bhushan (1994a) have been shown that error signal (FFM
F
) can be very large compared to
friction signal FFM
T
; thus correction is required.
Now we compare the two methods. The method of using height mode and parallel scan (method 1)
is very simple to use. Technically, this method can provide three-dimensional friction profiles and the
corresponding topographic profiles; however, there are some problems with this method. Under most
circumstances, the piezoscanner displays a hysteresis when the traveling direction of the sample is
reversed. Therefore, the measured surface topographic profiles will be shifted relative to each other along
the y-axis for the two opposite (y and –y) scans. This would make it difficult to measure the local height
difference of the piezotube for the two scans. However, the average height difference between the two
scans and hence the average friction can still be measured. The measurement of average friction can serve
as an internal means of friction force calibration. Method 2 is a more desirable approach. The subtraction
of FFM
F
signal from FFM for the two scans does not introduce error to local friction force data. An ideal
approach in using this method would be to add the average value of the two profiles in order to get the
error component (FFM
F
) and then subtract this component from either profiles to get true friction
profiles in either direction. By making measurements at various loads, we can get the average value of
FIGURE 1.35 The trajectory of the laser beam on the photodetectors in the cantilever is vertically deflected (with
no torsional motion) for a misaligned photodetector with respect to the laser beam. For a change of normal force
(vertical deflection of the cantilever), the laser beam is projected at a different position on the detector. Due to a
misalignment, the projected trajectory of the laser beam on the detector is not parallel with the detector vertical axis
(the line joint T–B). (From Ruan, J. and Bhushan, B. (1994), ASME J. Tribol., 116, 378–388. With permission.)
FFM FFM 2FFM
F
xx
()
+−
()
=
FFM FFM FFM FFM
2FFM
TT
T
xxx x
x
()
−−
()
=
()
−−
()
=
()