Becker W. Advanced Time-Correlated Single Photon Counting Techniques
Подождите немного. Документ загружается.

74 5 Application of Modern TCSPC Techniques
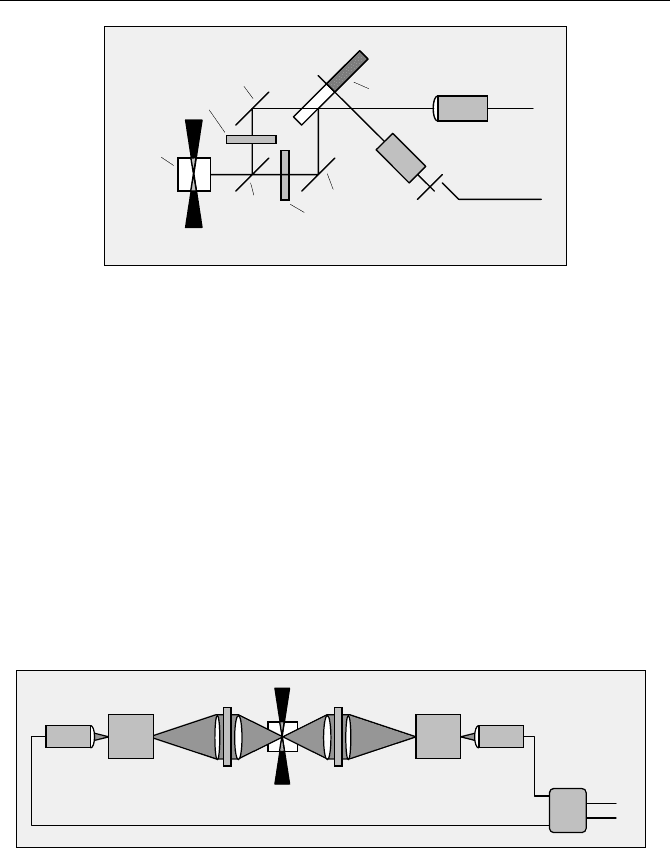
In the setup shown in Fig. 5.11, right, fluorescence from the lens and the di-
chroic mirror can cause problems. Moreover, excitation light scattered at the di-
chroic mirror and reflected at the lens can cause false prepulses when the IRF has
to be recorded. These problems can be largely avoided by using a small laser
beam diameter, a small mirror instead of the dichroic beamsplitter, and a hole in
the centre of Lens 1.
The high optical efficiency of the systems shown in Fig. 5.11 has the negative
effect that the detector can easily be damaged by overload. The detector can be
destroyed by a simple operator error, e.g. opening the sample compartment while
the detector is switched on or turning the excitation power too high. Therefore,
safety features must be implemented in any practical fluorescence lifetime system.
These may include mechanically operated flaps, switches, or overload shutdown
circuits for the operating voltage of the detector (see Sect. 7.3, page 302).
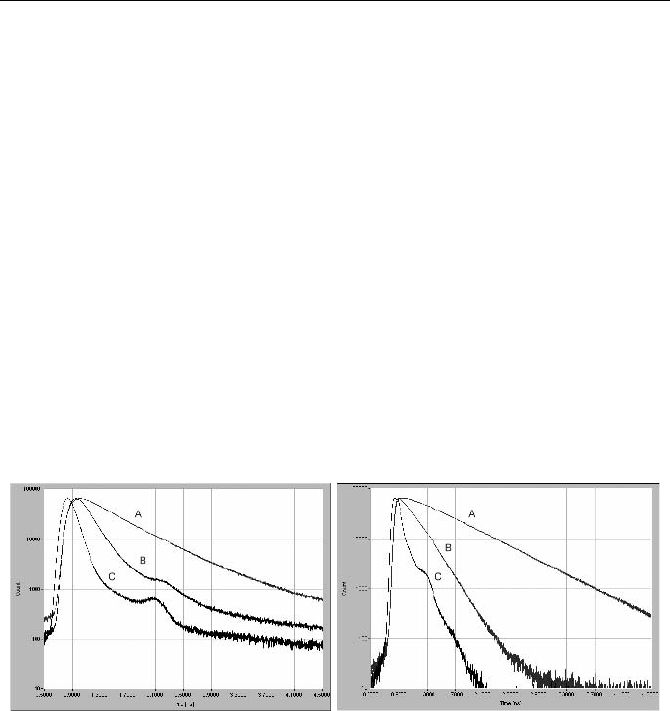
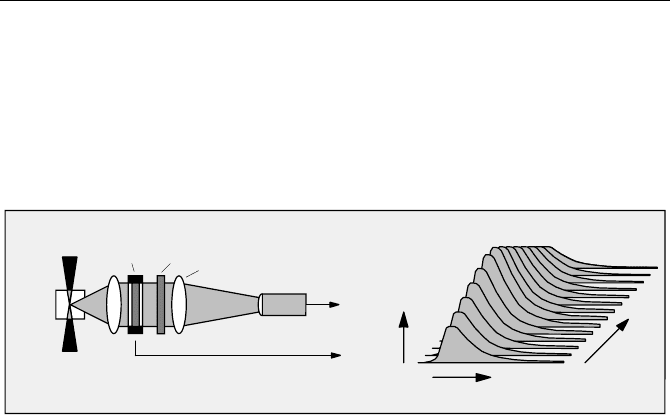
Typical results obtained in a filter-based setup with diode-laser excitation are
shown in Fig. 5.12. The sample was an indocyanine green solution in ethanol in a
1 cm cuvette. The sample was excited by a diode laser of 650 nm emission wave-
length, about 50 ps pulse width, and 50 MHz repetition rate. The IRF and the
fluorescence recorded at 830 nm are shown for an H577320 PMT module (left)
and for an R3809U MCP-PMT (right).
Fig. 5.12 Fluorescence decay curves of indocyanine green (ICG). A in ethanol, B in water,
C instrument response function. Time scale 400 ps / div, 1-cm cuvette, diode laser 650 nm,
50 MHz. Left: Detected by a cooled H577320 photosensor module. Right: Detected by an
R3809U MCP PMT
The results shown in Fig. 5.12 demonstrate two typical instrumental effects.
The most obvious one is that the background of the H577320 detector is much
higher than that of the R3809U MCP. Because the H578320 was used with a
thermoelectric cooler the dark count rate was negligible and can be excluded as a
source of the background. Instead, the background is caused by afterpulsing of the
H577320, see Sect. 7.2.11, page 294.
The IRF width is 208 ps for the H577320 and 130 ps for the R3809U. Al-
though the IRF is shorter for the R3809U it is not as short as one might expect.
For a laser pulse width of 50 ps and a TTS of 30 ps of the R3809U the IRF width
should actually be around 60 ps. The long IRF is typical for measurements from
the whole diameter and the whole depth of a 1 cm cuvette. The transit times of the
5.1 Classic Fluorescence Lifetime Experiments 75
excitation pulse and of the fluorescence signal add to the IRF width and cause a
substantial increase in the IRF width, see also paragraph below.
5.1.6 Measurement of the Instrument Response Function
An accurate fluorescence lifetime measurement normally requires measurements
of the fluorescence and the instrument response function (IRF). The lifetime or the
lifetime components of the decay function are then obtained by deconvolution of
the fluorescence curve from the IRF [389].
The IRF is measured on a reference object that directs a small fraction of the
excitation light into the detection path. Although the IRF measurement may look
simple at first glance, it is the most critical point in high-resolution lifetime ex-
periments. The fluorescence signal and the IRF are recorded at different wave-
lengths, with potentially different pulse dispersion or transit time in the optical
system. The light may be detected from different locations in the sample, with a
corresponding shift in the signals. The effective shape of the excitation profile
may depend on scattering effects in the sample and in the reference object.
One frequently used approach is to tolerate some shift of the IRF and to add the
shift as an additional fitting parameter in the deconvolution. This is acceptable for
fluorescence lifetimes much longer than the IRF width. In this case the shift and
the lifetime are independent fitting parameters. Consequently, the shift is obtained
from the fitting procedure without impairing the accuracy of the lifetime. How-
ever, if the lifetime is much shorter than the IRF a change in the shift and a change
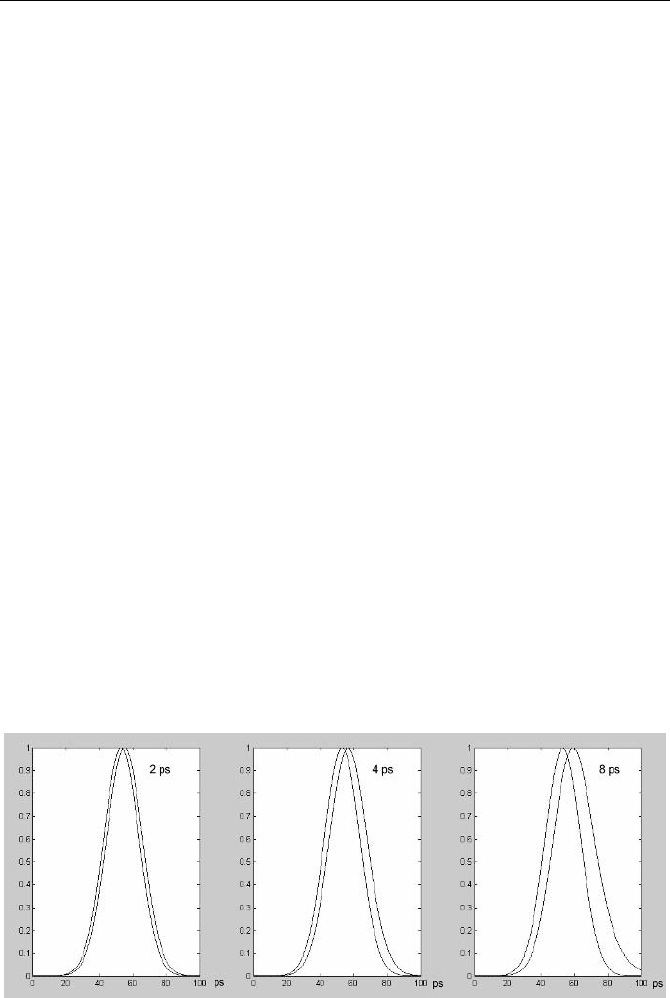
in the lifetime have almost the same effect on the shape of the fitted curve. Fig-
ure 5.13 shows the effect for calculated curves. A gaussian function of 25 ps
FWHM was convoluted with single-exponential decay functions with lifetimes of
2 ps, 4 ps and 8 ps. It is clearly seen that for short lifetimes, the result of the con-
volution becomes almost indistinguishable from a shift of the curve. This makes it
difficult to obtain both the shift and the lifetime from the fitting procedure.
Fig. 5.13 Single-exponential decay functions convoluted with a gaussian IRF of 25 ps
width. Left to right: Lifetime 2 ps, 4 ps and 8 ps. The result of a convolution with a decay
function of short lifetime is very close to a shift

76 5 Application of Modern TCSPC Techniques
It is possible to use a known fluorescence decay instead of the IRF as a refer-
ence for data analysis. By selecting the right reference fluorophore the reference
measurement can be made at the same wavelength as the lifetime measurement.
This method is often used to calibrate „phase zero“ in modulation technique
measurements. A number of lifetime standards are given in [308]. However, fluo-
rescence decay times depend on ion concentrations, oxygen saturation, and tem-
perature. They are therefore not very useful as lifetime standards. The influence of
variations in the reference lifetime becomes negligible if the reference lifetime is
much shorter than the IRF width. Unfortunately, extremely short lifetimes are
obtained only from fluorophores of low quantum efficiency. The slightest con-
tamination by a highly fluorescent dye causes large errors.
The attempt is often made to use Raman lines to convert the excitation wave-
length into a wavelength in the spectral region of the fluorescence. However, the
problem is the same as for short lifetime fluorescence – the Raman effect is so
weak that the slightest background fluorescence makes the result useless.
The best way to obtain a reasonable IRF measurement is still to use scattering.
A cuvette – or a reference object with a similar geometry as the sample – is placed
in the sample position and measured at the laser wavelength. Scattering gives
similar illumination patterns in the optics as fluorescence. The scattering coeffi-
cient must be low enough to avoid pulse stretching by photon migration effects
and high enough to exclude possible background fluorescence. Scattering solu-
tions can be obtained by diluting milk or unstained latex in water. The cuvette
should appear almost clear, but the laser beam should form a clearly visible trace
through the cuvette. Scattering solutions and IRFs recorded by a 650 nm diode
laser and an R3809U MCP PMT in a 10-mm cuvette are shown in Fig. 5.14.
Fig. 5.14 Left: Scattering solutions of different scattering intensity. Right: IRFs recorded
with the solutions. 10 mm cuvette, 90° illumination, light detected from full width of cu-
vette, 650 nm diode laser, R3809U MCP PMT, SPC730 TCSPC module, time scale
50 ps/div
It should be noted that the IRF recorded in the cuvette is not identical with the
laser pulse recorded directly. The horizontal path length of the laser in a 10-mm
cuvette adds about 45 ps of transit-time spread to the IRF. If a large beam diame-
ter is used, there are also path length differences for different depth in the cuvette.
Moreover, reflection at the cuvette walls and scattering at the sample holder con-
tributes to the IRF. However, these effects are essentially the same for IRF meas-
urement by a dilute scattering solution and fluorescence measurement of a trans-
5.1 Classic Fluorescence Lifetime Experiments 77
parent sample of low absorption. The recorded IRF can therefore be considered
the correct one.
For nontransparent samples measured by front illumination, the effective IRF
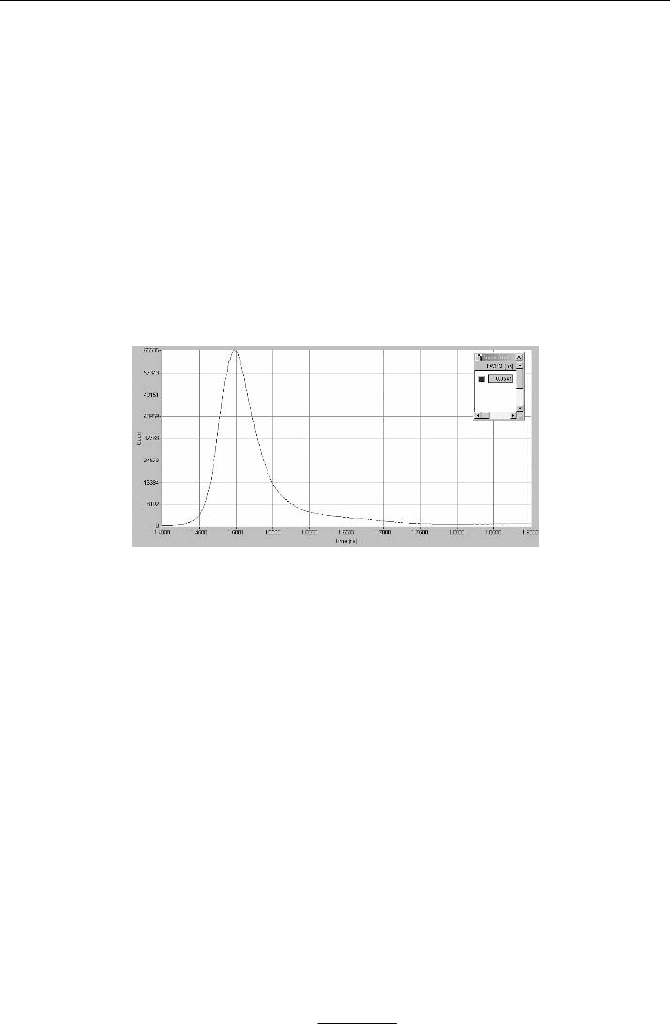
can be recorded by using scattering at a rough surface. To avoid multiple scatter-
ing the reference body should have high absorption and no fluorescence. Figu-
re 5.15 shows an IRF recorded for a piece of black velvet, recorded in the same
system as Fig. 5.14, right. The width of this IRF is substantially shorter than the
IRF measured in the cuvette. The FWHM is 54 ps, compared to 97 to 103 ps ob-
tained in the cuvette.
The results show that the full resolution of a fast TCSPC system cannot be ex-
ploited for measurements in the commonly used 10 mm cuvettes. The optical
transit-time spread can be reduced by recording only from a small spot in the cu-
vette. Another solution is a thin cuvette under front illumination.
Fig. 5.15 IRF recorded for a piece of black velvet. Same optical and electronic system as in
Fig. 5.14, time scale 50 ps/div
In special cases it can be useful or even required to excite the fluorescence by
two-photon absorption [132, 319, 493, 494, 521]. The excitation wavelength may
then be entirely outside the spectral sensitivity range of the detector. Moreover,
the pulse profile obtained by detecting the laser pulse directly may not correspond
to the effective temporal two-photon excitation profile of the sample. A useful
way to obtain an IRF in a two-photon system has turned out to be second har-
monic generation from a suspension of gold particles [206, 375].
5.1.7 What is the Shortest Lifetime that can be Measured?
It is frequently asked what is the shortest lifetime that can be measured with a
given TCSPC system. A simple estimation can be made by using the first mo-
ments of the photon distributions measured for the IRF and the fluorescence. The
first moment, M
1
, or the „centroid“ of the function f(t) is defined as
³
³
dttf
dttft
M
)(
)(
1
(5.2)

78 5 Application of Modern TCSPC Techniques
For discrete time channels containing discrete numbers of photons M
1
is
N
tN
M
ii
¦
1
(5.3)
with t
i
= time of time channel i and N
i
= number of photons in time channel i.
M
1
can also be interpreted as the average arrival time of all photons within a
TCSPC measurement. If two functions are convoluted, the first moments of both
functions add linearly. From the measurement of a fluorescence decay and the
corresponding IRF measurement can be derived the fluorescence lifetime,
W
, by
IRFfluor
MM
11
W
(5.4)
with M
1fluor
= first moment of the fluorescence recording and M1
IRF
= first mo-
ment of the IRF recording.
In the early days of TCSPC the moment or „centroid shift“ method was used to
calculate fluorescence and excited nuclear state lifetimes from measurement data
[348, 549]. For fluorescence lifetime measurements this method has now entirely
been replaced with curve fitting procedures. However, the first-moment technique
has recently been revived for use in functional brain imaging [325]. A benefit of
the first-moment technique is that the statistical accuracy of
W
calculated via the
first moments can be easily estimated. Let the standard deviation of the photon
arrival times in the IRF recording be
IRF
V
. The standard deviation of the first
moment,
1M
V
, of the IRF is then
N
IRFM
/
1
VV
(5.5)
For fluorescence lifetimes much shorter than the IRF width, the shapes of the
recorded IRF and the recorded fluorescence curve are almost identical. Provided
the same number of photons, N, is recorded both in the IRF and the fluorescence
curve, the standard deviation,
W
V
, of the calculated fluorescence lifetime,
W
, is:
N
IRF
/2
VV
W
(5.6)
With a femtosecond laser and an MCP PMT
V
irf
is about 10 ps. For a total number
of recorded photons of N = 10
6
both in the IRF and the fluorescence, which is
certainly a conservative assumption, the standard deviation of a short lifetime is
14 fs. This value is surprisingly low.
In practice the lifetime accuracy is limited by the timing stability of the TCSPC
system. The stability that can be expected from a TCSPC system is demonstrated
in Fig. 7.36 and Fig. 7.37, page 298. The test system was an SPC140 module
with a BHL600, 650 nm, 40 ps diode laser. After a 30-minute warmup, a series
of 16 consecutive recordings was performed over 16 minutes. The drift of the first
moment of the IRF recordings was within r 0.7 ps (peak-peak) for the H5773, and
r 1.5 ps (peak-peak) for the R3809U. A time difference of 1 ps corresponded to a
path length difference of 300 µm. It is unlikely that a path length difference this
low can be achieved between the fluorescence and the IRF recording in a system
containing a monochromator. The prospects are best with a setup as shown in
Fig. 5.11 and a very thin sample cuvette or a confocal system detecting only from
a thin layer within the sample.

5.1 Classic Fluorescence Lifetime Experiments 79
5.1.8 Fluorescence Anisotropy
If the fluorescence of a sample is excited by linearly polarised light the fluores-
cence is partially polarised (see Fig. 5.7 and Fig. 5.8). The fluorescence anisot-
ropy, r, is defined as
)(
)()(
)(
tI
t
I
t
I
tr
sp
(5.7)
with I
p
= fluorescence intensity parallel to excitation, I
s
= fluorescence intensity
perpendicular to excitation, I = total intensity.
The fluorescence anisotropy decays with the rotational relaxation time,
W
rot
. The
relaxation time is an indicator of the size of the dissolved molecules, dye-solvent
interactions, aggregation states, and the binding state to proteins [102, 308, 549].
Typical rotational relaxation times of free fluorophores in water are in the range
from 50 to 500 ps.
Time-resolved measurements of anisotropy are difficult because I
p
(t) - I
s
(t) is
small compared to the fluorescence components I
p
(t) and I
s
(t) themselves.
I
p
(t) and I
s
(t) are detected with different efficiency, especially if a monochromator
is used. The effect depends on the angle of the grating, i.e. on the wavelength, and
on the slit width and the beam geometry. Anisotropy measurements therefore
require calibration of the efficiency of the I
p
(t) and I
s
(t) detection channels. The
relative efficiency, E
p
/E
s
, of the I
p
and I
s
detection channels is the „G factor“:
s
p
E
E
G
(5.8)
There are two ways to determine the G factor [308, 389]. The first one is to run
a measurement with horizontal polarisation of the excitation beam. For an angle of
90° between the optical axis of excitation and emission, the excited-state distribu-
tion is oriented towards the axis of observation. Consequently both channels
measure equal perpendicular components. The ratio of the measured intensities
represents the G factor.
The second way to obtain G is „tail matching“. A sample with a depolarisation
time substantially shorter than the fluorescence lifetime is measured. The G factor
is obtained from the intensities in the later parts of the decay curves. The advan-
tage of tail matching is that it can be used also for optical systems with excitation
and detection along the same optical axis.
To separate the rotational relaxation from the fluorescence decay it is essential
that the correct total intensity, I(t) is taken for the denominator of r(t). It is nor-
mally assumed that both the excitation and emission light cones have negligible
numerical aperture, and that the excitation is polarised perpendicularly to the plane
defined by both optical axes, see Fig. 5.8.
The total intensity is then I(t) = I
P
(t) + 2 I
S
(t). The factor of 2 results from the
geometrical fact that light polarised longitudinally to the optical axis of observa-
tion is not detected [308, 549]. The situation for a microscope lens of high NA is
different. Both focusing and detection under high NA results in the conversion of
transversal E vectors into longitudinal ones, and vice versa [18, 426, 465, 466,
551], see Fig. 5.9. The total intensity is therefore I (t) = I
P
(t) + k I
S
(t), with k < 2.
80 5 Application of Modern TCSPC Techniques
The recorded intensities may also be changed by possible counting loss in the
TCSPC module. If I
p
and I
s
are measured consecutively, a count rate of a few per-
cent of the reciprocal dead time should not be exceeded, or dead-time compensa-
tion should be used (see Sect. 7.9.2, page 338). Moreover, often a different IRF of
both channels has to be taken into account.
The rotational depolarisation time depends on the temperature. Temperature
stabilisation of the sample cuvette is therefore important. The excitation intensity
must be kept low enough to avoid local heating in the excited spot.
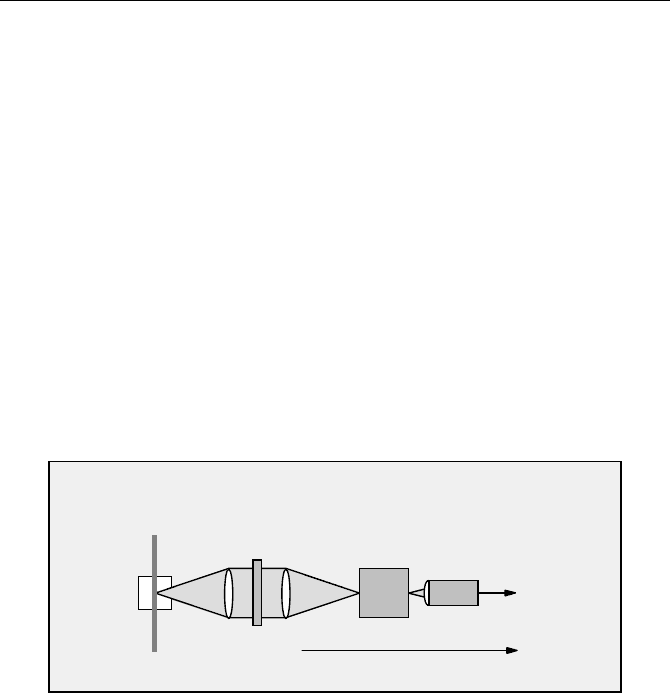
A wide variety of anisotropy measurement setups are used. The simplest solu-
tion is the „L configuration“, i.e. a standard fluorescence setup with 90° excita-
tion. A polariser is placed in the detection path and the components I
p
(t) and I
s
(t)
are measured consecutively with the polariser in 0° and 90° orientation (Fig. 5.16).
Instruments of this type were used in [338] and [272]. The advantage of this setup
is that the instrument response function is the same for both measurements. The
drawback is that two measurements are required. Drifts in the detector efficiency,
photobleaching, or temperature changes in the sample can therefore impair the
results. Moreover, about 50% of the photons are not used, which can be a draw-
back if the photostability of the sample is an issue.
Sample
Laser
Lens
Polariser
0° / 90°
Monochromator
PMT
Lens
CFD
(Routing)
to TCSPC module
vertically
polarised
Fig. 5.16 Single detector anisotropy setup
Flipping the polariser between 0° and 90° can be combined with controlling the
destination of the photons in the TCSPC memory via one of the routing bits. The
fluorescence decay curves for I
P
and I
S
are then automatically stored in separate
memory blocks. The best way is certainly to switch periodically between I
P
and I
S
and to route the signals into different memory blocks (see also Sect. 3.2, page 33).
The benefit of multiplexing is that changes in the sample and changes of the detec-
tor efficiency influence I
P
and I
S
likewise. This causes a reduction in the effects of
timing drift, detector efficiency changes, or photobleaching. An instrument with
periodical switching is described in [133] and [134].
Flipping a polariser between 0° and 90° can be accomplished at a rate of about
one turn per second. Faster multiplexing rates can be obtained from the system
shown in Fig. 5.17. I
p
and I
s
are separated by a beamsplitter and two polarisers or a
polarising beamsplitter and multiplexed into one detector by a rotating sector
mirror. The routing signal is derived from the rotation of the mirror. An optical
system of the design shown in Fig. 5.17 is described in [28].
5.1 Classic Fluorescence Lifetime Experiments 81
Laser
Polariser 90°
CFD
Polariser 0°
Beam
Splitter
Mirror
Mirror
Sample
Rotating
Sectored
Mirror
to SPC,
Reference
to TCSPC,
Routing
Motor
Fig. 5.17 Multiplexed measurement of I
p
and I
s
. Lenses and filters not shown
The drawback is that the optical system is complicated. A sector mirror is not
commonly available, and it must be well aligned on the driving shaft to avoid
wobbling of the reflected beam. Although the same detector is used for both light
paths, it is not simple to obtain exactly the same IRF in both channels. In particu-
lar, the illuminated areas of the detector for the 0° beam and the 90° beam must
coincide exactly.
[540] describes another system to record two fluorescence components simul-
taneously. The fluorescence signal is split into two components, one of which is
optically delayed. Both components are recorded in the same TAC interval. By
splitting the signal in a 0° and a 90° component, fluorescence anisotropy decays
can be recorded. However, identical IRFs in the channels are hard to obtain, and
pile-up can change the relative sensitivity of the channels.
Another commonly used setup for measurements of anisotropy is the „T ge-
ometry“ (Fig. 5.18).
Laser
Lens
Polariser 90°
Monochromator
PMT
Lens
or Filter Package
CFD
Lens
Polariser 0°
Lens
Monochromator
or Filter Package
PMT
Routing
Router
Fig. 5.18 Anisotropy measurement in the T geometry
The sample (usually a cuvette) is measured from both sides under different po-
larisation angles. Two detectors and a router are used to detect I
p
and I
s
simultane-
ously [58, 59]. The T geometry with routed detection has twice the efficiency of a
sequential measurement. Moreover, possible counting loss due to the dead time of
the TCSPC module affects both channels in the same way and therefore does not
affect the measured intensity ratio. The dual-detector routing technique is even
able to record dynamic changes of the lifetime and depolarisation time. The draw-
back is that the instrument response functions of the two detectors are different,
82 5 Application of Modern TCSPC Techniques
which makes the data analysis more difficult than for a single-detector setup. The
problem is eased by using extremely fast detectors, i.e. R3809U MCPs.
In cases where the light cannot be collected from both sides of the sample, i.e.
in a confocal microscope, a 1:1 beamsplitter and two polarisers or a polarising
beamsplitter can be used to separate I
p
and I
s
.
In principle, an anisotropy decay instrument can also be built with a rotating
polariser, see Fig. 5.19.
Sample
Laser
PMT
CFD
(Routing)
to SPC module
Rotating
Polariser
Angle, digital
Lens
Filter
time, ns
Intensity
Angle
Result
Fig. 5.19 Anisotropy measurement by rotating polariser
The photons are recorded into a large number of curves in the SPC memory. The
recording is synchronised with the rotation, so that the recorded decay curves corre-
spond to different rotation angles. Synchronisation can be achieved by using a digi-
tal angle signal from the rotator as a routing signal or by using pulses from the rotator
as synchronisation for the „Scan Sync In“ mode of a TCSPC module designed for
scanning applications. The setup shown above can be used for samples of complex
anisotropy behaviour. Examples are samples with intrinsic optical activity, or
fluorophores in a fixed matrix. Although the implementation of the rotating polariser
principle is relatively simple, no such instrument has yet been described.
Anisotropy measurements are not only used for macroscopic samples, such as
solution in cuvettes, but also for single molecules and in conjunction with lifetime
imaging in cells. Please see Sect. 5.7, page 129 and Sect. 5.13, page 193.
A fluorometer for anisotropy measurements by two-photon excitation is de-
scribed in [521]. The quadratic characteristic of two-photon excitation results in a
higher initial anisotropy than for one-photon excitation [54].
It should be noted that the technique described above cannot be used to meas-
ure rotational depolarisation times that are long compared to the fluorescence
decay time. In principle such depolarisation times can be measured by fluores-
cence correlation techniques.
5.1.9 Time Resolved Spectra
A lifetime setup containing a monochromator (Fig. 5.5) can be used to scan the
spectrum of the fluorescence. Time resolved spectra are obtained by recording the
photon number in defined time windows of the excitation period as a function of
the wavelength.
5.1 Classic Fluorescence Lifetime Experiments 83
Early instruments for time-gated spectral recording used a window discrimina-
tor and a counter behind the TAC. Within a selectable amplitude window the TAC
output pulses were counted for fixed time intervals. By scanning the monochroma-
tor wavelength, a spectrum within the selected time interval was obtained. This
technique was inefficient, of course, because it gated off the majority of the de-
tected photons [389].
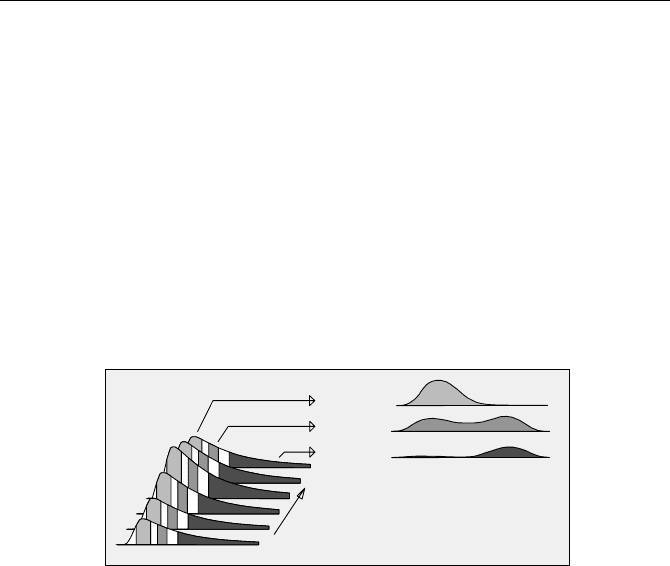
Advanced TCSPC devices usually have spectrum-scan modes that record sev-
eral spectra in different time windows simultaneously. The principle is shown in
Fig. 5.20. The wavelength is scanned, and for each wavelength a fluorescence
decay curve is recorded. The counts in the time channels of the decay curve are
averaged within selectable time intervals. The averaged counts are stored as func-
tions of the wavelength. Several independent time windows can be used simulta-
neously. Therefore the efficiency is better than for a system that uses a single
window discriminator.
T Window 1
Spectrum 1
T Window 1
Spectrum 2
T Window 2
t (ps)
Wavelength
Spectrum 3
T Window 3
T Window 2
T Window 3
Wavelength
Scan
Fig. 5.20 Recording time-resolved spectra by calculating intensities in several time intervals
The recording sequence must be synchronised with the wavelength scan in the
monochromator. This can be achieved by software control of both the recording
and the wavelength stepping, or by triggering the subsequent recording steps by a
pulse generated at each wavelength step.
Unfortunately, there are general objections against the gated spectrum re-
cording technique. The problems are already stated in [389] and result from the
obvious fact that the data are not deconvoluted from the instrument-response func-
tion. The effective time window in which a spectrum is obtained is a convolution
of the averaging-time interval with the IRF. No matter how short a time interval is
selected, the effective time interval cannot be shorter than the IRF.
The second objection concerns gated detection in general. Gated spectrum re-
cording is normally used to separate the fluorescence spectra of different kinds of
molecules by their fluorescence lifetimes. However, whatever gate interval is
used, the integral over the interval always contains the fluorescence of all of the
types of molecules. Unless the lifetimes are very different, gated detection is a
poor technique to separate the fluorescence signals of different species. Theoreti-
cally the separation efficiency can be improved by using several time gates, but
the choice of gate intervals is limited because they are smeared by the instrument
response function.