Webster R., Oliver M.A., Geostatistics for Environmental Scientists
Подождите немного. Документ загружается.


somewhat less well than the model fitted to K alone, and we can imagine that
we could fit the other variograms better if we treated them individually.
Nevertheless, the fit is generally good, and even for P the model fits fairly
well over most of the working lag distance. The dashed lines in the graphs in the
right-hand column of Figure 10.3 are the hulls of perfect correlation for the
cross-variograms. In all three the model is some way from the hulls, showing
that the spatial cross-correlations are at best moderate and like the ordinary
simple correlations (Table 10.2).
Finally, we comment on the practical meaning of the coregionalization. The
correlation between K and P is positive, and all the cross-semivariances are
positive. The two variables characterize the nutrient status of the soil. The
correlations between yield and K and P are all negative, and this might come as
a surprise. Farmers and their advisers have been used to thinking that more K
and P in the soil would result in greater yield. Now that yield can be recorded
automatically at harvest, they are discovering that large yields deplete the soil
locally and that they should fertilize differentially to maintain sufficient K and
P over the whole of each field. Large concentrations of K and P indicate small
off-take of these nutrients by the crop and thus smaller yields. Webster, in Lake
et al. (1997, pp. 74–77), has shown another example from the same district.
Table 10.3 Coefficients of spherical model fitted independently to auto- and cross-
variograms of K, P and barley yield at CEDAR Farm. The parameters c
0
, c and a are the
nugget, sill of the correlated variance and the range, respectively.
c
0
ca/m
K 63.7 855.4 121.9
P 25.2 – –
Yield 0.121 0.167 151.0
K P 20.48 294.6 150.2
K yield 1.51 7.94 130.1
P yield 0.550 4.548 168.5
Table 10.4 Coefficients b
k
uv
of the linear coregionalization with nugget plus spherical
for K, P and yield at CEDAR Farm.
K P Yield
Nugget, b
1
uv
K 157.28
P 21.34 2.8960
Yield 0.8683 0.11305 0.15027
Correlated variance, b
2
uv
K 785.15
P 291.39 218.1996
Yield 7.4239 3.5149 0.13027
Example: CEDAR Farm 227

10.4 COKRIGING
Having learned how to model the coregionalization, we can use our knowledge
of the spatial relations between two or more variables to predict their values
by cokriging. Typically the aim is to estimate just one variable, which we
may regard as the principal or target variable, at a point x
0
or in a block B, from
Figure 10.3 Autovariograms (left) and cross-variograms (right) of K, P and barley
yield at CEDAR Farm. The experimental values are plotted as points and the solid lines
are of the model of coregionalization. The dashed lines in the right-hand graphs are the
hulls of perfect correlation.
228 Cross-Correlation, Coregionalization and Cokriging
data on it plus those of one or more other variables, which we regard as
subsidiary variables. Cokriging is simply an extension of autokriging in that
it takes into account additional correlated information in the subsidiary
variables. It appears more complex because the additional variables increase
the notation.
Let there be V variables, l ¼ 1; 2; ...; V, and let us denote the one we wish to
predict as u; this will usually have been less densely sampled than the others. In
ordinary cokriging we form the linear sum
^
Z
u
ðBÞ¼
X
V
l¼1
X
n
l
i¼1
l
il
z
l
ðx
i
Þ; ð10:17Þ
where the subscript i refers to the sites, of which there are n
l
where the variable
l has been measured. The l
il
are weights, satisfying
X
n
l
i¼1
l
il
¼
1 l ¼ u;
0 l 6¼ u:
ð10:18Þ
These are the non-bias conditions, and subject to them the estimation variance
of
^
Z
u
ðBÞ for a block, B, is minimized by solution of the kriging system, which, in
full, is
X
V
l¼1
X
n
l
i¼1
l
il
g
lv
ðx
i
; x
j
Þþc
v
¼
g
uv
ðx
j
; BÞ;
X
n
l
i¼1
l
il
¼
1 l ¼ u;
0 l 6¼ u:
ð10:19Þ
for all v ¼ 1; 2; ...; V and all j ¼ 1; 2; ...; n
v
. The quantity g
lv
ðx
i
; x
j
Þ is the
(cross-)semivariance between variables l and v at sites i and j, separated by the
vector x
i
x
j
;
g
uv
ðx
j
; BÞ is the average (cross-)semivariance between a site j and
the block B; and c
v
is the Lagrange multiplier for the vth variable. We print
‘cross’ in parentheses because if l ¼ v or u ¼ v the semivariances are the
autosemivariances. This set of equations is the extension of the autokriging
system, equations (8.11).
Solving equations (10.19) gives the weights, l, which are inserted into
equation (10.17) to estimate Z
u
ðBÞ, and the estimation variance, the cokriging
variance, is obtained from
s
2
u
ðBÞ¼
X
V
l¼1
X
n
l
j¼1
l
jl
g
ul
ðx
j
; BÞþc
u
g
uu
ðB; BÞ; ð10:20Þ
Cokriging 229
where
g
uu
ðB; BÞ is the integral of g
uu
ðhÞ over B, i.e. the within-block variance
of u.
The equations can be represented in matrix form. For simplicity consider two
variables, u and v, only. The matrices are easily extended to more. Let G
uv
denote a matrix of semivariances (including cross-semivariances where u 6¼ v)
between sampling points in a neighbourhood. Let there be n
u
places at which
variable u was measured and n
v
where v was measured. The order of the matrix
is n
u
n
v
:
G
uv
¼
g
uv
ðx
1
; x
1
Þ g
uv
ðx
1
; x
2
Þ g
uv
ðx
1
; x
n
v
Þ
g
uv
ðx
2
; x
1
Þ g
uv
ðx
2
; x
2
Þ g
uv
ðx
2
; x
n
v
Þ
.
.
.
.
.
.
.
.
.
g
uv
ðx
n
u
; x
1
Þ g
uv
ðx
n
u
; x
2
Þ g
uv
ðx
n
u
; x
n
v
Þ
2
6
6
6
4
3
7
7
7
5
:
We denote by b
uu
and by b
uv
the vectors of autosemivariances for variable u and
cross-semivariances:
b
uu
¼
g
uu
ðx
1
; BÞ
g
uu
ðx
2
; BÞ
.
.
.
g
uu
ðx
n
u
; BÞ
2
6
6
6
4
3
7
7
7
5
; b
uv
¼
g
uv
ðx
1
; BÞ
g
uv
ðx
2
; BÞ
.
.
.
g
uv
ðx
n
v
; BÞ
2
6
6
6
4
3
7
7
7
5
:
The matrix equation is then
10
10
G
uu
G
uv
.
.
.
.
.
.
10
01
01
G
vu
G
vv
.
.
.
.
.
.
01
11 ...100...000
00 ...011...100
2
6
6
6
6
6
6
6
6
6
6
6
6
6
6
6
4
3
7
7
7
7
7
7
7
7
7
7
7
7
7
7
7
5
l
1u
l
2u
.
.
.
l
n
u
u
l
1v
l
2v
.
.
.
l
n
v
v
c
u
c
v
2
6
6
6
6
6
6
6
6
6
6
6
6
6
6
6
6
4
3
7
7
7
7
7
7
7
7
7
7
7
7
7
7
7
7
5
¼
b
uu
b
uv
1
0
2
6
6
6
6
6
6
6
6
6
6
6
6
6
6
4
3
7
7
7
7
7
7
7
7
7
7
7
7
7
7
5
:
If we denote the augmented matrix of GsbyG, the vector of weights and
Lagrange multipliers by l, and the right-hand side vector by b, then we can
write the solution of the equation succinctly as
l ¼ G
1
b: ð10:21Þ
230 Cross-Correlation, Coregionalization and Cokriging
The cokriging (prediction) variance is given by
^
s
2
u
ðBÞ¼b
T
l
g
uu
ðB; BÞ: ð10:22Þ
As in autokriging, the block B may be of any reasonable size and shape, and
it may be reduced to a point, x
0
, having the same dimensions as the support on
which the data were obtained. In these circumstances the averages
g
uv
ðx
j
; BÞ
become g
uv
ðx
j
; x
0
Þ, and
g
uu
ðB; BÞ is zero and hence disappears, thus:
b
uu
¼
g
uu
ðx
1
; x
0
Þ
g
uu
ðx
2
; x
0
Þ
.
.
.
g
uu
ðx
n
u
; x
0
Þ
2
6
6
6
4
3
7
7
7
5
; b
uv
¼
g
uv
ðx
1
; x
0
Þ
g
uv
ðx
2
; x
0
Þ
.
.
.
g
uv
ðx
n
v
; x
0
Þ
2
6
6
6
4
3
7
7
7
5
;
and
^
s
2
u
ðx
0
Þ¼b
T
l: ð10:23Þ
Myers (1982) presents the equations for cokriging somewhat differently and
comprehensively.
10.4.1 Is cokriging worth the trouble?
Cokriging is more complex than autokriging, and the practitioner can and
should ask whether the extra complexity improves the results: are the estimates
better in any sense?
We distinguish two situations. First consider the undersampled case. By
undersampling we mean that the variable to be estimated, the primary variable
u in the kriging equations, is sampled less intensely than the others, usually at a
subset of the sampling points. In this case the spatial correlation in the other
variables and their relation to u add information that is lacking in that of u
alone. As a result cokriging increases the precision, i.e. it reduces the estimation
variance. By how much depends on the degree of undersampling. In general,
the smaller the sampling intensity of u in relation to that of the other(s) the
greater is the benefit of cokriging. We illustrate this below.
In the fully sampled case, all variables are recorded at all sampling points.
Here the principal advantage is coherence. Kriging is coherent when the kriged
estimate of the sum of a set of variables, say
^
S, equals the sum of their
individually kriged estimates:
^
SðBÞ¼
X
n
l
i¼1
l
i
X
V
l¼1
z
l
ðx
i
Þ¼
X
V
k¼1
X
V
l¼1
X
n
l
i¼1
l
il
z
l
ðx
i
Þ: ð10:24Þ
Cokriging 231
Cokriging ensures coherence. Otherwise the equality depends on the nature of
the coregionalization.
As an example, consider estimating the thickness of a soil horizon. A field
surveyor might have recorded the depths from the surface to the top and
bottom of the horizon in question at the sampling points. At each point the
thickness is simply the difference between the two. We could krige the thickness
to estimate it at unrecorded positions. Alternatively, we could krige the depths
to the top and the bottom of the horizon and compute their differences. If we
were to do that for each variable independently then we should find that in
general the differences between the kriged estimates were not the same as the
kriged differences, i.e. the kriged thickness. If, however, we were to cokrige the
depths to top and bottom then the differences between the kriged estimates
would equal the kriged thickness.
Where the variables are intrinsically coregionalized, i.e. all the variograms
are related linearly to a single basic model, autokriging of any variable gives the
same result as cokriging. The spatial information for the one variable is all there
is in the data, there is no more in that of the others, and there is no merit in the
more complex procedure.
Where the variogram of the primary variable, u, is linearly related to the
cross-variogram(s), autokriging u again gives results identical with cokriging.
The cross-correlation adds nothing.
In other situations the results are in general different. However, with full
sampling the differences are likely to be small, and experience suggests that the
differences are usually so small that they can be ignored unless coherence is
essential.
10.4.2 Example of benefits of cokriging
We can see something of the benefits of cokriging by following the same logic as
in Chapter 8, where we calculated the kriging variances for various sample
spacings from a model variogram. We placed sampling points on regular grids,
and we computed the variances at the centres of the grid cells where for
punctual kriging they were greatest. For block kriging the maxima can occur
when the target block is centred on a grid node, and so we calculated the
variance in those positions also. We displayed the results as curves of maximum
kriging variance against grid spacing (Figure 8.23).
For cokriging we have two or more variables. We can choose the primary
grid for the undersampled target variable, u, in the same way as for autokriging.
We can then superimpose denser grids for the subsidiary variables. With the
points at the nodes of these two grids we can set up and solve the cokriging
equations. The maximum kriging variances are no longer necessarily at the
centres of grids cells or centred over grid nodes, and so their positions must be
found by searching. As the density of the subsidiary grid is increased so the
232 Cross-Correlation, Coregionalization and Cokriging
kriging variance of the target variable should decrease, and doing the calcula-
tions as above and plotting the results will show just how beneficial cokriging is
at various scales. McBratney and Webster (1983) describe the procedure in
detail.
We illustrate the approach with the coregionalization at CEDAR Farm. As we
mentioned above, measuring nutrients in the soil is expensive in relation to the
benefits to be gained from knowing the concentrations. Arable farmers in
Britain can afford to sample their soil at a density of approximately one per
hectare; not more. Yet they would like to know the nutrient concentration at a
much finer resolution to vary their application of fertilizers. Automatic record-
ing of yield as the grain passes through the harvester is now quite feasible and
produces abundant dense data. So if the relation between yield and nutrient
status is sufficiently strong the farmer might use the dense data on yield to
improve his prediction of nutrient concentration. So let us see to what extent we
might use this approach in the situation at this farm.
We suppose that available phosphorus (P) is the target variable and we shall
use yield as the subsidiary variable. We take the parameters for the cokriging
from the coregionalization model (Table 10.4). We have chosen intervals for the
primary grid from near 0 to 400 m. We have imposed subsidiary grids with
intervals of 1/2, 1/3, 1/4 and 1/5 of the primary grid, giving sampling ratios of
4, 9, 16 and 25. The smallest intervals are impracticable because the cutter bar
of a modern harvester is typically 4 m wide on British farms, but we include
them to complete the picture and for theoretical interest. We have solved the
kriging systems for punctual kriging and also computed the kriging variances
for blocks 24 m 24 m. We choose this size because the standard farm
machinery spreads fertilizer in bands this wide.
The results are plotted as graphs of maximum kriging variance against
sample spacing in Figure 10.4. In each graph the uppermost solid curve is for
autokriging and the ones beneath it are in order from top to bottom for
cokriging with the subsidiary grid interval 1/2, 1/3, 1/4 and 1/5 of that of
the primary grid.
The upper pair of graphs, Figure 10.4(a) for punctual kriging and
Figure 10.4(b) for block kriging, show that with the actual model of coregio-
nalization for this field the reductions in kriging variance from adding yield in
the kriging equations to predict P are modest. The reason is that the correlation
between the two is itself modest. If the cost of installing a recorder to measure
yield and handling the data is much less than that of analysing the soil for P
then it might be worth the trouble, but in any event the farmer cannot expect
large gains in precision or to save much in soil sampling and analysis.
In passing, we note that the block-kriging variance is less than the variance
of punctual kriging with the same sampling configuration by an amount
approximately equal to the within-block variance of P.
The outlook might be rosier with stronger association between target and
subsidiary variables, and to illustrate this we have repeated the exercise using
Cokriging 233
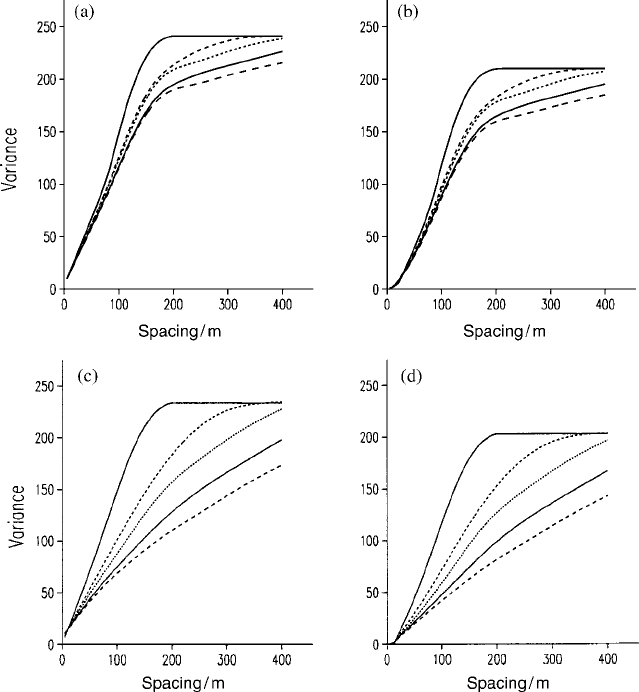
a model of perfect correlation, the lower part of the hull in Figure 10.3(f).
Figure 10.4(c)–(d) displays the results. Now large differences emerge as the
density of the subsidiary grid increases. With a sampling ratio of 25 for the
subsidiary variable we can reduce the maximum kriging variance to one-third
of that from autokriging. The farmer could increase the ratio further and gain
even bigger benefits in such circumstances.
Figure 10.4 Graphs of maximum kriging variance of phosphorus (P) against sample
spacings on a primary grid with denser observations of yield on subsidiary grids.
(a) Punctual kriging of P using the fitted model of coregionalization (Table 10.4);
(b) kriging of 24 m 24 m blocks with the same model; (c) punctual kriging of P using a
model of perfect correlation (Figure 10.3); (d) block kriging (24 m 24 m blocks) with
the perfect model. In each graph the uppermost curve is that for autokriging and the
ones below are in order for spacings on the subsidiary grid of 1/2, 1/3, 1/4 and 1/5 of
those on the primary grid.
234 Cross-Correlation, Coregionalization and Cokriging

10.5 PRINCIPAL COMPONENTS
OF COREGIONALIZATION MATRICES
The full coregionalization model of V variables has V ðV þ 1Þ=2 variograms,
and if each has K basic functions then there are K V coefficients. We have
already seen the set of auto- and cross-variograms for CEDAR Farm, with three
variables and K ¼ 2 basic functions (Table 10.4 and Figure 10.3). The
correlations are moderate, and though we have used the relation between P
and yield to illustrate cokriging there is not a great deal of interest in exploring
them further. Where the correlations are stronger, however, it may be worth
analysing the coregionalization matrices to see how the correlation varies with
scale. To illustrate this we turn to an original investigation of heavy metals in
the soil in the Swiss Jura by Atteia et al. (1994) and Webster et al. (1994).
Some 14.5 km
2
near La Chaux-de-Fonds in the Jura were surveyed to
determine the concentrations of seven potentially toxic metals, namely cad-
mium (Cd), cobalt (Co), chromium (Cr), copper (Cu), nickel (Ni), lead (Pb) and
zinc (Zn), in the topsoil. Soil was removed with a cylindrical corer of 5 cm
diameter to a depth of 25 cm, which therefore defined the support of the sample.
Cores were taken at 214 intersections of a 250 m grid plus an additional 152
points arranged in nests around 38 of the grid nodes. The ‘total’ metal was
extracted from each sample by strong acid and measured. Atteia et al. (1994)
describe the sampling and analytical procedure in detail.
Table 10.5 summarizes the data from the 366 sites. It shows immediately
that the frequency distributions of four of the metals—Cd, Cu, Pb and Zn—were
Table 10.5 Summary statistics for heavy metals at La Chaux-de-Fonds on the original
scales (mg kg
1
) and with Cd, Cu, Pb and Zn transformed to their common logarithms.
Cd Co Cr Cu Ni Pb Zn
Minimum 0.14 1.55 3.32 3.55 1.98 18.7 25.0
Maximum 5.13 20.6 70.0 242 53.2 382.0 338.0
Mean 1.31 9.45 35.2 24.6 20.2 57.0 78.5
Median 1.11 9.82 34.8 17.4 20.8 46.8 74.0
Variance 0.7598 12.56 118.3 638.8 67.91 1527.9 1147.0
St. dev. 0.87 3.54 10.9 25.3 8.24 39.1 33.9
Skewness 1.43 0.20 0.34 3.87 0.17 4.22 2.74
Kurtosis 2.44 0.60 0.33 18.1 0.31 23.6 12.9
Logarithms
Mean 0.022 1.26 1.70 1.86
Variance 0.0868 0.1046 0.0414 0.0306
St. dev. 0.29 0.34 0.21 0.18
Skewness 0.30 0.51 1.10 0.07
Kurtosis 0.30 0.66 2.64 0.96
Principal Components of Coregionalization Matrices 235

strongly skewed, and so the data for these were transformed to their common
logarithms to stabilize their variances.
Further, the correlation matrix, Table 10.6, shows some fairly strong cor-
relations—between Co and Ni, and between Cu and Pb, for example. The
general strength of correlation in the data may be judged by converting the
matrix to principal components. The results are summarized in Table 10.7.
The two leading principal components account for 78% of the variance in the
matrix, given in the right-hand column. The correlation may then be displayed
in the plane of the first two axes by computing the correlation coefficients, c
ij
,
between the principal component scores and the original variables, as follows:
c
ij
¼ a
ij
ffiffiffiffiffiffiffiffiffiffiffi
n
j
=s
2
i
q
; ð10:25Þ
where a
ij
is the ith element of the jth eigenvector, n
j
is the jth eigenvalue, and s
2
i
is the variance of the ith original variable. We then plot these coefficients in
circles of unit radius in the planes of the leading components. Figure 10.5(a)
shows the result. The first axis represents the magnitude of the concentrations:
large concentrations of one metal are associated with large concentrations of
the others. Axis 2 spreads the metals out, and it is evident that Cu and Pb are
Table 10.6 Correlation matrix for seven heavy metals in the soil at La Chaux-de-Fonds
in the Swiss Jura with 364 degrees of freedom.
Log cadmium 1
Cobalt 0.393 1
Chromium 0.653 0.473 1
Log copper 0.243 0.271 0.300 1
Nickel 0.634 0.727 0.717 0.326 1
Log lead 0.346 0.212 0.335 0.795 0.372 1
Log zinc 0.677 0.523 0.669 0.700 0.687 0.685 1
Cd Co Cr Cu Ni Pb Zn
Table 10.7 Eigenvalues of correlation matrix for seven heavy metals in the soil at
La Chaux-de-Fonds.
Order Eigenvalue Percentage Accumulated percentage
1 4.123 58.90 58.90
2 1.342 19.17 78.07
3 0.681 9.72 87.79
4 0.344 4.91 92.70
5 0.229 3.27 95.97
6 0.162 2.31 98.28
7 0.120 1.72 100.00
236 Cross-Correlation, Coregionalization and Cokriging