Tennick A. Practical PowerPivot & DAX Formulas for Excel 2010
Подождите немного. Документ загружается.

74 Practical PowerPivot & DAX Formulas for Excel 2010
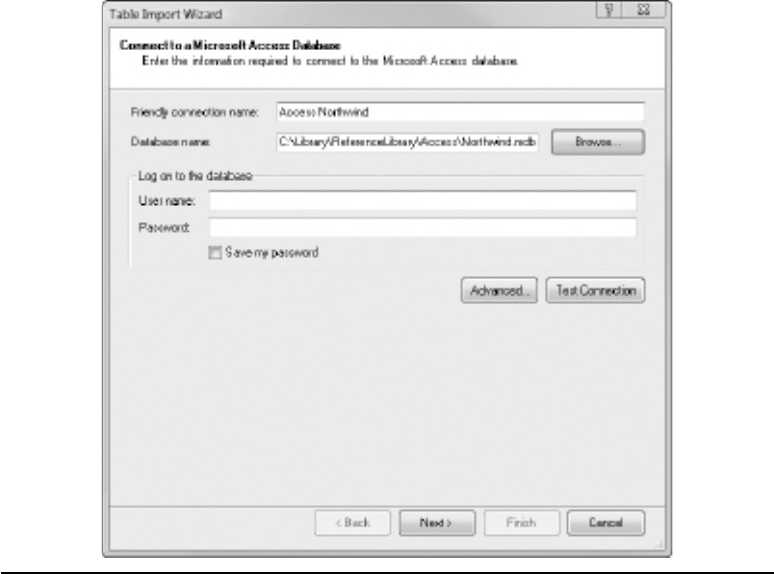
When you elect to pick tables, you will not see the schema names as you do with SQL
Server. When you elect to write your own query, you have to type your own Access SQL;
there is no handy graphical query designer as there is for SQL Server.
From Analysis Services or PowerPivot Importing from SSAS or PowerPivot was
not covered in the previous chapter. And, as it’s going to be so important to many readers,
it’s worth a detailed look here.
There are two important preliminary points to make. One (and you may be asking
this if you are already familiar with SSAS cubes), why bother to create an on-the-fly
PowerPivot cube when you already have a prebuilt SSAS cube? Two, why do SSAS and
PowerPivot appear as import options on the same menu choice?
The beauty of importing from an SSAS cube is that you are no longer limited to cube
data. You can combine SSAS multidimensional cube data with SQL Server relational
data, for example, or with data from many other sources. Furthermore, you can create
Figure 3-12 Connect to a Microsoft Access Database dialog
Chapter 3: PowerPivot: In-Depth 75
relationships between multidimensional and relational data, and, of course, display both
in the same pivot table. Combining multidimensional and relational data is very difficult
without PowerPivot. You have to know an awful lot of SQL and MDX! In PowerPivot,
it only takes a few mouse clicks and maybe one or two simple DAX functions to create
the mother of all data marts! PowerPivot uses a hidden copy of SSAS running in the
Excel process space. As such, importing into PowerPivot from another PowerPivot
or from SSAS are virtually the same under the hood. There is one proviso: In order
to import PowerPivot tables into PowerPivot for Excel, the source PowerPivot must
be PowerPivot for SharePoint (that is, from a PowerPivot workbook that has been
published to a PowerPivot-enabled SharePoint document library) and not PowerPivot
for Excel.
Here is a short step-by-step guide (you can try this if you have the SSAS Adventure
Works database and cube) to importing into PowerPivot from SSAS:
1. On the Home ribbon in PowerPivot, click From Database in the Get External
Data group.
2. From the ensuing drop-down, choose From Analysis Services or PowerPivot.
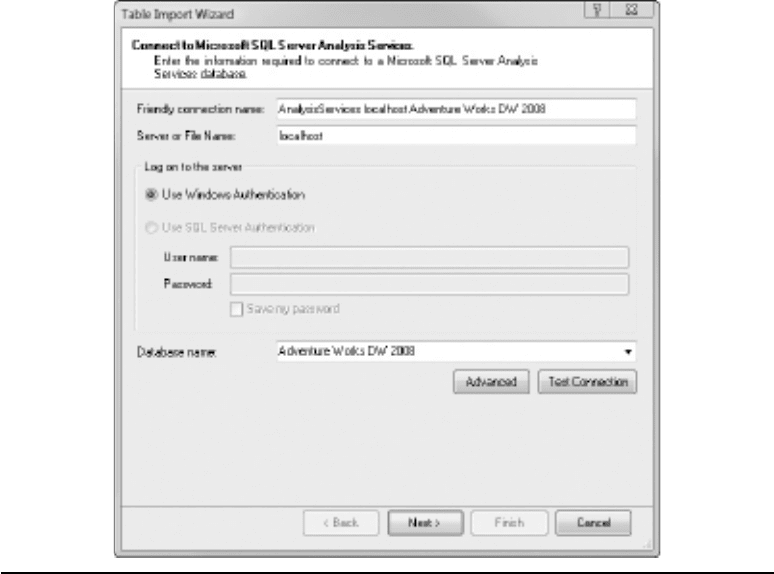
This opens the Connect to Microsoft SQL Server Analysis Services dialog. In this
dialog, you specify an SSAS server and database name. The dialog is shown in
Figure 3-13. If you have the SSAS Adventure Works database, select it from the
drop-down, or adapt the next few steps to your own SSAS database.
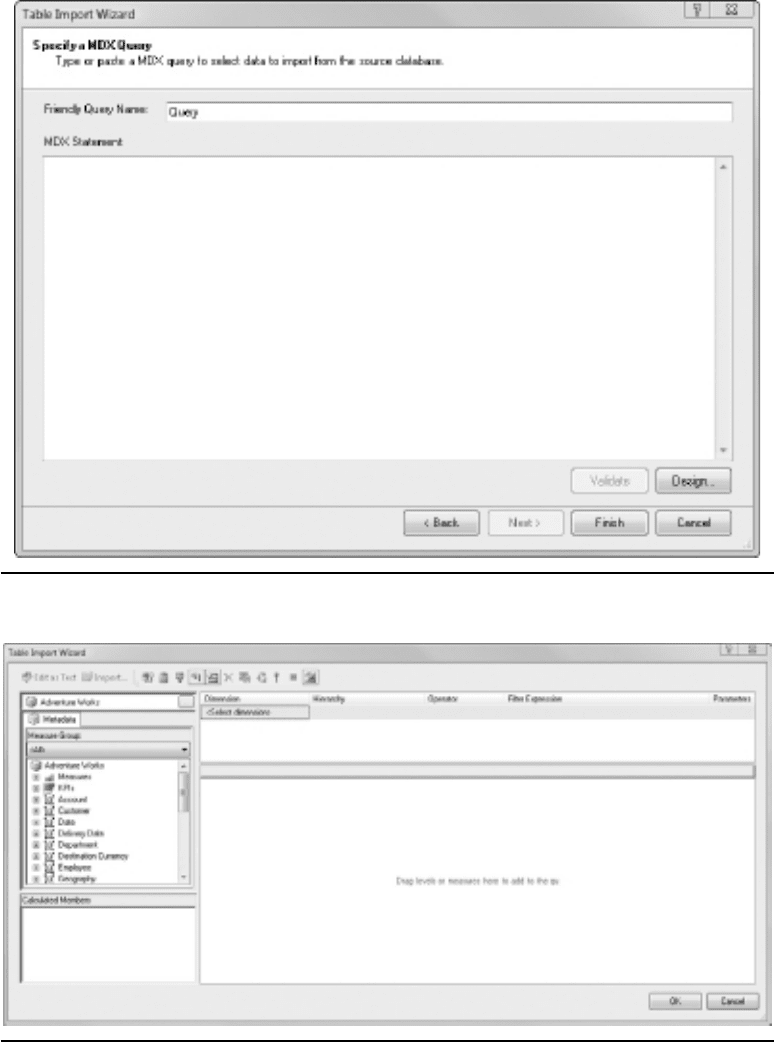
3. Click Next to open the Specify a MDX Query dialog where you can type an MDX
query, if you want. The Specify a MDX Query dialog is shown in Figure 3-14.
Or, at the bottom right in this dialog, click the Design button. You should be
looking at a graphical MDX query designer. This is almost identical to the MDX
designer in SQL Server Reporting Services (SSRS) and you may recognize it,
except there is no option to switch into Data Mining eXtensions (DMX) from
MDX, as there is in SSRS. The graphical query designer is shown in Figure 3-15.
PowerPivot currently supports MDX, but not DMX. In the MDX query designer,
there is an ellipsis button at the top left, just below the toolbar. This lets you
change the cube, but not the database, context. For example, you may see a cube
to which you have saved data mining content. Or, if you have SSAS Enterprise
Edition, you may see one or more perspectives on a cube.
Underneath you will see the Metadata pane. is shows the measures (or facts)
and dimensions in the cube or perspective. In the Metadata pane there’s a drop-
down for Measure Group that lets you display all measure groups or a specific
measure group. Choosing a specific measure group is quite useful—if you do so,
the dimensions shown in the Metadata pane are only those that relate to that
specific measure group. How dimensions relate to particular measure groups is
determined on the Dimension Usage tab of the SSAS cube designer back in
76 Practical PowerPivot & DAX Formulas for Excel 2010
Business Intelligence Development Studio (BIDS). By showing only one measure
group and its related dimensions, you avoid the possibility of creating a query that
returns meaningless data. For example, in the Adventure Works cube, Resellers are
not related to Internet Sales Amount—if you were to combine the two in a query,
by default, you would end up with repeating data. When you add dimensions to
the query, these are likely to be added to the Row Labels or Column Labels in a
PowerPivot pivot table (they are also eminently suitable for adding to the Report
Filter or Slicers Vertical or Slicers Horizontal). When you add measures, they are
usually placed in the Values or central section of a pivot table.
4. Let’s add some dimensions (strictly speaking, for those of you who are SSAS
veterans, we are going to add some dimension attribute hierarchy members) and
some measures. Expand the Date dimension and then the Calendar folder. Drag
the Date.Calendar Year attribute hierarchy (it’s a blue rectangle, not a blue
triangle/pyramid) into the central body of the query—you will see a caption, Drag
Levels or Measures Here to Add to the Query. Incidentally, a level is part of a
dimension attribute hierarchy (also part of a dimension user hierarchy).
Figure 3-13 Connect to Microsoft SQL Server Analysis Services dialog
Chapter 3: PowerPivot: In-Depth 77
Figure 3-14 Specify a MDX Query dialog
Figure 3-15 MDX graphical query designer
78 Practical PowerPivot & DAX Formulas for Excel 2010
5.
Now, expand the Product dimension and drag the Category attribute hierarchy
just to the right of Calendar Year in the central section. Expand Measures and
then expand the Internet Sales measure group folder. Drag Internet Sales Amount
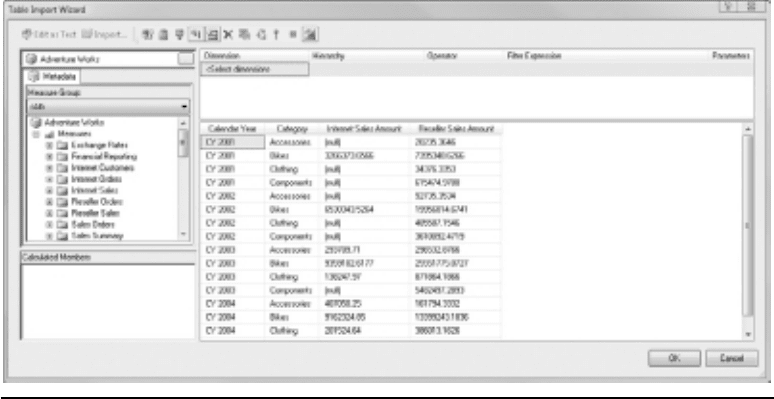
to the right of Category. The query can now execute (as the MDX is valid), and
you will see years, product categories, and Internet Sales figures. Once again,
expand Measures, if necessary. Expand the Reseller Sales measure group and drag
Reseller Sales Amount to the right of Internet Sales Amount. The query will re-
execute and you should see more year and category combinations—the null values
for Internet Sales Amount are now displayed as you have non-null values for
Reseller Sales Amount. The results are shown in Figure 3-16.
6. This is a good place to try out a calculated measure. You can have calculated
measures as part of your cube design in BIDS—it’s created using MDX.
Alternatively, you can create calculated measures at this stage, again created using
MDX. This is handy when you require an ad-hoc calculation. Or, if you are in a
PowerPivot pivot table, you can create the measure there—then you use DAX,
not MDX. All three methods are valid and all are feasible. You probably need to
try all three! You need to get the right balance between reusability, flexibility, and
performance—and that is going to involve some experimentation. SSAS cube
design is beyond the scope of this book—but you will learn the DAX way in this
book (hopefully!). And in this step, you will see how to create an ad-hoc MDX
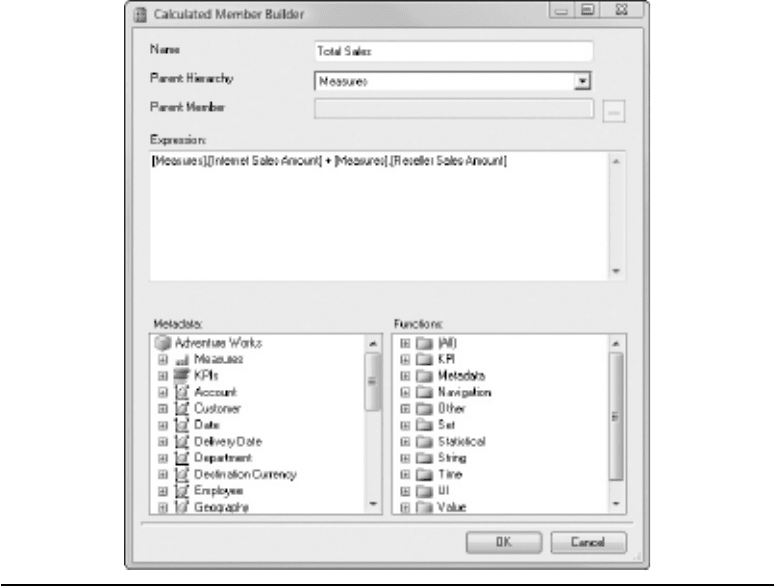
calculation. Begin by clicking the Add Calculated Member button on the toolbar;
it’s fourth from the left. This opens the Calculated Member Builder dialog. It’s
entitled Calculated Member rather than Calculated Measure because you can also
create non-measure dimension members. This dialog is shown in Figure 3-17.
Figure 3-16 MDX query results
Chapter 3: PowerPivot: In-Depth 79
7. In the Calculated Member Builder dialog, enter Total Sales as the Name and
make sure the Parent Hierarchy is Measures. Expand Measures in the Metadata
pane at the bottom left. Expand the Internet Sales measure group and double-
click Internet Sales Amount. This adds [Measures].[Internet Sales
Amount] to the Expression text box. Type a plus sign (+) after [Measures]
.[Internet Sales Amount]. Expand the Reseller Sales measure group and
double-click Reseller Sales Amount. The MDX formula in the Expression text
box should look like this:
[Measures].[Internet Sales Amount] + [Measures].[Reseller Sales Amount]
8. Click OK to exit the dialog, and your new measure appears in the Calculated
Members pane at the bottom left of the query designer. Drag your new measure
(Total Sales) to the right of Reseller Sales Amount in the central area of the query.
You will have a new column that adds sales together by year by product category.
Figure 3-17 Calculated Member Builder dialog
80 Practical PowerPivot & DAX Formulas for Excel 2010
Well done, you have just written some MDX! The last button on the toolbar is for
Design mode. Clicking this button toggles you between graphical mode and text
mode where you can see the MDX. Please note that switching modes and making
changes will overwrite changes made in the other mode. The MDX generated is
perhaps overkill, so if you are new to MDX, don’t be intimidated by the syntax.
Click OK to exit the designer.
9. You are now back again in the Specify a MDX Query dialog of the Table Import
Wizard. Here you can give your query a friendly name—this will be the name
of the PowerPivot table. Click Validate to confirm that your syntax is valid, then
click Finish, followed by Close. Your PowerPivot table is showing a subset of
the cube data. You have converted multidimensional data into a flat, relational
format. If you place this table into a PowerPivot pivot table in Excel, you are
converting it back again into multidimensional data! We are going to extract
the two dimensions and the measures out of the table as separate dimensions
and measures. This raises a very important conceptual point. You are effectively
creating a subset of an SSAS cube; you are creating a data mart from a data
warehouse. By extracting from a few data marts (that is, PowerPivot tables from
a cube), you can reassemble the marts into a new richer model in a PowerPivot
pivot table in Excel. You are free to create your own BI, for you and your team,
outside of the constraints of a predefined SSAS cube. Further, you can combine
these data marts with data imported from relational sources—you can create your
very own BI model, which may well be different from your corporate SSAS cube.
This is the real beauty of PowerPivot—and this is why it’s often called self-service
BI, or personal BI, or instant BI. You have complete control and total flexibility,
without having to understand star schemas and SSAS cube design. That said,
there still remains a vital role for a centralized, enterprise-wide SSAS cube. Most
organizations need both “traditional” SSAS cube BI and PowerPivot “self-service”
BI. Before attempting the next step, you may want to right-click or double-click
on the column headers in the PowerPivot table and give each column a friendlier
name. Please note that the order of the columns may be different from your
query—this is not at all important, as you can add them in any order you want to
a pivot table.
10. On the Home ribbon in PowerPivot, click PivotTable in the Reports group and
choose PivotTable from the drop-down menu. In the Create PivotTable dialog,
accept the default of New Worksheet and click OK. The Create PivotTable dialog
is shown in Figure 3-18. You are switched into an Excel worksheet, with an empty
pivot table to the left and a PowerPivot Field List to the right.
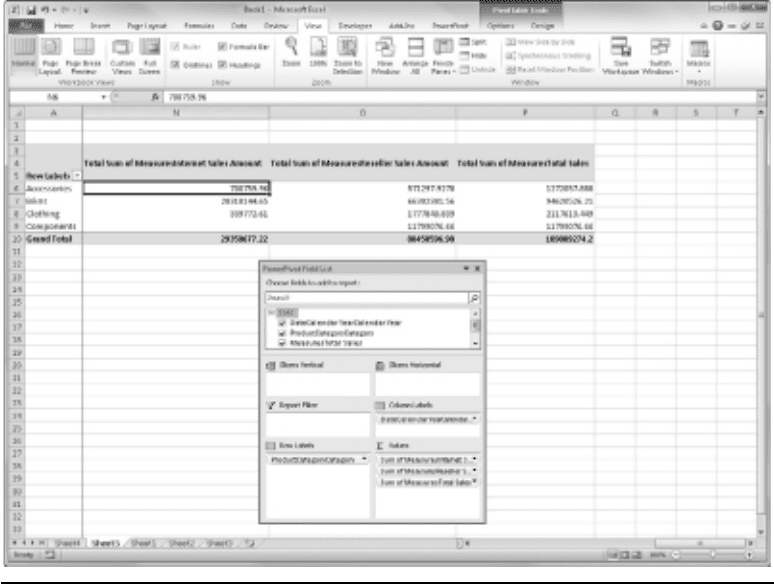
11. In the PowerPivot Field List, drag the year to the Column Labels drop-zone.
Drag the category to the Row Labels drop-zone. In turn, drag Internet Sales
Amount, Reseller Sales Amount, and Total Sales to the Values drop-zone. Note
the numbers appearing in the pivot table and the aggregate functions shown in
the Values drop-zone. Are you wondering why all three aggregations are Count?
Right-click each entry in the Values drop-zone, and from the context menu,

Chapter 3: PowerPivot: In-Depth 81
choose Summarize By, then Sum. If you look at the pivot table, you will see that
this has caused an error—the error message is telling you that you can’t perform
a Sum aggregation on string values. Often, PowerPivot will automatically convert
data types for you. This is one occasion where it doesn’t. Measures imported from
cubes are always given a data type of Text, despite the data type of the measure
in the cube design. If you understand BIDS, and you know how to “undeploy” or
reverse-engineer the Adventure Works cube, you will see that the DataType for
Internet Sales Amount and Reseller Sales Amount is Currency. SSAS data types
are not fixed—you can override a sales amount with a string by using an MDX
calculated member or the Scope statement in an MDX script. In essence, the data
type is really Variant. PowerPivot has to play safe because this release does not
support the Variant data type, and it imports SSAS cube measures as Text. This
invalidates the measure for a Sum aggregation.
12. There are two ways to deal with this data type problem. One, you can use the
DAX function VALUE(). Two, you can permanently reset the data type in
PowerPivot. Here we adopt the second approach. Switch to PowerPivot and select
the three measures columns. You can do this by using the shift key with the
mouse, or work on each column individually. From the Formatting group on the
Home ribbon, choose Currency from the drop-down next to Data Type.
13. If you now switch back to Excel, there is a message at the top of the PowerPivot
Field List. It informs you that the PowerPivot data has changed. Click the
Refresh button next to the message. The measures should display correctly in
the pivot table. If you scroll across, the totals for Internet Sales Amount, Reseller
Sales Amount, and Total Sales are 29,358,677.22 and 80,450,596.98 and
109,809,274.20. The final resulting pivot table is shown in Figure 3-19.
That is very clever functionality. You could, of course, have connected a “normal”
Excel pivot table directly to the SSAS cube (you can connect to only one cube at a
time) without using PowerPivot at all. However, that is really not the point. To reiterate,
if you use PowerPivot, you can combine multidimensional data from multiple SSAS
cubes with data from relational sources or even from text files. You are no longer solely
dependent on your SSAS developers and a single SSAS cube for your BI.
Figure 3-18 Create PivotTable dialog
82 Practical PowerPivot & DAX Formulas for Excel 2010
You can even import data into PowerPivot from PowerPivot. However, the
PowerPivot source must be PowerPivot for SharePoint, not PowerPivot for Excel.
PowerPivot for SharePoint is not free, unlike PowerPivot for Excel. You will need
SharePoint Server 2010, with Excel Services enabled, on a 64-bit machine with SQL
Server Analysis Services 2008 R2 installed in SharePoint integrated mode (the latter
is effectively PowerPivot for SharePoint). PowerPivot for SharePoint is not within the
scope of this book. But, if you do have it, you can import data into your PowerPivot for
Excel. To do so, you specify a URL to your PowerPivot for SharePoint workbook—
rather than the server and database name that we tried for an SSAS connection. If you
need to establish the URL of an object in SharePoint, you can refer to its properties.
If you want to know a little more about writing MDX queries, please refer to
Appendix B or to my book Practical MDX Queries for Microsoft SQL Server Analysis
Services 2008 (McGraw-Hill/Professional, 2010). MDX queries extract data from
SSAS cubes. SSAS also supports data mining models (a vital part of many BI
solutions). To extract data from data mining models (either as Cases or Content or
Prediction queries), you use DMX queries. This release of PowerPivot supports SQL
Figure 3-19 PowerPivot pivot table using SSAS cube data
Chapter 3: PowerPivot: In-Depth 83
and MDX but not DMX. In order to add SSAS data mining model data to your
PowerPivot tables, you can embed the DMX within SQL. Appendix C shows how to
write a few DMX queries and embed them inside SQL. If you want to learn DMX,
please refer to my book Practical DMX Queries for Microsoft SQL Server Analysis Services
2008 (McGraw-Hill/Professional, 2010).
From Report
The next item in the Get External Data group of the PowerPivot Home ribbon is
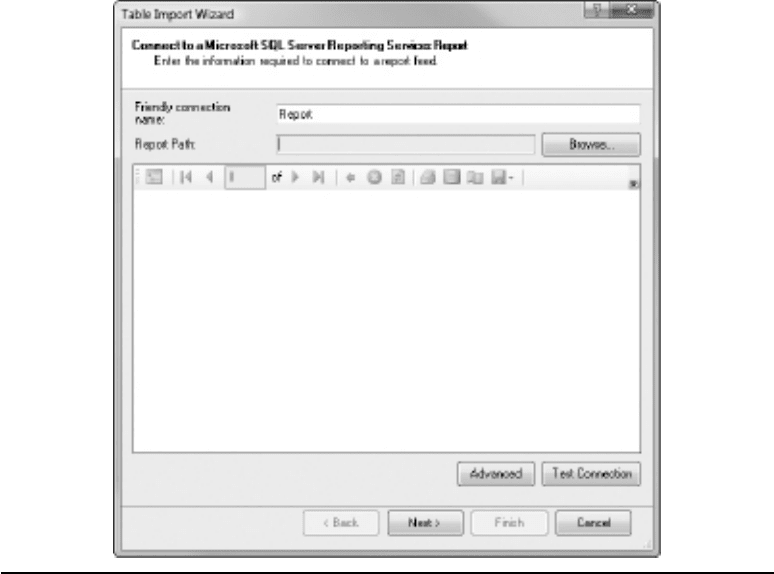
From Report. If you click this, the Connect to a Microsoft SQL Server Reporting
Services Report dialog opens, as shown in Figure 3-20. In this dialog, you have to enter
a Report Path. To do so, click the Browse button to see the Open Report dialog. In the
Name text box of this dialog, type the path to your Report Server or select a recently
visited site. If SSRS is running in native mode, this is likely to be in the form of
http://servername/reportserver. In SharePoint integrated mode, this is likely to be
http://servername/<document library>. However, if SSRS is in native mode and you
have SharePoint too, you might need to include the port number in the URL—it
Figure 3-20 Connect to a Microsoft SQL Server Reporting Services Report dialog
