Skiadas C.H., Skiadas C. Chaotic Modelling and Simulation. Analysis of Chaotic Models, Attractors and Forms
Подождите немного. Документ загружается.

74 Chaotic Modelling and Simulation
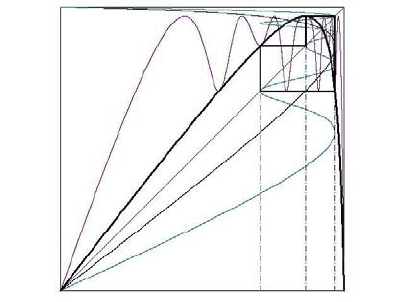
FIGURE 3.32: A third order cycle of the GRM1 model for b = 1.3 and σ =
0.025
Another serious problem when applying the logistic model is that the oscillations
following the bifurcation process are quite large for most real life situations. On the
other hand, in the cases of the GRM1 and the modified logistic, the amplitude of the
oscillations varies according to the values of the parameters selected. A comparative
example is given by observing the third order cycle for the logistic, the GRM1 and
the modified logistic models (Figure 3.32). The interval of this third order cycle
is included inside the chaotic region as illustrated in the bifurcation diagram. By
observing this third order cycle, valuable information for the chaotic region can be
obtained. During the third order cycle, the logistic model oscillates between 0.1494
and 0.9594, that is, the oscillations cover about 80% of the total amplitude. On the
contrary, the GRM1 model is more flexible. The oscillations during the third order
cycle can vary according to the values selected for the parameter σ. In Figure 3.32,
σ = 0.025. For this value of σ the GRM1 model shows a third order cycle for
b = 1.3. The maximum value is 0.9693, and the minimum value is 0.7047. The
oscillations therefore cover only 27% of the total amplitude. Accordingly, for lower
values of the parameter σ the amplitude of the oscillations during the third order
cycle is smaller.
When the parameters for the GRM1 model are b = 1.2 and σ = 0.01175, the
higher value of the third order cycle is x
max
= 0.9768 and the lower value is x
min
=
0.7846. The third order oscillations cover 19% of the total accepted amplitude of the
process. The (x, t) oscillation diagram is presented in Figure 3.33.
During the first time periods the process follows a growth path. Later on, chaotic
oscillations appear and the process is stabilised, giving third order chaotic oscilla-
tions.
The third order cycle for the modified logistic model is illustrated in Figure 3.34.
The parameters selected are e = 0.0719 and b = 1.3. The minimum value is
x
min
= 0.8069 and the maximum value is x
max
= 0.9987. The resulting third or-
der oscillations cover 20% of the total amplitude.

The Logistic Model 75
FIGURE 3.33: A third order cycle of the GRM1 model for b = 1.2 and
σ = 0.01175
FIGURE 3.34: A third order cycle of the modified logistic model for b = 1.3
and e = 0.0719
FIGURE 3.35: The first bifurcation cycle of the GRM1 model for b = 1.3 and
σ = 0.032
76 Chaotic Modelling and Simulation
Figure 3.35 illustrates the GRM1 model at the first bifurcation stage. The process
ends at a simple oscillation scheme. The parameters are b = 1.3 and σ = 0.032.
The maximum and minimum levels of the oscillation are illustrated by the lines with
two and one dots respectively. These levels are obtained when x
n+2
= x
n
= x. The
resulting fourth order equation can be solved explicitly, giving the values for the first
bifurcation levels. The fourth order equation for x has, among others, the roots that
satisfy the relation
x
n+1
= x
n
= x
or, after substituting from the GRM1 map
x =
bx(1 − x )
1 − (1 − σ)x
or after some simplification:
x
x −
b − 1
b − 1 + σ
!
= 0 (3.18)
The roots of this equation are x
1
= 0 and x
2
=
b−1
b−1+σ
. The resulting equation for
x
n+2
= x
n
= x can then be transformed to
x
x −
b − 1
b − 1 + σ
!
×
×
b(b + 1 − σ)x
2
− (b + 1 −σ)(b + 1)x + (b + 1)
= 0 (3.19)
Clearly, this fourth order equation has the two roots from (3.18) as well as two
other roots:
x
3,4
=
(b + 1) ±
q
(b + 1)
2
−
4b(b+1)
b+1−σ
2b
It is clear that the equation expressing every higher bifurcation level includes the
solutions of the equations expressing the lower bifurcation stages. What is different
is the stability of solutions.

The Logistic Model 77
Questions and Exercises
1. Show that the fixed point of the map y = bx(1 − x) is y = x = 1 −
1
b
.
2. Compute the derivative of the transformation y = f ( f (x)), where
f (x) = bx(1 − x)
at the 2-point orbit given in equation (3.7), and determine from this the range
of values of b for which this orbit is attracting.
3. Use the logistic map as a random number generator: For various high values
of b, start from an arbitrary value of x, and perform 100, 000 repetitions. Com-
pare the distribution of the 100, 000 values to that of the uniform distribution,
as given by the random number generator of your computer. If you found
differences, how do you explain these differences?
4. The logistic map is defined on the interval: 0 < x
t
≤ 1. Show that this is
indeed the case, i.e. that, starting from an x in the interval [0, 1], the process
will remain in the interval. Find the related interval for the map x
t+1
= 1 + ax
2
t
.
For this latter case, draw the bifurcation diagram and find the first and the
second bifurcation points.
5. Consider the correct difference equation analogue to the logistic model, as
described in page 31. Find the interval where the map is defined and find the
formula for the first and second order bifurcation points.
6. Prove that the Gompertz map is defined into the interval 0 < x
t
≤
1
e
.
7. Transform the Gompertz and the Mirror Gompertz model to the related dis-
crete maps, and find the interval where every map is defined. Draw the bifur-
cation diagram for both cases and find the first bifurcation point.
8. Draw the bifurcation diagram for the map x
t+1
= b + e
−ax
4
t
.
9. Draw the bifurcation diagram for the map x
t+1
= b + e
−ax
3
t
, and compare the
results with the previous case.

Chapter 4
The Delay Logistic Model
4.1 Introduction
Delay models are applied in a large variety of cases in many scientific fields. Con-
sequently, it is difficult to classify the particular models used and to study them sys-
tematically. In this section we start with the study of simple delay models, and then
proceed to study more complicated models. Special attention is given to the develop-
ment and presentation of the most frequently used delay models, as well as to related
extensions and new delay models of particular interest. Of major importance are the
applications of delay models in physiological systems (Glass and Pasternack, 1978;
Glass and Mackey, 1988; Glass, 1988, 1991; Glass and Zeng, 1990; de Olivera and
Malta, 1987; Cabrera and de la Rubia, 1996; Celka, 1997; Sharkovsky, 1994; Ueda
et al., 1994; Bunner, 1999).
Delay models can be divided in two broad categories: The delay models expressed
by a difference equation
x
t+m
= f (x
t+m−1
, x
t+m−2
, . . . , x
t
) (4.1)
where m is the delay, and the delay models expressed by a differential equation
˙x = f (x
t
, x
t−T
) (4.2)
where T is the parameter expressing the delay.
4.2 Delay Difference Models
4.2.1 Simple delay oscillation scheme
Simple oscillation schemes can arise very easily when using delay difference equa-
tions. As an example, consider the simple first-degree-polynomial delay form:
x
t+2
= x
t+1
+ ax
t
(4.3)
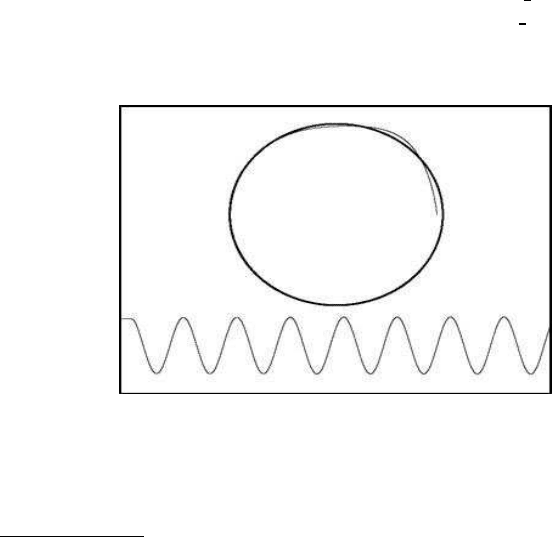
When a = −1, and for initial values x
1
= 0.2, x
2
= 0.3, the resulting two-dimensional
map has the hexagonal form illustrated at the top left of Figure 4.1. The hexagon
79
80 Chaotic Modelling and Simulation
at the top right is formed by considering random initials values (x
1
, x
2
), uniformly
chosen from the interval [0, 1]. This iterative scheme generates a discrete oscillation
over time (bottom of Figure 4.1).
FIGURE 4.1: A simple delay oscillation scheme (a = −1)
A variation of the hexagon in Figure 4.1 can be obtained by introducing a Eu-
clidean distance term in equation (4.1):
x
t+1
= x
t
+ a
x
t−1
√
x
t
+ x
t−1
Figure 4.2 shows the corresponding two-dimensional map for a negative value of
a, related to the size of the graph.
FIGURE 4.2: Variation of the simple delay model
The Delay Logistic Model 81
4.2.2 The delay logistic model
The delay logistic model is given by the equation:
x
t+1
= bx
t
(1 − x
t−m
) (4.4)
It has several interesting properties, depending of course on the values of b, but,
mainly, on the values of the delay parameter m. Clearly, for m = 0 equation (4.4)
reduces to the logistic equation. The main difference when the delay is present is the
formation of a limit cycle (Figure 4.3(b)). There is also a marked time period, during
which the system takes zero values. The resulting (x
t
, x
t−m
) diagram can be seen at
the top of Figure 4.3(b), with the (t, x
t
) diagram at the bottom.
The oscillations of the map (4.4) are of a particular form. Each oscillation is
followed by a linear term with value of zero. The distance between two successive
oscillations depends on the delay parameter: The higher the delay, the higher the dis-
tance. The simplest case is illustrated in Figures 4.3(a) and 4.3(b). (The parameters
are m = 1, b = 2.271 and m = 10, b = 1.2865 respectively).
(a) m = 1 (b) m = 10
FIGURE 4.3: The delay logistic model
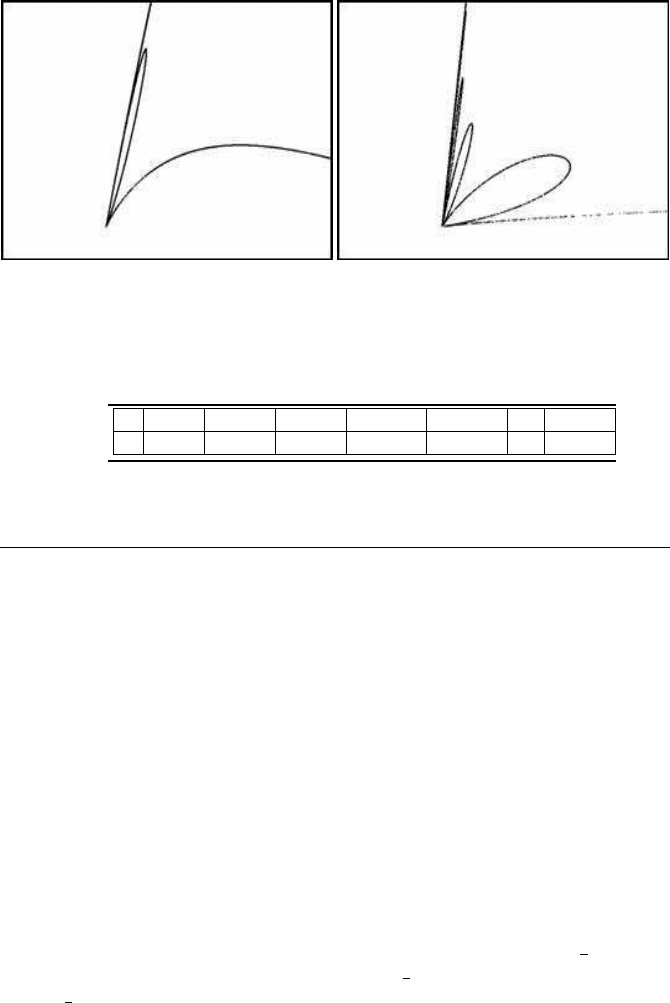
The special case with delay m = 1 has an interesting property, which can be seen
when examining the left corner (corresponding to the origin) of the (x
t−m
, x
t
) diagram
closer. The graph exhibits a small “fold,” as illustrated in Figure 4.4(a). The m = 5
case is even more interesting, with three folds (Figure 4.4(b), b = 1.44413).
Table 4.1 summarises the values of b used in our simulations. These are the max-
imum values for b for which the model makes sense.
82 Chaotic Modelling and Simulation
(a) Delay logistic (m = 1) (b) Delay logistic (m = 5)
FIGURE 4.4: Folds in the delay logistic model
TABLE 4.1: Limiting b values for the delay logistic
m 1 2 3 4 5 ··· 10
b 2.271 1.8395 1.6393 1.52195 1.44413 ··· 1.2865
4.3 Time Delay Differential Equations
The general form of a time delay differential equation is given by
˙x = f (x
t
, x
t−T
) (4.5)
where T > 0 is the time delay. The simplest time delay differential equation form is
the linear equation
˙x = −ax
t−1
(4.6)
The transformation T = at turns (4.6) into
˙y = −y
T −a
where y
T
= x
T/a
.
A very interesting observation here is that the parameter a is directly related to the
delay; The delay increases along with a. Theory suggests that for a =
π
2
the delay
equation has periodic solutions, whereas for a <
π
2
solutions converge to zero, and
for a >
π
2
, solutions diverge to infinity (Hoppensteadt, 1993).
Using a linear spline approximation method, we can perform a simulation of the
above simple time delay equation. The key step in this method is to take the delay
The Delay Logistic Model 83
interval T and divide it into n equal parts. The iterative process is given by the
following scheme:
˙y
0
= −ay
n
˙y
1
= −n(y
1
− y
0
)
.
.
.
˙y
i
= −n(y
i
− y
i−1
)
.
.
.
˙y
n
= −n(y
n
− y
n−1
)
(4.7)
This system was solved by using a fourth order Runge-Kutta method of numerical
integration, proposed at the end of the nineteenth century by the German mathemati-
cians Carl Runge and Wilhelm Kutta (Runge, 1895; Kutta, 1901). The method is
widely used and, when properly applied, gives good results. The selected time incre-
ment h must be sufficiently small, and the number of intervals n large enough. Sev-
eral iterations were tried out for various values of n. When n = 15 and h = 0.001, the
accuracy of the method is good. Figure 4.5 illustrates the two-dimensional Poincar
´
e
map,
1
and the periodic solutions of the system when a approaches
π
2
. The oscillations
are not stable; small changes of the parameter a from the value
π
2
lead to diverging
or converging oscillations.
FIGURE 4.5: A simple delay model (n = 15)
The behaviour of the simple oscillating scheme simulated above shows that oscil-
1
A Poincar
´
e map is a two-dimensional representation of a multi-dimensional flow of a non-linear
system. Geometrically, this map results by cutting the curves of a multidimensional flow by a plane. In
our case, a delay equation with delay m is equivalent to an m-dimensional system, and several Poincar
´
e
maps may be selected, for instance (x
t
, x
t+m
), (x
t+m−1
, x
t+m
), (x
t
, x
t+1
), (x
t
, x
t+2
) and so on. Each of these
maps leads to different graphs, showing us different aspects of the flow.