Shani G. Radiation Dosimetry: Instrumentation and Methods
Подождите немного. Документ загружается.

250 Radiation Dosimetry: Instrumentation and Methods
241
Am source. [22] The energy of the alpha particles was
degraded with thin mylar foils of different thicknesses.
The net glow curve is shown in Figure 4.40.
The TL glow curves were deconvoluted using the first-
order TL kinetics model according to the ‘‘Podgorsak
approximation” method:
(4.22)
where
T temperature (K), I intensity of the TL glow
signal at the temperature T, I
m
the maximum height
of the glow peak, E trap depth of the glow peak (eV),
T
m
temperature at the maximum peak height (K), and
k Boltzmann constant 8.62 10
5
eV/K. The trap
depth E (eV) is a linear function of the maximum peak
temperature T
m
; therefore, the following approximation
is valid:
(4.23)
The responses of extruded TLD-600 and TLD-700
ribbons (Solon Technologies, Ltd., Solon, OH), 3.175
3.175 0.889 mm
3
, were calibrated by McParland and
Munshi [23] against the thermal neutron fluence in a mod-
erated neutron field created in a tank of water (60 60
40 cm
3
) containing a
252
Cf spontaneous fission source.
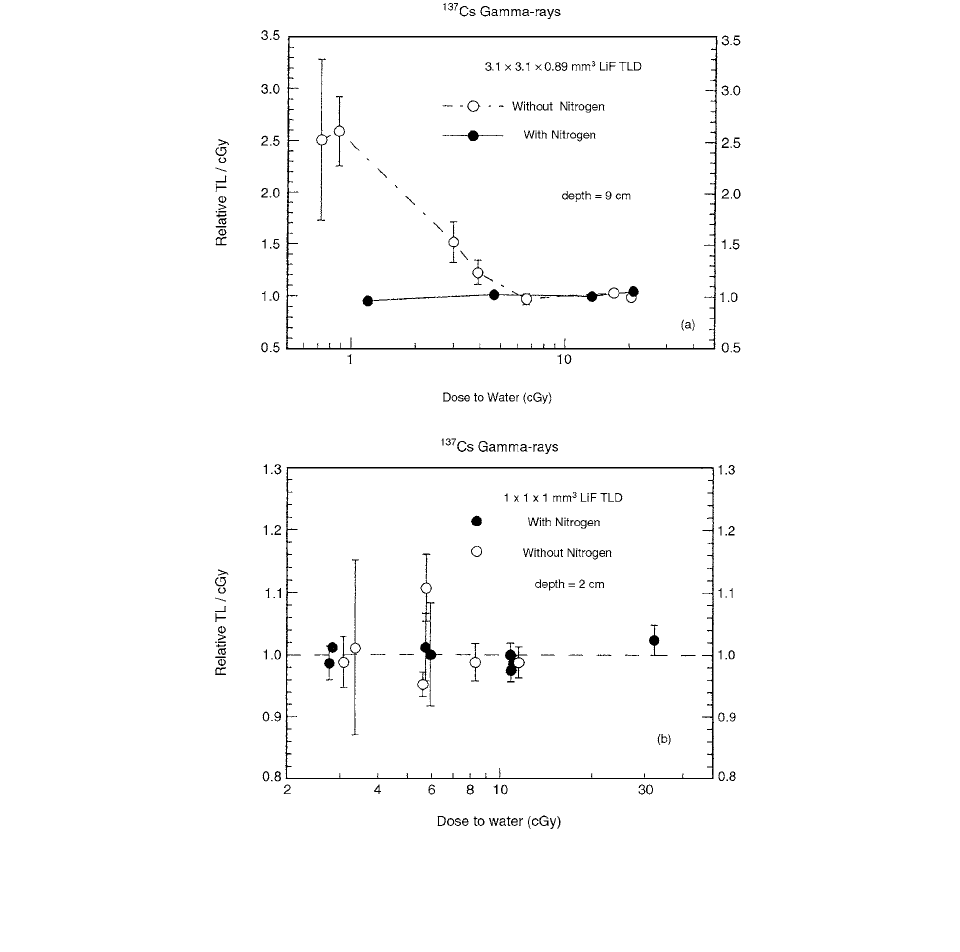
FIGURE 4.36 Effect of nitrogen gas flow on the standard deviation and linearity of large (a) and small (b) LiF TLD chips exposed
to the
-rays of a 10-mg Ra Eq
137
Cs tube. The relative sensitivity is defined here as the ratio of the sensitivity (TL/cGy) for a given
dose to the sensitivity of the TLDs with the absorbed dose of 22 cGy for large chips and 35 cGy for small chips and located at the
same source-to-detector distance. (From Reference [20]. With permission.)
IT() I
m
1 ET( T )k
1
T
m
2
()[exp
ET( T
m
)k
1
T
m
2
()]exp
E 25kT
m
Ch-04.fm Page 250 Friday, November 10, 2000 12:01 PM
Thermoluminescent Dosimetry 251
The source intensity was 2.1 10
7
neutrons s
1
, and the
TLDs were placed 15 cm from the source.
The thermal neutron response of the TLD-700 was ini-
tially investigated by comparing the response of the bare
TLD-700 in the moderated neutron/photon flux with that
with the dosimeter encapsulated in one of a number of
thermal neutron-absorbing shields. The absorbers consid-
ered were TLD-600 (LiF with 95.62%
6
Li and 4.38%
7
Li),
cadmium, and indium. A natural tin shield was also used.
The response of the TLD-700 was unaffected by the place-
ment of the TLD-600 absorber about it, whereas, in con-
trast, cadmium, which has a thermal neutron absorption
cross section about 2.5 times that of
6
Li, elevated the TLD-
700 response by a factor of almost 2. The indium led to an
even greater increase in the TLD-700 response, whereas the
tin shielding did not cause a significant elevation.
TLD-700 chips were irradiated [24] with the fast neu-
trons from
241
Am/Be and
252
Cf sources, energy-degraded
neutrons from the
241
Am/Be source moderated by light
water, and gamma-rays from a
137
Cs source. The net area
under the deconvoluted high-temperature (300°C) peak
of neutron-irradiated chips was observed to increase with
the average neutron energy. The high-temperature part
(250–340°C) of the TL glow curve was deconvoluted using
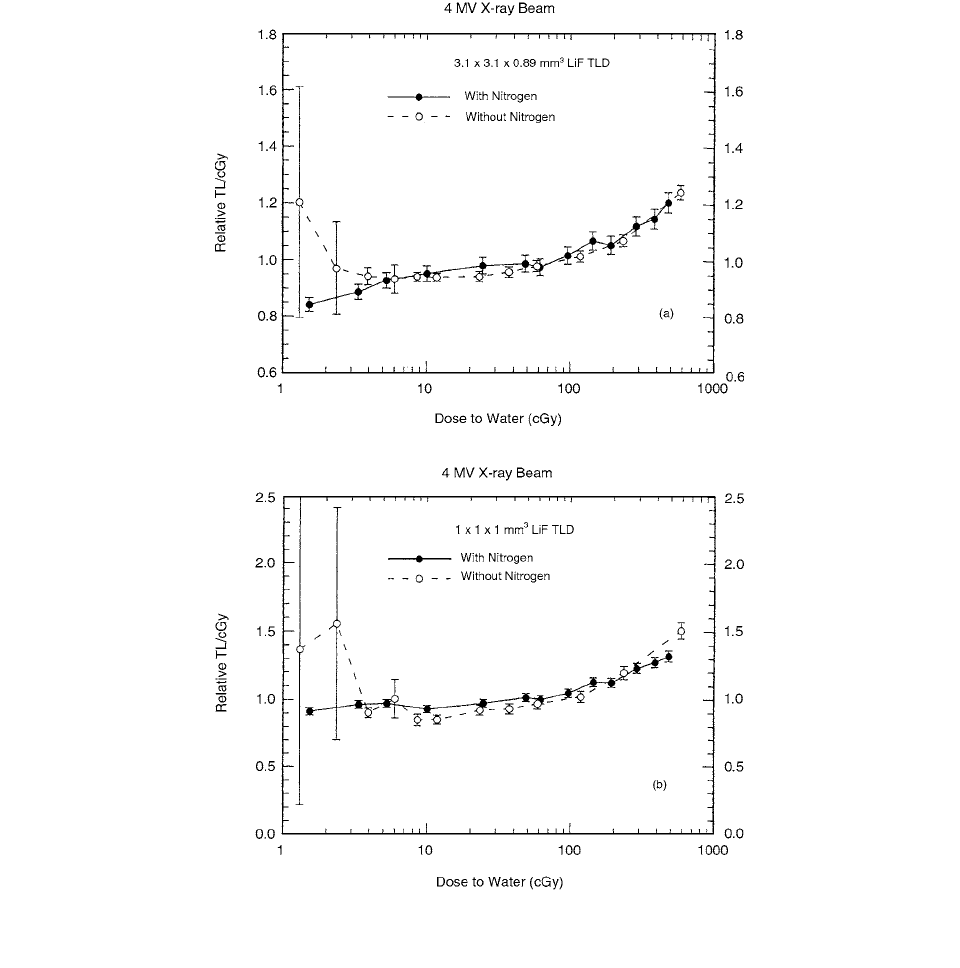
FIGURE 4.37 Effect of nitrogen gas flow on the linearity of large (a) and small (b) LiF TLD. The relative sensitivity is defined as
the ratio of the sensitivity (TL/cGy) for a given dose to the sensitivity for 50 Gy. (From Reference [20]. With permission.)
Ch-04.fm Page 251 Friday, November 10, 2000 12:01 PM
252 Radiation Dosimetry: Instrumentation and Methods
the first-order TL kinetics model according to the “Podgor-
sak approximation” method (Equation (4.22)). [25]
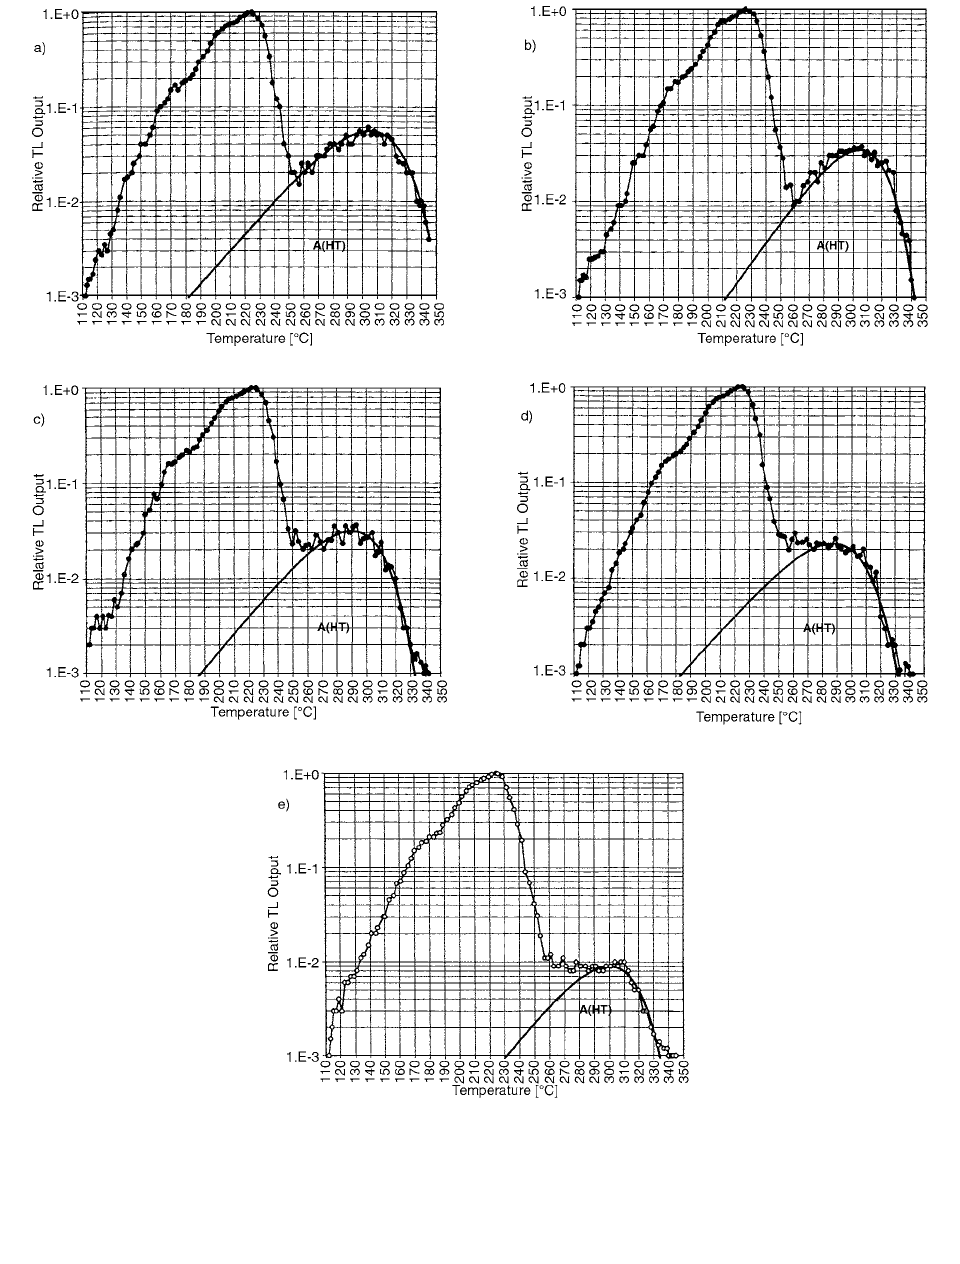
All glow curves were normalized to the highest peak
height at T
m
220°C (Figure 4.41). It is apparent that the
area under the deconvoluted high-temperature glow peak,
A(HT), increases with the average neutron energy. It is
evident that the high-temperature (300°C) peak of TLD-
700 dosimeters is sensitive to gamma-rays as well, but to a
lesser extent than to fast neutrons.
III. LIF:Mg, Cu, P DOSIMETER
The development of high sensitivity TLD by doping LiF crys-
tals with Mg, Cu, and P was first done by Nakajima et al. [25]
The sensitivity of the new TLD was more than 20 times
higher than that of LiF:Mg,Ti. Wu et al. [26] showed that
LiF:Mg,Cu,P (LiF(MCP) maintains its sensitivity during
prepared reuse cycles. The TL characteristics of
LiF:Mg,Cu,P include, in addition to high sensitivity, almost
flat photon energy response, low fading rate, and linear dose
response. The sensitivity and glow-curve shape are both
dependent on the maximum readout temperature and the
pre-irradiation annealing parameters. Short low-tempera-
ture annealing of 165°C for 10 s prior to readout is capable
of removing most of the low-temperature peaks. As a result,
there is very little fading up to two months or more at room
temperature. High-temperature annealing at 400°C results
in irreversable elimination of the main dosimetric peak and
causes some increase in the high-temperature peaks.
Advantages of LiF:Mg,Cu,P include high sensitivity
as compared to LiF:Mg,Ti, almost flat photon energy
response, low fading rate, and linear dose response. The
lack of supralinearity at higher dose levels is particularly
useful for accident dosimetry and eliminates the source of
error usually associated with the application of supralin-
earity corrections. The main drawbacks are still the rela-
tively high residual signal and the loss of sensitivity for
high-readout temperatures. LiF:Mg,Cu,P is interesting in
low-dose measurements due to its high sensitivity and its
good tissue equivalence.
The glow curve of LiF(MCP) consists of several over-
lapping glow peaks. The main peak at approximately
220°C, known as peak 4, is the one used for dosimetry
applications (the “dosimetric peak”). The rest of the glow
curve consists of a low-temperature part in the range of
approximately 70–160°C (peaks 1, 2, and 3), and a high-
temperature peak at approximately 300°C (peak 5). There
is evidence that the glow curve of this material is even
more complicated where peaks 4 and 5 are each composed
of two overlapping peaks.
The high sensitivity, combined with its tissue equiv-
alence, is the main advantage of this material in per-
sonal dosimetry applications. The sensitivity of
LiF(MCP) is approximately 25 times higher than that
of LiF:Mg,Ti (TLD-100). It is important to note, how-
ever, that the measured sensitivity depends not only on
the TL properties of the material itself, but also on the
spectral response of the light detection system. Both
LiF(MCP) and LiF:Mg,Ti have the same effective
atomic number (8.2) and could therefore be expected
to have a similar photon energy response in reality. The
over-response of LiF:Mg,Ti at 30 keV is approximately
35% (relative to 662 keV), as compared to only 6% for
LiF(MCP).
The sensitivity of LiF:Mg,Cu,P was studied by Furetta
et al. [27] as a function of the annealing temperature and
of the repeated cycles of annealing-irradiation-readout. A
fading study was carried out over a period of 40 days with
the purpose of checking the stability of the stored dosim-
etric information as a function of different annealing tem-
peratures. 10 LiF:Mg,Cu,P phosphors were cycled 10
times according to the following sequence: annealing, irra-
diation, readout.
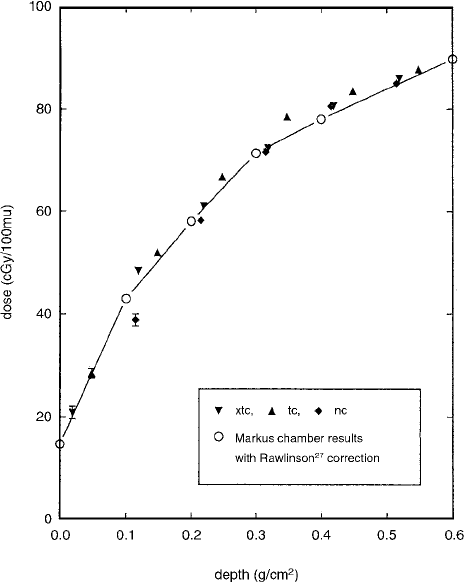
FIGURE 4.38 Dose build-up in solid water for a 6-MV x-ray
beam, field size 10
10 cm
2
. Three TLD chips of different
thicknesses (nominal thickness nc: 0.89 mm, tc: 0.39 mm, and
xtc: 0.14 mm) were placed at different depths in solid water. The
thickness of the chips was taken into account, assuming the
active center of the chip to be in its physical center. Error bars
show the range of uncertainty (
2 SD) for the first chip of each
type. (From Reference [21]. With permission.)
Ch-04.fm Page 252 Friday, November 10, 2000 12:01 PM
Thermoluminescent Dosimetry 253
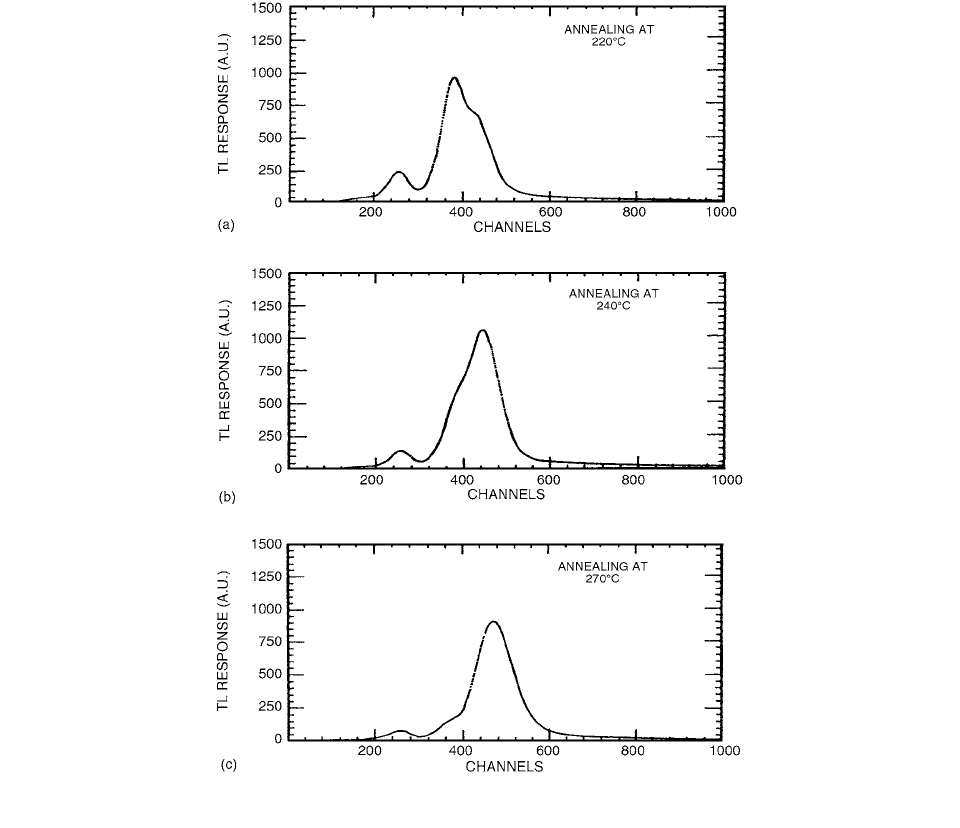
Figure 4.42 shows the TL emissions obtained after
various thermal procedures. Figure 4.42a (annealing at
220°C) displays the dominance of peak 3 over peak 4,
which appears as a shoulder on the descending part of
peak 3. At 240°C (Figure 4.42b), the TL emission appears
as usually observed: peak 4 becomes the main peak and
peak 3 is now a shoulder on the ascending side of the
fourth peak. For temperatures larger than 240°C, peak 3
tends to become smaller and smaller, so that the main
peak becomes narrower (Figure 4.42c, at 270°C). It was
noted that the shape of the TL emission, through the 10
repeated cycles, remains unchanged for each tempera-
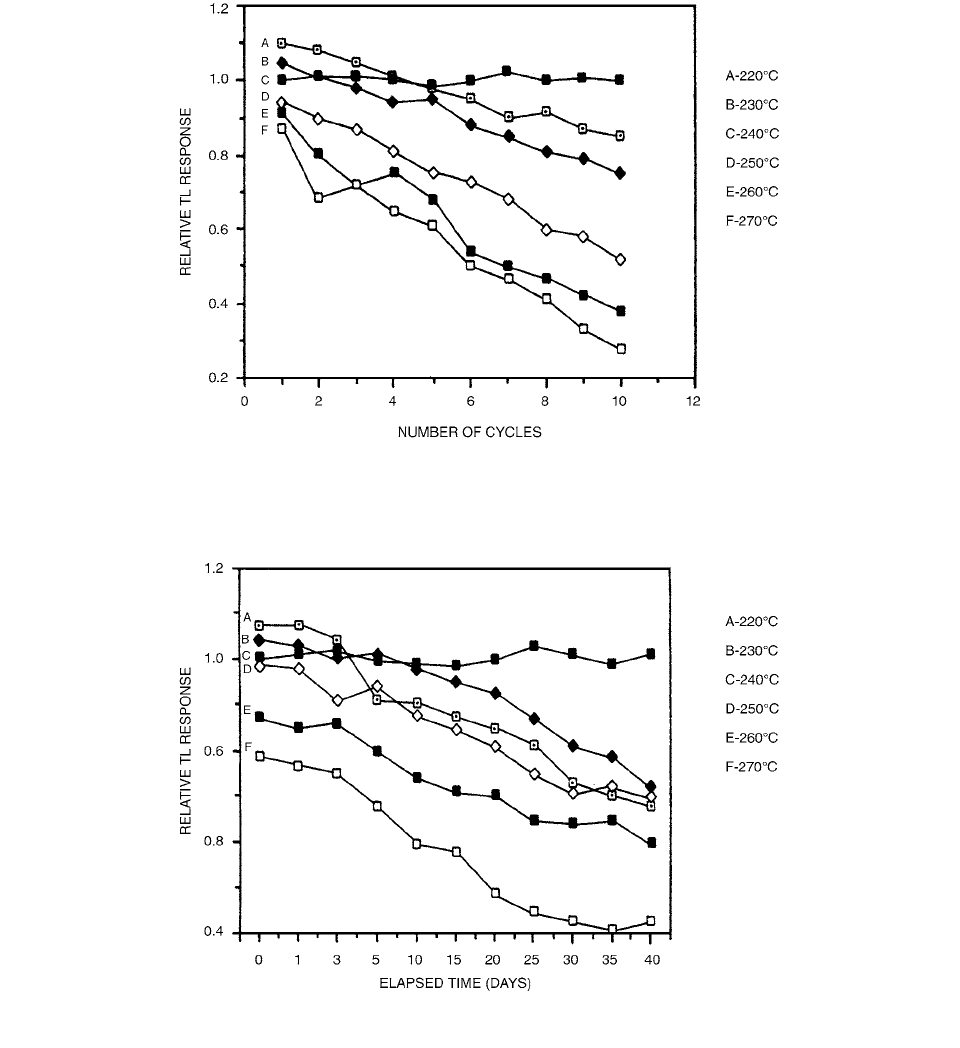
ture. The plots of the peak 3 and 4 TL integrals, for each
temperature and as a function of the repeated cycles, are
reported in Figure. 4.43. The TL responses were normal-
ized to that relative to the first cycle, at 240°C. The best
reproducibility is obtained at 240°C. At the beginning,
the TL emission at 220 and 230°C is a little larger than
at 240°C, but in the next cycles, the decrease of the TL
is obvious and reaches the 30% level in the tenth cycle
at 230°C. The situation is worst for temperatures larger
than 240°C. Temperatures higher than 240°C could
produce a sort of trap disactivation which increases
with the number of cycles. In this sense, a high anneal-
ing temperature ( 240°C) seems to produce a progres-
sive quench of the TL emission.
Figure 4.44 shows the plots obtained in a fading exper-
iment over 40 days of storage. All the results are normalized
to the TL response of peaks 34 obtained after annealing
at 240°C for “zero” days (reference value). The stability of
the TL response is perfect at 240°C annealing, while a
decrease is observed at any other temperatures. It is obvious
that the trap stability is compromised at temperatures differ-
ent from the reference value. The maximum loss is observed
after 40 days for the group initially annealed at 270°C: the
remaining TL is only 43% of the reference TL value.
The response of LiF:Mg,Cu,P thermoluminescence
dosimeters to high-energy electron beams used in radio-
therapy was investigated by Bartolotta et al. [28] They
found that LiF:Mg,Cu,P phosphor is a suitable candidate
for quality control of in vivo dosimetry in electron-beam
therapy. The TL chips (4.5 mm in diameter, 0.8 mm thick)
used were produced by Radiation Detector Works
(Beijing) and are commercially known as GR-200A.
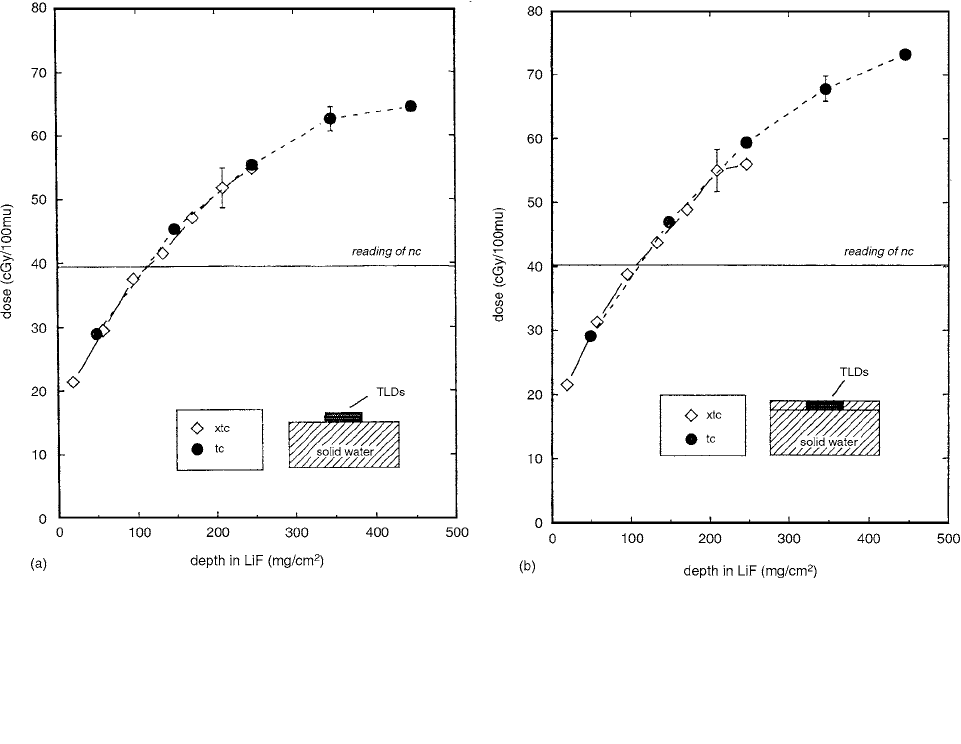
FIGURE 4.39 (a) Dose buildup in LiF as determined with extra-thin (xtc) and thin (tc) TLD chips stacked on top of each other on
the surface solid water. The depth is given as the physical depth of the center of each chip. The reading of a single normal TLD chip
(nc) placed on the surface is indicated by a horizontal line. (b) Dose build-up in LiF as determined with extra-thin (xtc) and thin (tc) TLD
chips stacked on top of each other in solid water. The highest chip is Bush with the solid water surface. The depth is given as the physical
depth of the center of each chip. The reading of a single normal TLD chip (nc) at the surface is indicated by horizontal line. (From Reference
[21]. With permission.)
Ch-04.fm Page 253 Friday, November 10, 2000 12:01 PM
254 Radiation Dosimetry: Instrumentation and Methods
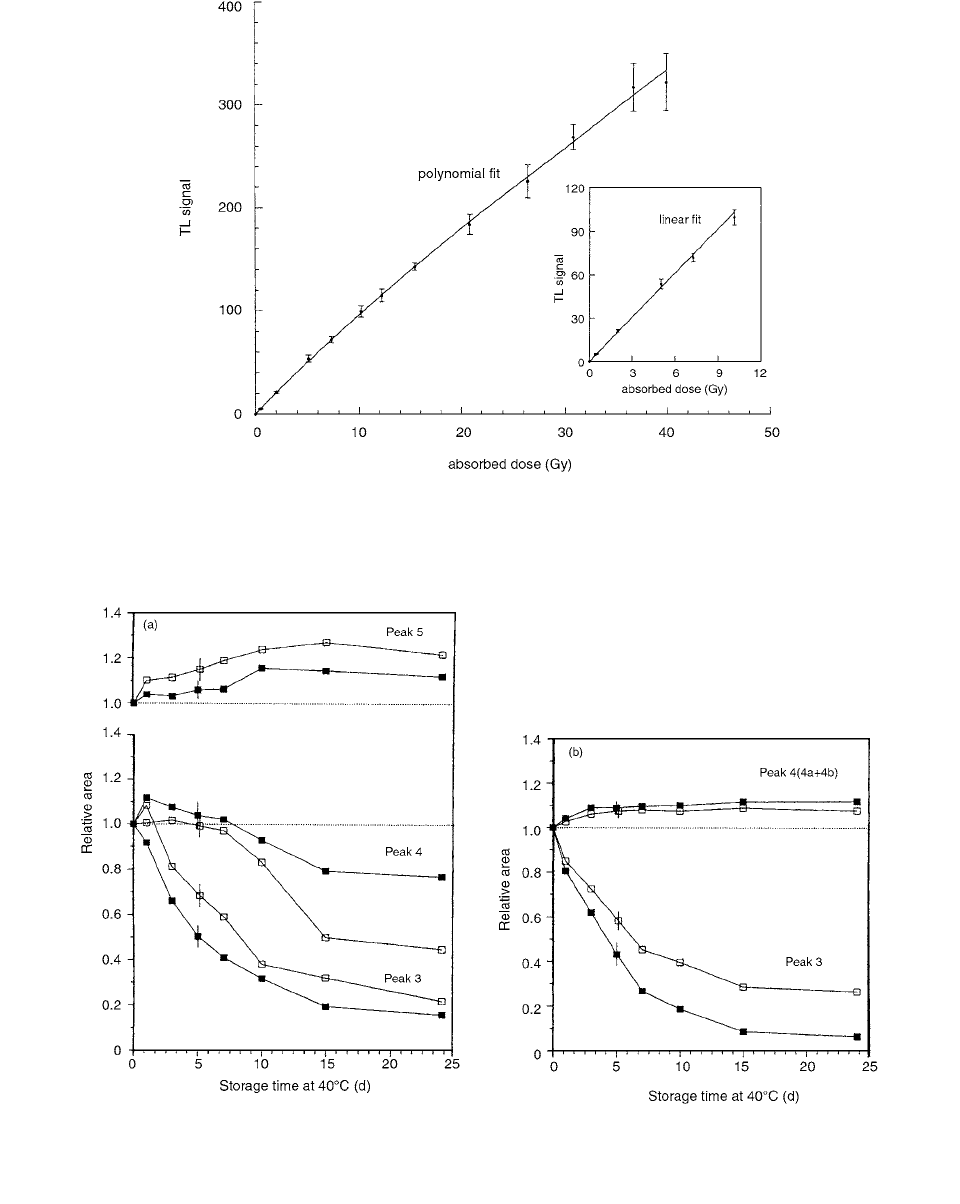
Figure 4.45 shows the TL signal of the GR-200A
dosimeters vs. absorbed dose in the entire investigated
dose range. Each data point corresponds to the mean
of nine readings. The error bars represent the overall
uncertainty of the mean to a level of confidence of
95%.
The sensitivity of GR-200A dosimeters to electrons was
found to be about 13% less than that of
60
Co gamma-rays,
in agreement with similar results already known for
LiF:Mg,Ti (TLD-100) dosimeters. Variance analysis of the
data showed the dependence on electron-beam energy rela-
tive to each other to be nil or buried under the measurement
uncertainty. When used for dose measurements in high-
energy electron beams, it is adequate to calibrate the
LiF:Mg,Cu,P dosimeters with any one electron-beam energy
without need for energy correction, but if they are calibrated
with a
60
Co beam, an appropriate energy correction must be
applied.
Mailed dosimetry for radiotherapy is one of the most
demanding applications of thermoluminescence dosime-
try (TLD). Ideally, the uncertainty of a mailed system
should be comparable to that of the ionometric methods
employed for the calibration of the radiation beams, i.e.,
around 1% (1
), and certainly lower than 5%. [29]
The simple dose dependence of GR-200 is in con-
trast to the supralinear dependence of TLD-100. The
proportionality between TL and dose found for GR-200
is in favor of this material, as calibration can be sim-
plified requiring fewer calibration points than with
TLD-100.
Very good reproducibility was found for the individ-
ual sensitivity factor of every dosimeter. Throughout the
experiment and for 20 groups of dosimeters, the worst
value found for the standard deviation of 10 determina-
tions of the individual sensitivity factor of a dosimeter was
0.65%. Values of 0.2–0.4% were the most frequent.
Sets of dosimeters were stored at room temperature
(18–24°C) for periods of 7, 15, 30, and 60 days. Every
set was composed of three groups of five GR-200 dosim-
eters irradiated to a dose of 2 Gy at different points of the
storage—at the beginning, in the middle, and at the end,
designated SA (storage after irradiation), M, and SB (stor-
age before irradiation), respectively. [29] Peak 4, the main
peak in the GR-200 glow curve, increases in intensity
during the first days of storage, stabilizing afterwards.
Peak 3, a weak peak, decreases monotonically with time
at room temperature. The evolution of the peaks reveals
that peak 4 experiences mainly trap effects, leading to an
increase in the number of traps available after storage.
Peak 3 presents the two effects, trap effect (decreasing the
number of traps) and fading. A clear anticorrelation was
observed in the evolution of peaks 3 and 4, rendering the
sum of these two peaks a more constant dose estimator
than peak 4 alone for delayed measurements. Taking these
two peaks together, the response change is limited to only
2–4% relative to the prompt sensitivity.
An investigation of the thermal stability of LiF:Mg,
Cu,P (GR-200) compared to the more traditional LiF:Mg,
Ti (TLD-100) at 40°C and 70°C was presented by Alves
et al. [30] Samples of both varieties of dosimeters were
stored irradiated or un-irradiated in order to evaluate the
relative importance of the temperature/storage-induced
effects on either traps or trapped charges. The measured
glow curves were analyzed using the deconvolution pro-
grams developed at CIEMAT. These techniques allow the
detailed characterization of the evolution pattern followed
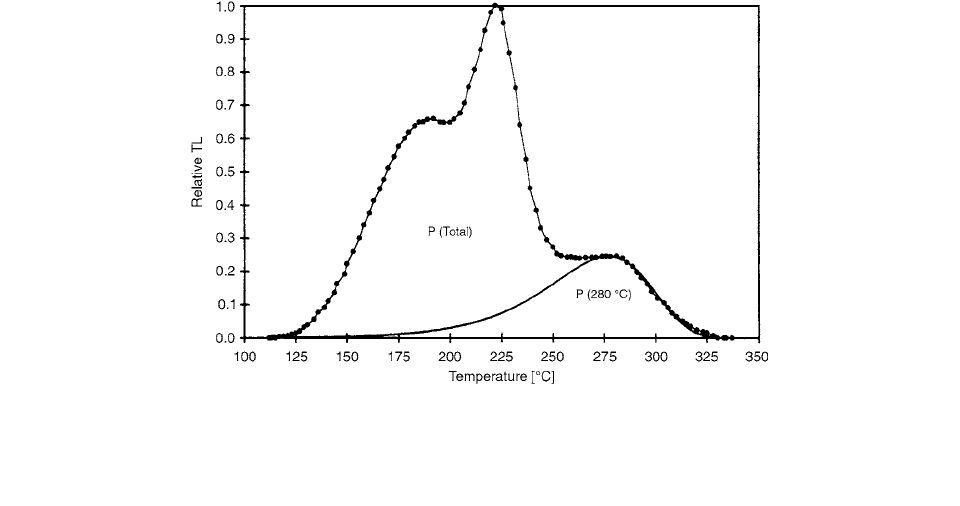
FIGURE 4.40 The glow curve of a TLD-600 chip irradiated with non-degraded alpha particles (E
a
5.5 MeV) from a 560-Bq
241
Am source. The glow curve was recorded with a data logger at a sampling rate of 2 readings per second. The high temperature
peak
P(280°C) was deconvoluted using the “Podgorsak approximation” of the first-order TL kinetics model. (From Reference [22].
With permission.)
Ch-04.fm Page 254 Friday, November 10, 2000 12:01 PM
Thermoluminescent Dosimetry 255
FIGURE 4.41 Glow curves of TLD-700 dosimeter encapsulated in cadmium box and irradiated by fast neutrons with average energy
of 5.1 MeV (a), 4.0 MeV (b), 3.2 MeV (c), and 1.9 MeV (d), as well as 662-keV gamma-rays (e) from a
137
Cs source. Each data
point represents the average value of thermoluminescence output from five readouts from the same TLD chips at a particular
temperature. The high-temperature (250–340°C) region of the glow curve was deconvoluted using the ‘‘Podgorsak approximation”
of the first-order TL kinetics model. The glow curves are normalized to the highest value of the TL output at
T 220°C. The area
under the deconvoluted peak is represented by
A(HT). (From Reference [24]. With permission.)
Ch-04.fm Page 255 Friday, November 10, 2000 12:01 PM
256 Radiation Dosimetry: Instrumentation and Methods
by each individual peak during the experiment. The results
contained confirm that, for both varieties of LiF phosphor,
the process affecting their respective main dosimetric
peaks is not lading, understood as the spontaneous release
of trapped charges. On the contrary, the observed varia-
tions in the TL response should be addressed to the mod-
ifications experienced by the trap system during storage.
However, some slight differences between the evolution
of TLD-100 and GR-200 have been found in this compar-
ison. [30]
The decrease of the TL yield observed after exposure
periods to environmental radiation has been traditionally
interpreted as due to the spontaneous leakage of trapped
charges, usually called Randall-Wilkins fading.
The reading cycles used were linear at 7°C s
1
in a N
2
atmosphere up to 300°C for TLD-100 and, in the case of
GR-200, up to a maximum temperature placed 10°C above
the detected position of peak 4. Once reached (around 240°C),
this temperature was maintained for 5 s. In this way, better
reproducibility with GR-200 has been consistently
obtained, reducing the tendency of this material to decrease
in sensitivity with reuse to almost negligible levels. Natural
cooling down inside the reader was always allowed, mean-
ing a rather rapid and reproducible cooling. No additional
annealing other than the readout itself was employed
before reuse with both materials.
Figure 4.46 presents the evolution with storage time
at 40°C of the relative areas of each individual peak, TLD-
100 on the left-hand side and GR-200 on the right-hand
side. Closed symbols represent the evolution of irradiated
dosimeters (SA, storage after irradiation) and open sym-
bols dosimeters stored un-irradiated (SB, storage before
irradiation). The peaks of TLD-100 (as those of GR-200)
present a different evolution with time. While the area of
peak 5 relative to the prompt area presents a slow tendency
to increase independently for irradiated and un-irradiated
dosimeters, the area of peak 4, after a small increase, starts
to diminish after the fifth day, reaching saturation in 15 days.
FIGURE 4.42 TL emissions obtained after various thermal procedures of annealing. (From Reference [27]. With permission.)
Ch-04.fm Page 256 Friday, November 10, 2000 12:01 PM
Thermoluminescent Dosimetry 257
Peak 3, on the contrary, decreases quickly from the first
day to the tenth and then mildly moves also to a saturation
level. In the case of GR-200, the area of peak 4 also shows
a slow tendency to increase from the beginning of the
experiment, whereas peak 3 diminishes even more quickly
than the corresponding peak 3 in TLD-100. Peak 4 seems
to reach a saturation level at approximately the same time
as peak 3 and also presents a softer decrease to a saturation
level.
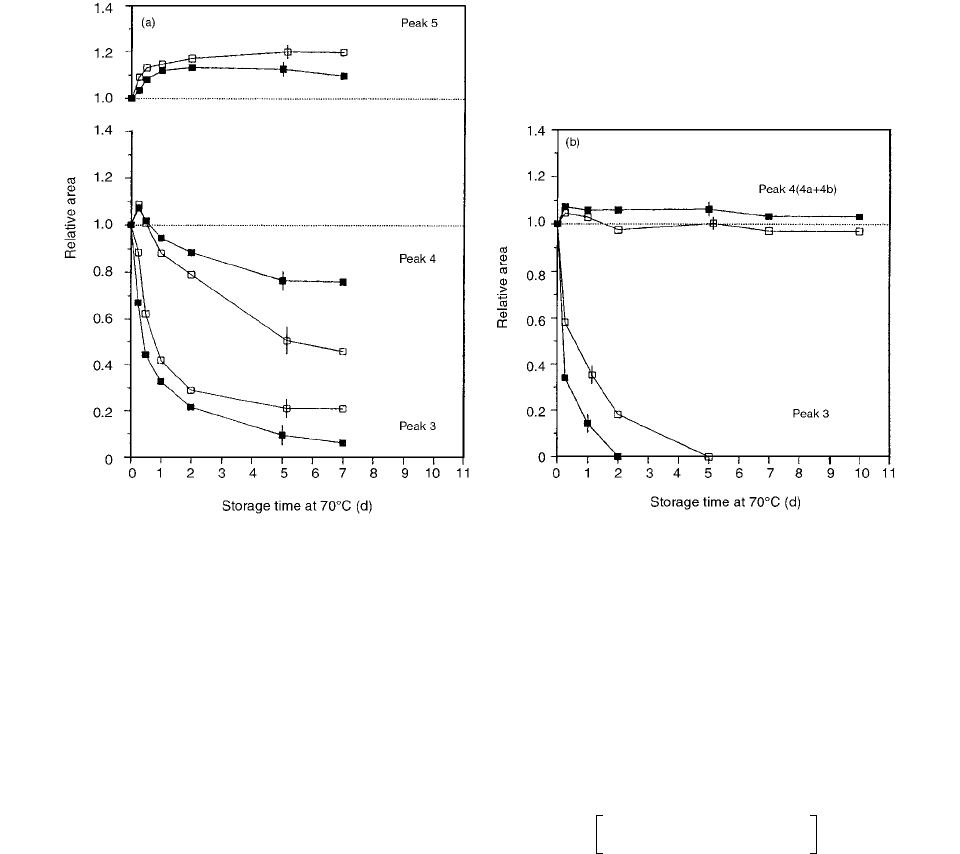
The same situation described for storage at 40°C occurs
at 70°C but on a shorter time scale; see Figure 4.47. Peak 5
in TLD-100 and peak 4 in GR-200 present an initial quick
rise, observed in the first few hours. Peak 4 in TLD-100 also
decreases more rapidly to a saturation level attained earlier
than at 40°C. The decrease of peak 3 in both LiFs is also far
more rapid than at 40°C, and in GR-200 no peak 3 is detected
after two days for SA detectors. This appears to prevent the
growth of peak 4, since as soon as peak 3 disappears, peak
FIGURE 4.43 Peak 3 and 4 TL integrals for each annealing temperature and as a function of repeated cycles. (From Reference [27].
With permission.)
FIGURE 4.44 Plots obtained in fading experiments over 40 days of storage. (From Reference [27]. With permission.)
Ch-04.fm Page 257 Friday, November 10, 2000 12:01 PM
258 Radiation Dosimetry: Instrumentation and Methods
4 seems to stabilize. For all the peaks studied, the same ordered
behavior for filled and empty traps is preserved at 70°C.
A fully automatic computer program for the decon-
volution of LiF:Mg, Cu, P glow curves was described
by Gomez Ros et al. [31] This program permits the sub-
traction of the residual contribution of the high-tempera-
ture peaks, producing the best fitted values for the kinetic
parameters and the areas of the dosimetric peaks.
FIGURE 4.45 The TL signal (arbitrary units) vs. absorbed dose for the GR-200A dosimeters irradiated with the 15-MeV electron
beam. The error bars represent the standard error (95% confidence level). The full line is the interpolation polynomial curve. The
inset shows the linear fit up to 10 Gy. (From Reference [28]. With permission.)
FIGURE 4.46 (a) Individual evolution of peaks 5, 4, and 3 of TLD-100. (b) Individual evolution of peaks 4(a b) and 3 of
GR-200 after different storage intervals at 40°C. Closed symbols represent storage after irradiation (SA) and open symbols
represent storage before irradiation (SB). Error bars are typical 3
values. (From Reference [30]. With permission.)
Ch-04.fm Page 258 Friday, November 10, 2000 12:01 PM
Thermoluminescent Dosimetry 259
Figure 4.48a presents some LiF:Mg,Cu,P glow curves
(ii) obtained with a linear/plateau heating profile (i),
together with the corresponding second readout measure-
ments (X10) (iii). Only peaks appearing during the linear
part of the heating cycle can be separated by glow-curve
fitting, but the contribution of the highest temperature signal
cannot be ignored, and it is one of the most important
problems in practical dosimetry with LiF:Mg,Cu,P, espe-
cially at low doses. A procedure to subtract the residual
signal is illustrated in Figure 4.48b, in which the residual
contribution of the high-temperature peaks to the region
where dosimetric peaks appear is approximated by a
straight line. This “linear background” is identified and
subtracted in each glow curve, producing a net TL curve
where the individual peaks can be fitted.
The analytical expression used to fit the glow peaks
depends on the kinetic model considered for the processes
involved. In the case of first-order kinetics the differential
equation describing the variation of the peak intensity I(t)
with time is:
(4.24)
where
n(t) is the trapped charges density, E is the activa-
tion energy, s is the frequency factor, k is Boltzmann’s
constant, and T(t) is the temperature. The solution when
a linear heating profile
T(t)T
0
t
is applied can be
written as:
(4.25)
where
T
M
and I
M
are the temperature and intensity of the
maximum, respectively, and E
2
is the second exponential
integral function defined as :
(4.26)
for positive values of z, in particular for z EkT
M
and z
E kT. Function E
2
(z) cannot be evaluated analytically, but
a very accurate rational approximation can be used for
arguments greater than 1 if we define the function
(4.27)
FIGURE 4.47 (a) Individual evolution of peaks 5, 4, and 3 of TLD-100. (b) Individual evolution of peaks 4(a b) and 3 of GR-
200 after different storage intervals at 70°C. Closed symbols represent storage after irradiation (SA) and open symbols represent
storage before irradiation (SB). Error bars are typical 3
values. (From Reference [30]. With permission.)
It()
nt()d
td
------------
s
E
kT t()
-------------
nt()exp
It() I
M
E
kT
M
----------
E
kT
------
E
kT
M
----------
E
kT
M
----------
exp
expexp
E
2
E
kT
M
----------
T
T
M
-------
E
2
E
kT
------
E
2
Z()
e
zt
t
2
---------
td
1
Z 0()
z() e
z
E
2
z()
1
a
0
a
1
za
2
z
2
a
3
z
3
z
4
b
0
b
1
zb
2
z
2
b
3
z
3
z
4
---------------------------------------------------------------------
z()
Ch-04.fm Page 259 Friday, November 10, 2000 12:01 PM