Shani G. Radiation Dosimetry: Instrumentation and Methods
Подождите немного. Документ загружается.

230 Radiation Dosimetry: Instrumentation and Methods
for 20-MeV electron beams. Differences in the energy cor-
rection factors between rods and chips of the same thickness
were negligible. The energy correction factors changed by
up to 4% for irradiation of TLD at depths other than at d
max
for a 5-MeV mono-energetic electron beam.
The energy correction factor is defined as
(4.12)
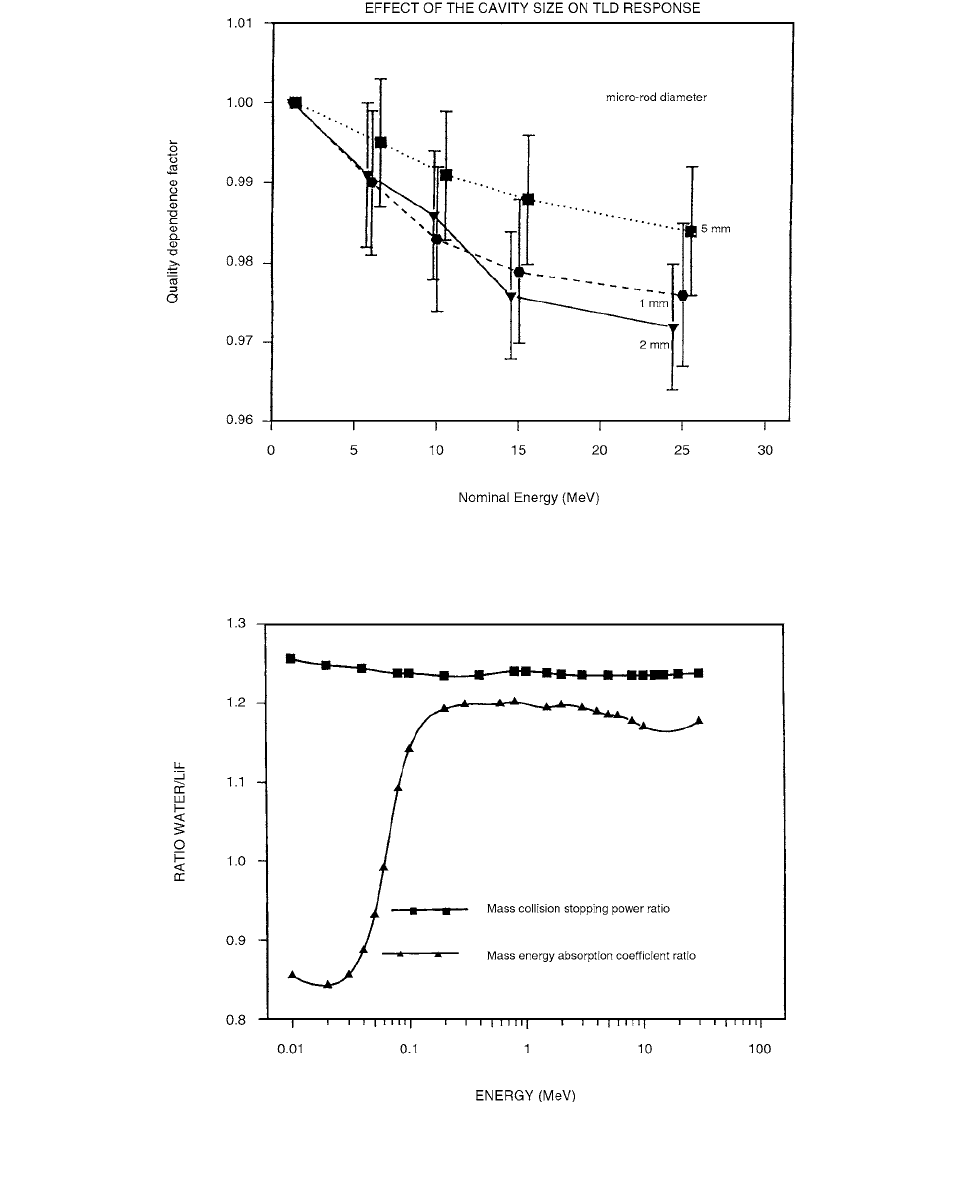
FIGURE 4.8 Quality dependence of LiF TLD rods of different diameter calculated by Monte Carlo simulations. (From Reference [5].
With permission.)
FIGURE 4.9 Variation with energy of the mass energy–absorption coefficient and the mass collision stopping power ratio of water
to LiF. (From Reference [5]. With permission.)
f
Co
E
TL Co()/D
med
Co()
TL E()D
med
E()
---------------------------------------------
Ch-04.fm Page 230 Friday, November 10, 2000 12:01 PM
Thermoluminescent Dosimetry 231
which is the ratio of the light output (TL) per unit dose
in the medium for
60
Co
-rays to the light output per unit
dose in the medium for an electron beam energy (E). If
is the average dose to LiF TLD material and assuming
that is directly proportional to the light output TL(E)
at any E, then
(4.13)
The energy correction factor can be used to determine
the dose as follows:
(4.14)
The quality-dependence factor is .
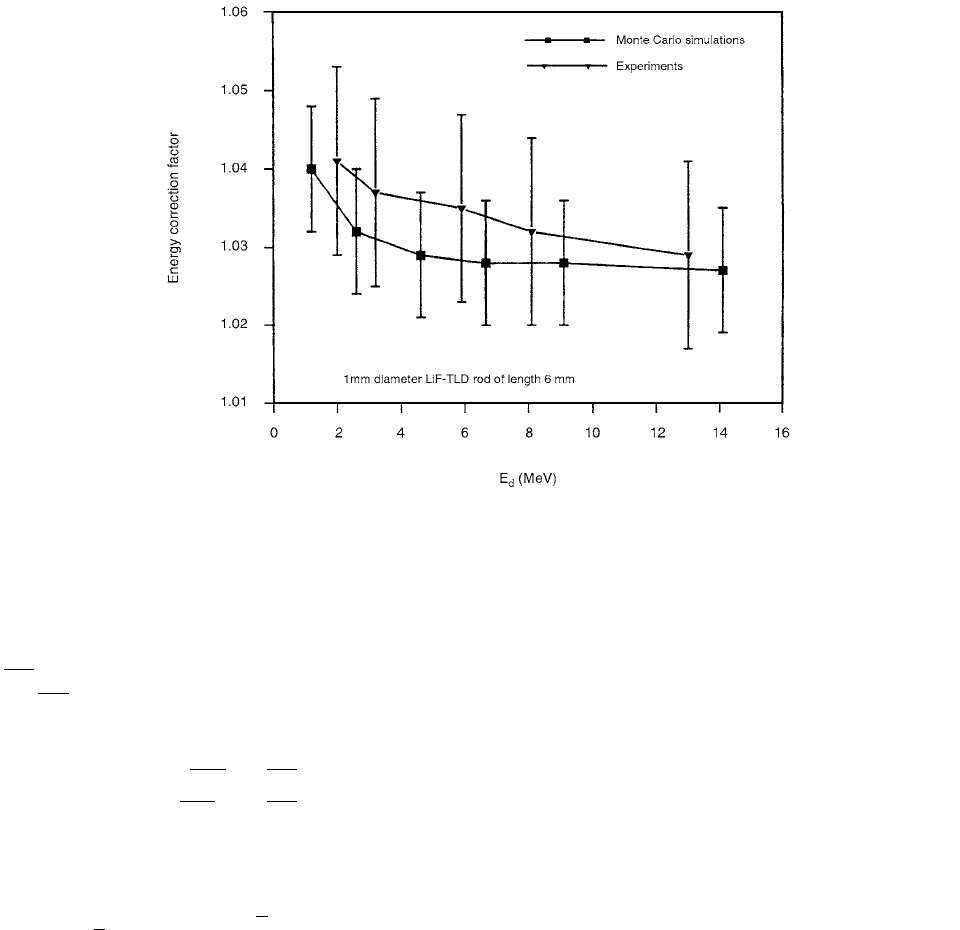
Figure 4.10 shows the comparison of the energy cor-
rection factor determined by experiments and Monte Carlo
simulations. There is agreement between experiments and
Monte Carlo simulations within 1.3% .
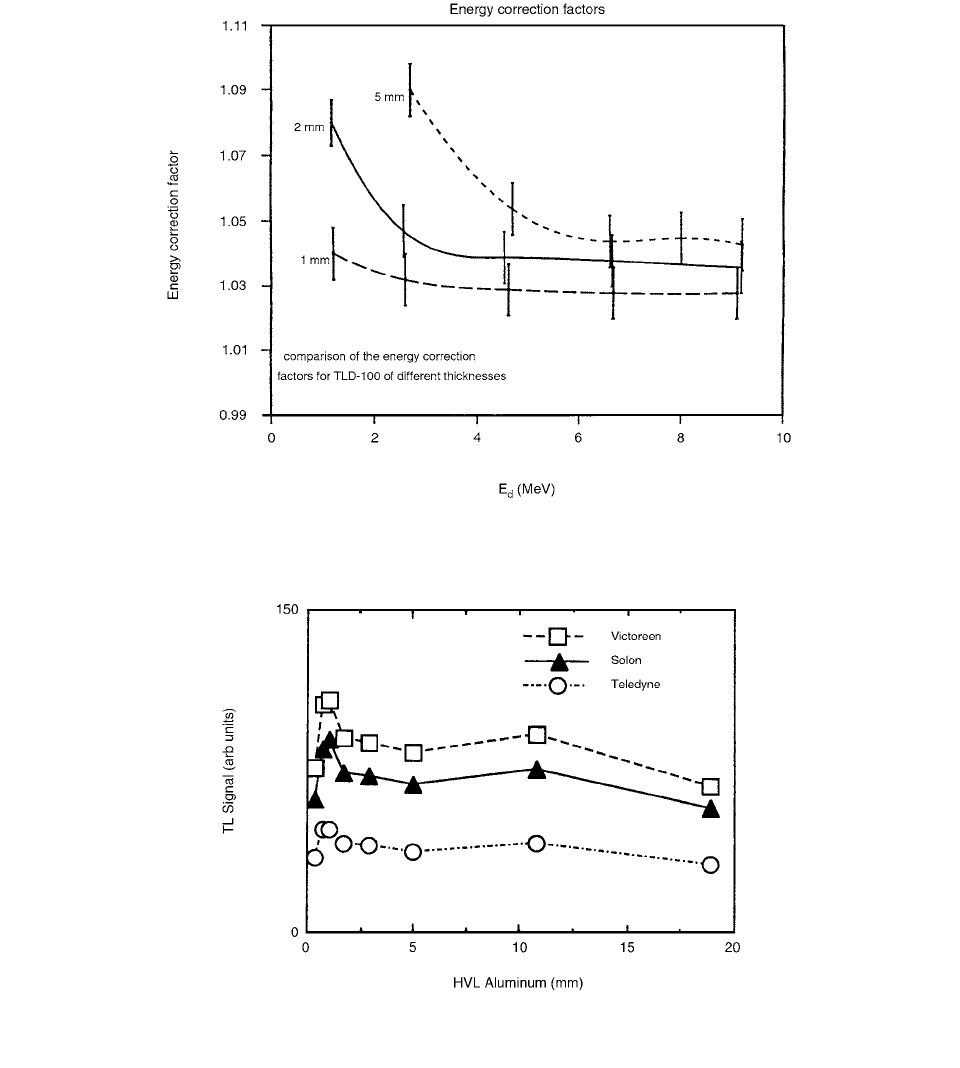
To investigate the effect of cavity size on the energy
correction factor, Monte Carlo simulations were carried out
with rods of diameter 1, 2, and 5 mm. Figure 4.11 shows
the results of these simulations. As the thickness of the rod
is increased, there is an increase in the energy correction
factor; that is, the deviation from unity increases. There is
an increase of about 2% in the energy correction factor of
2-mm diameter rods compared with that for 1-mm diameter
at high electron energy. At low energy this difference can
be up to 5%. There is a significant difference in the energy
correction factor curve among the 1, 2, and 5-mm diameter
rods over the entire energy range.
Thermoluminescent characteristics of LiF:Mg,Ti from
three manufacturers were compared by Fairbanks and
DeWerd. [7] All were chips of size 3 mm
3 mm 1 mm.
Fifty TLDs of this material were obtained from each of
the three manufacturers, Solon Technologies, Inc. (Solon),
Victoreen, Inc. (Victoreen), and Teledyne Isotopes (Tele-
dyne). The TLDs were compared on the basis of their
precision, sensitivity, thermoluminescent (TL) signal as a
function of energy, and linearity of TL signal as a function
of exposure.
The Solon and Victoreen chips provided good overall
standard deviations, 7.9% and 7.0%, respectively. But the
Teledyne standard deviation was nearly twice that of the
others, 13.8%. The annealing procedure causes a further
spread in the TL signals from a given set of chips, and
because an anneal was initially performed, the Solon and
Victoreen chips may have been within the mentioned spec-
ifications.
All groups showed an over-response at low energies
followed by a flat response at higher energies, as shown
in Figure 4.12a. The TL signal values have been normal-
ized to remove sensitivity differences and show the cor-
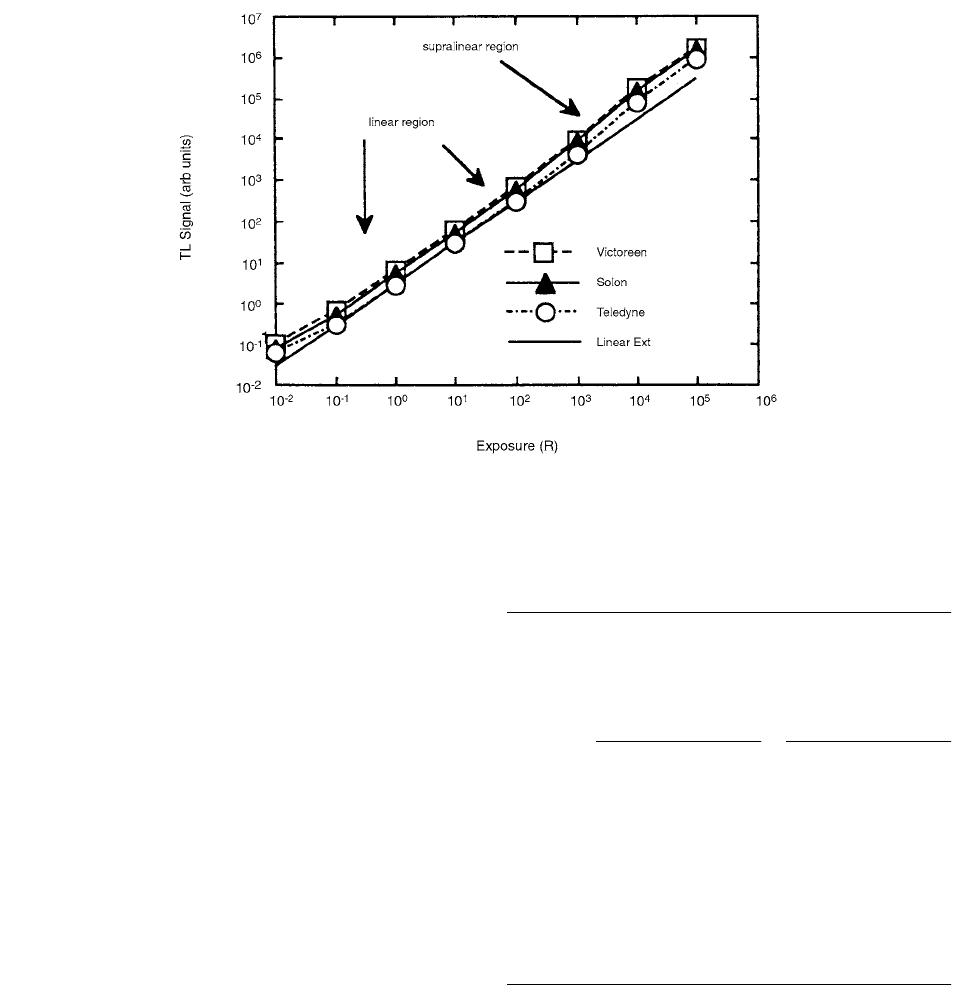
respondence among the manufacturers. Figure 4.13 shows
TL signal as a function of exposure.
The dose response of LiF:Mg,Ti (TLD-100) exposed to
15 and 35 kVp (8.0 0.1 and 8.1 0.1 keV effective energy,
respectively) x-rays and
60
Co
-rays has been measured by
FIGURE 4.10 A comparison of Monte Carlo simulations and experimental determination of the energy correction factor of LiF
TLDs. (From Reference [6]. With permission.)
D
LiF
D
LiF
f
Co
E
D
med
E()D
LiF
E()()
(D
med
Co()D
LiF
Co())
-----------------------------------------------------
D
med
E() TL E()
D
med
Co()
TL Co()
-----------------------
f
Co
E
F
Co
E
1 f
Co
E
Ch-04.fm Page 231 Friday, November 10, 2000 12:01 PM
232 Radiation Dosimetry: Instrumentation and Methods
Gamboa-de Buen et al. [8] in the dose interval from
(1.25.4) 10
3
Gy for x-rays, and from 0.14 to 850 Gy for
-rays. In both cases the total TL signal and glow-curve peaks
3 to 9 show supralinearity. The supralinearity function f(D)
is similar for both x-ray beams, except for peak 8, where a
30% difference is observed.
Although the onset and degree of supralinearity in
the response of LiF:Mg,Ti to photons is dependent on
the batch material, the experimental conditions (heating
rate and annealing procedure), and the glow peak tem-
perature (McKeever et al. 1995), it has been established
that the degree of supralinearity increases when the pho-
ton energy increases . The supralinearity increases with
the glow peak temperature. Jain and Ganguly [9] have
reported a lower degree of supralinearity for peak 8 than
for peak 7.
The glow curves were deconvoluted into peaks 3 to
9 (see Figure 4.14a) with the Harshaw/Filtrol software
FIGURE 4.11 Energy correction factors of LiF TLD rods of different diameters calculated by Monte Carlo simulations. (From
Reference [6]. With permission.)
FIGURE 4.12 TL signal as a function of half-value layer (HVL) for each group of TLDs showing an over-response at low energies
and a flat response at higher energies. (From Reference [7]. With permission.)
Ch-04.fm Page 232 Friday, November 10, 2000 12:01 PM
Thermoluminescent Dosimetry 233
that uses the Podgorsak approximation to the Randall-
Wilkins first-order kinetics peak shape. In all deconvolu-
tions, the width of peaks 6 to 9 were kept constant (in
order to reduce the number of free parameters, since a
typical glow curve does not uniquely determine all 21
parameters which describe the 7 peaks) and the position
(temperature) and height of all peaks were adjusted in
each fit of the glow curves. In the deconvolution of the
x-ray glow curves, the width of peak 4 was also fixed.
Table 4.2 shows the average values and standard devia-
tions found for the deconvolution parameters. The area
under the glow curve, after background and peak 2 sub-
traction with the deconvolution software, will be referred
to as the total TL signal.
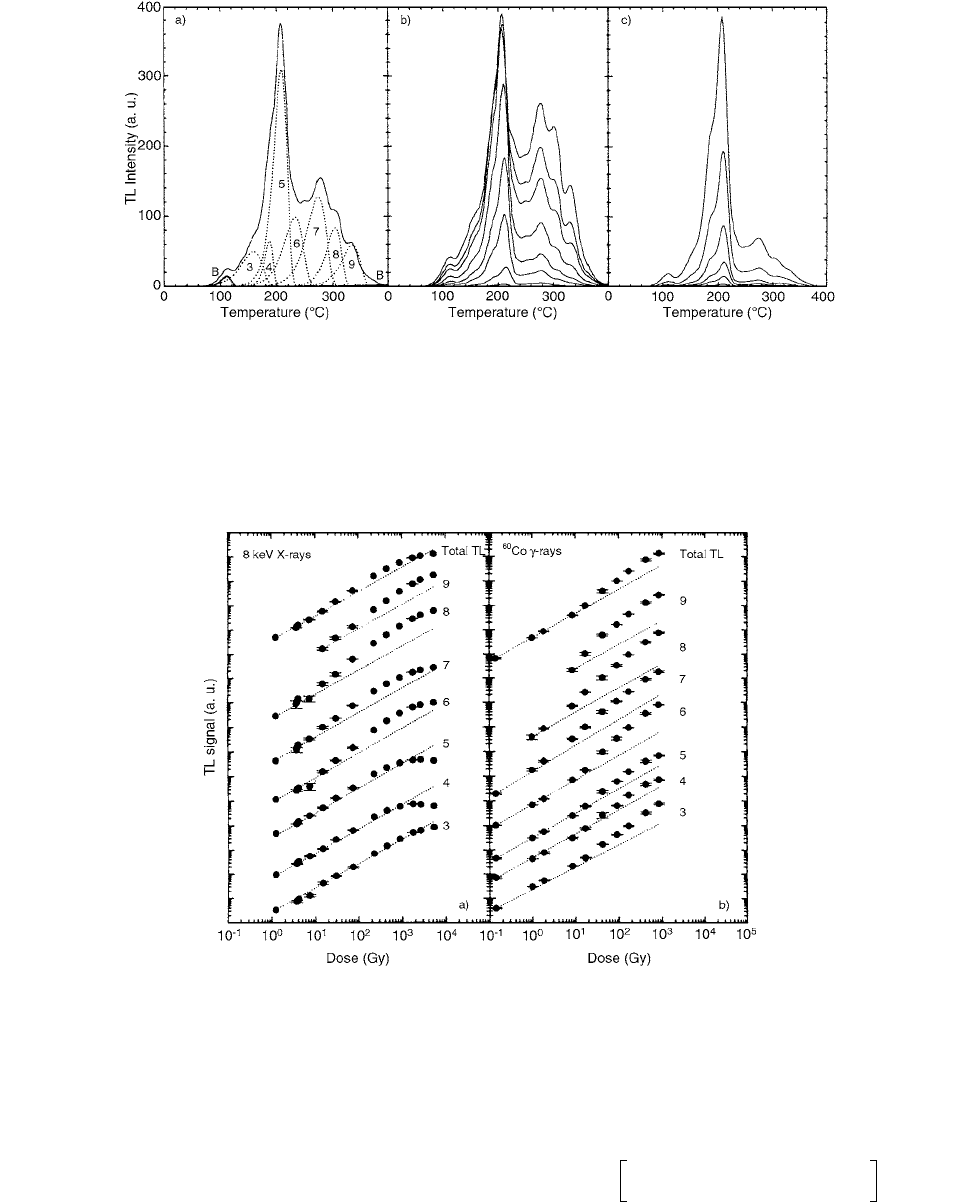
Figure 4.14a shows a glow curve after irradiation with
x-rays and its deconvolution into peaks 3 to 9. Figures 4-14b
and c show a series of glow curves for different doses after
x- and
-ray exposure, respectively. The curves have not
been normalized, and the evolution of their shape as a
function of the dose indicates a strong dose dependence
of the relative contributions from the individual peaks.
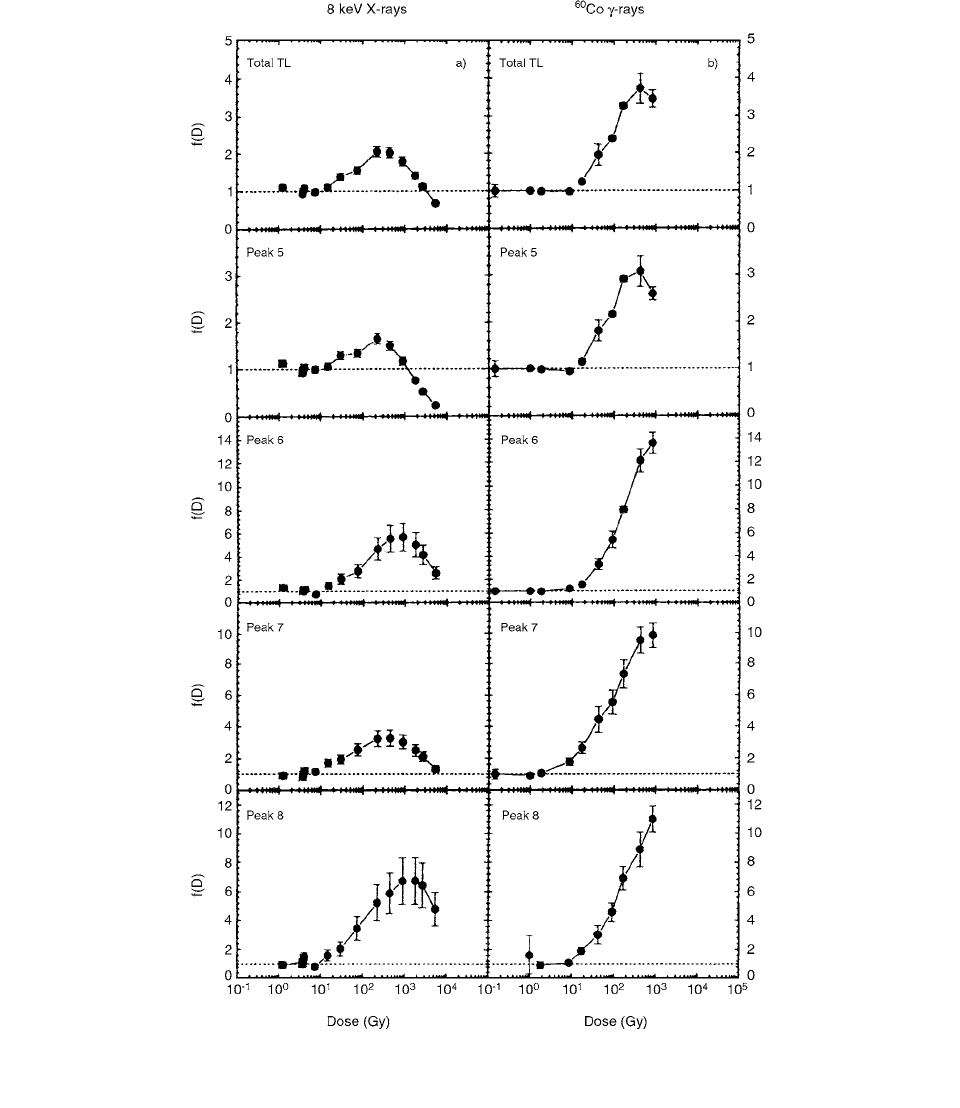
Figure 4.15 shows the TL response for the total TL signal
and individual peaks as a function of dose for both types
of radiation. In general, the response follows a linear-
supralinear-sublinear behavior.
The supralinearity function f(D), defined as
(4.15)
where F(D) is the TL signal per irradiated unit mass at
dose D, and D
0
is a low value of the dose such that F(D
0
)
is linear, has been calculated for the total TL signal and for
peaks 5 to 8, and it is shown for 8-keV x-rays in Figure 4.16a
and for
60
Co
-rays in Figure 4.16b.
The results of a series of experiments performed to
determine some fading characteristics of TLD-100 (Har-
shaw Chemical Co.) were presented by Vasilache et al.
The experiment was performed using two batches of
dosimeters that were irradiated with x-rays simultaneously
and with the same dose. The results indicated that, after
the low-temperature peaks had faded out, the response of
FIGURE 4.13 TL signal as a function of exposure, all three groups showing linearity between 100 mR and 100 R and supralinearity
thereafter. A linear extension is provided to make this more apparent. Nonlinearity below 100 mR may be attributed to uncertainty
in reader and chip noise. Cessation of supralinearity above 10,000 R may be the beginning of chip damage. (From Reference [7].
With permission.)
fD()
FF()D
FD
0
()D
0
------------------------
TABLE 4.2
Glow-Curve Deconvolution Parameters for 8.1-keV
x-rays (35 kVp) and
60
Co
-Rays
8.1 keV x-rays
60
Co
-rays
Peak
number
Temperature
(°C)
FWHM
(°C)
Temperature
(°C)
FWHM
(°C)
3 161 6 38 4 156 2 32 2
4 188 2 20.0 186 1 21 1
5 213 2 26 2 212 1 25 1
6 237 4 40.4 234 1 40.4
7 276 2 40.4 274 2 40.4
8 305 6 32.0 307 1 32.0
9 337 2 32.0 333 3 32.0
Source: From Reference [8]. With permission.
Ch-04.fm Page 233 Friday, November 10, 2000 12:01 PM
234 Radiation Dosimetry: Instrumentation and Methods
the dosimeters exposed to light became quite stable, with
a very low fading. The signal of the dosimeters kept away
from light continued to fade to a lower level than the signal
of the dosimeters exposed to light.
To analyze the evolution of each glow peak, the glow
curves were deconvoluted using an improved method of
gradients. To fit the experimental curves, the well-known
Podgorsak approximation of the Randall-Wilkins equation
was used:
(4.16)
along with the relationship between
and T
m
:
(4.17)
FIGURE 4.14 (a) TLD-100 glow curves after irradiation with x-rays at 1.8 10
3
Gy. Dotted curves show the deconvolution into
peaks 3 to 9. Peak 2 and the high-temperature emission (b) were subtracted from the measured glow curve by the deconvolution
software. (b)TLD-100 glow curves after irradiation with 8-keV x-rays for different doses. In increasing order: 1.5
10
1
, 7.4 10
1
,
2.3
10
2
, 4.5 10
2
, 8.9 10
2
, 1.8 10
3
, 2.7 10
3
, and 5.4 10
3
Gy. (c) TLD-100 glow curves after irradiation with
60
Co
-rays
at different doses. In increasing order: 1.7
10
1
, 4.3 10
1
, 9.2 10
1
, 1.7 10
2
, 4.3 10
2
, and 8.5 10
2
Gy. (From Reference [8].
With permission.)
FIGURE 4.15 Response curves of TLD-100 exposed to (a) 8-keV (35-kVp) x-rays and (b)
60
Co
-rays, for the total TL signal and
for peaks 3 to 9. The dotted lines correspond to linear responses. The measurements have been arbitrarily displaced for clarity. (From
Reference [8]. With permission.)
IT() I
m
1
TT
m
------------------
TT
m
------------------
expexp
s
T
m
()exp
Ch-04.fm Page 234 Friday, November 10, 2000 12:01 PM
Thermoluminescent Dosimetry 235
where I(T) is the peak intensity at the temperature T, I
m
is the intensity of the maximum, T
m
is the temperature of
the maximum,
is the heating rate, and s is the attempt
to escape frequency of the electrons in the traps. The full
width at half-maximum of the peak is given by:
(4.18)
where E is the depth of the energy trap and k is the Boltzman
constant.
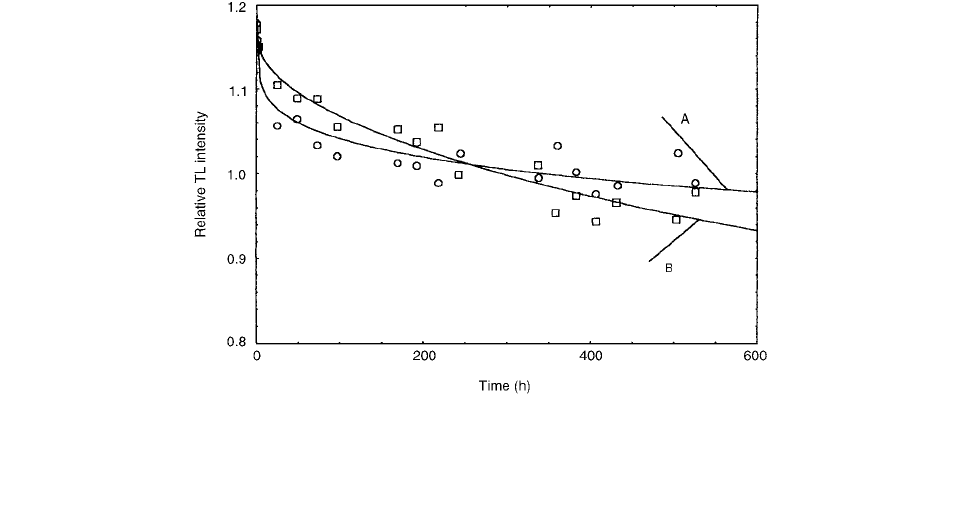
The results of the first experiment are presented in
Figure 4.17. The best fit led to the following two functions
for the fading factor: [10]
FIGURE 4.16 Supralinearity function f(D) of the total TL signal and peaks 5 to 8 of TLD-100 exposed to (a) 8 -keV (35-kVp)
x-rays and (b)
60
Co
-rays. Symbols show the measurements and curves as a guide to the eye. (From Reference [8]. With permission.)
kT
m
2
()E f
1
() 0.06
0.19
1.191
Ch-04.fm Page 235 Friday, November 10, 2000 12:01 PM
236 Radiation Dosimetry: Instrumentation and Methods
for the dosimeters that were exposed to light, and
for the dosimeters that were kept in the dark. In both cases,
the fading factor is given by f
i
(
) I(
)/I(
0), where
I(
) is the integral TL emission at the time
.
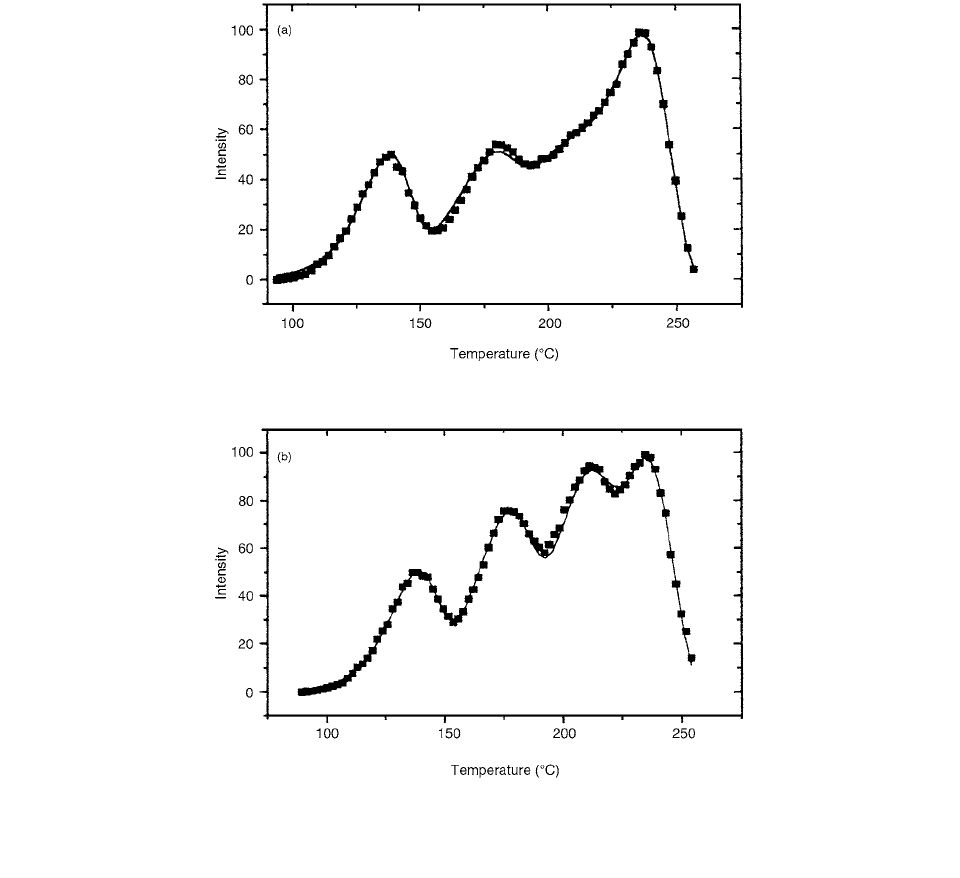
The second experiment (UV post-irradiation) led to a
drastic change in the shape of the TL glow curve after the
exposure to UV light, by comparison with the glow curve
of the TLD-100 detectors irradiated with x-rays only
(Figure 4.18a and b). As can be seen, peaks 4 and 5 are
now resolved and, furthermore, peak 5 now shows a higher
fading than peak 4.
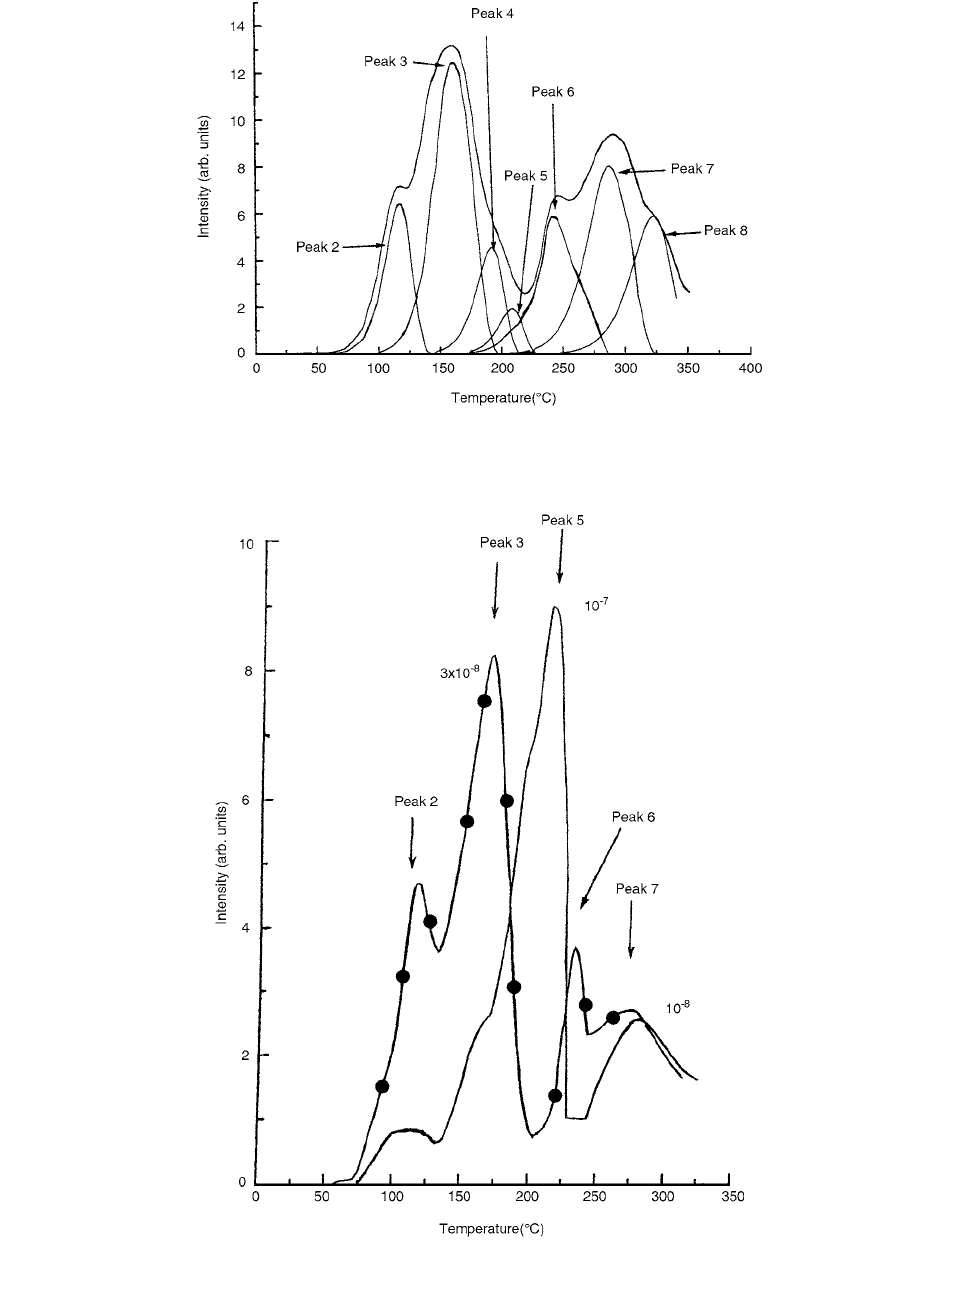
Pre-irradiation annealing treatment at 150°C reduces
the sensitivities of peak 4 (197°C) and peak 5 (209°C),
whereas the intensity of peak 2 (108°C) is enhanced. The
TL intensities of peak 7 (271°C) and peak 10 (441°C)
remain practically unaffected (Bhatt et al.). [11]
Figure 4.19 shows an example of a deconvoluted curve.
The area under each peak of the deconvoluted curves is
being used for the calculation of sensitization factors and
intensities.
Figure 4.20 shows a typical glow curve for virgin as
well as for 150°C, 6-h pre-irradiation annealed samples.
For 150°C, 6-h pretreated samples, the intensity of peak
2 increases by a factor of 1.82, whereas the intensity of
TL peak 5 is reduced by a factor of 36. Another TL peak
at 235°C (peak 6) appears due to this temperature treat-
ment. TL peaks 7 and 10 are affected only slightly by this
treatment.
It is seen that for the 150°C pre-annealing treatment,
both peaks 4 and 5 decrease, possibly due to precipitation
of phase 6 LiF:MgF
2
. It may be noted that optical bleach-
ing and thermal annealing investigations have shown con-
vincingly the interrelationship between TL peaks 4 and 5
and the 310-nm absorption band. Thus, the two peaks are
expected to behave in a similar fashion during the pre-
irradiation annealing treatment.
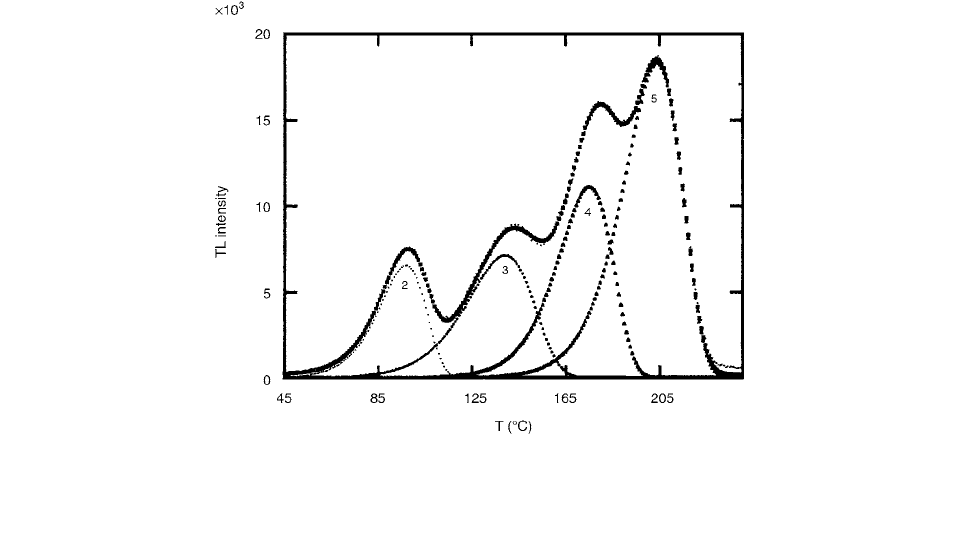
The glow-curve characteristics of a single a crystal
LiF:Mg,Ti, grown by the Bridgman method, were studied
by Weizman et al. [12] as a function of Ti concentration
(3–14 ppm Ti). The glow curves were deconvoluted into
component glow peaks using mixed-order (MO) model
kinetics. The TL sensitivities and activation energies of
the glow peaks were studied in both post-irradiation
annealed and unannealed samples. In glow curves follow-
ing a 165°C
15-min anneal to remove peaks 2–4, the acti-
vation energy of peak 5 was observed to increase from
1.65 0.1 eV at the lowest Ti concentrations to 1.9
0.1 eV from 8–14 ppm Ti concentration. Deconvolution
of the glow curve is shown in Figure 4.21.
The sensitivity of the various peaks (2–5) as a function
of Ti concentration is illustrated in Figure 4.22. The de-
pendence of the TL sensitivity of peak 5 on the square of
the Ti concentration would seem to indicate that the
TC/LC complex may be the result of the incorporation of
two Ti(OH)
n
or O complexes coupled independently to
two of the dipoles participating in the formation of the
Mg-Li
vac
trimer.
Thermoluminescence and optical absorption of
-ray-
and
-particle-irradiated LiF:Mg,Ti single crystals have
been studied by Bos et al. [13] The optical absorption
(OA) bands were measured during a heating regime which
FIGURE 4.17 The fading of the TL signal for TLD-100 detectors irradiated with bremsstrahlung x-rays. The continuous lines represent
the best fit for the two sets of experimental points. Line
A (), exposed to light, (ax
b
) C, error: 7.200 10
3
, a 6.151 10
2
, b
1.939 10
1
, C 1.191. Line B (), stored in darkness, a exp(cx
d
), error: 7.492 10
3
, a 1.162, b 7.326 10
3
, c
5.312 10
1
. (From Reference [10]. With permission.)
f
d
() 1.16 0.007
0.53
()exp
Ch-04.fm Page 236 Friday, November 10, 2000 12:01 PM
Thermoluminescent Dosimetry 237
mimics the glow-curve readout. This technique yields, in
principle, a more reliable correlation between glow peaks
and OA bands than the conventional procedure of sample-
annealing using the l
m
-l
stop
technique. Computerized anal-
ysis was used to resolve the OA spectra into Gaussian bands.
In f-irradiated samples, apart from the known 5.5-eV band,
a previously unnoticed 4.5-eV band has been recognized
which may be caused by defects that are active as com-
petitors in the recombination stage.
Optical absorption bands induced by ionizing radiation
arise due to changes in the trapping stage only, while a TL
glow curve is the result of both trapping and recombination
processes. Thermal treatments drastically alter the absorp-
tion bands. A commonly used technique to study the effects
of thermal treatments is to subject the sample to a pulse-
annealing sequence; i.e., the sample is heated to one tem-
perature, then cooled and measured, subsequently heated
a second time to a higher temperature, and so on. The record-
ing of the TL glow curve, however, is done by heating the
sample just one time without quenches and reheating in
between. In LiF:Mg,Ti there are many strongly overlap-
ping OA bands.
Figure 4.23 shows two thermoluminescence glow
curves of LiF:Mg,Ti after irradiation at room temperature
with 4.5-MeV and 30-keV
particles. The glow curves
(above 200°C) show great similarity, from which it is
concluded that in both cases the same trapping centers are
involved. This is plausible since the stopping powers do
not vary very much (7.4 eV for 4.5-MeV
particles and 5.8 eV for 30-keV
particles).
Figure 4.24 shows the optical absorption spectra of
LiF:Mg,Ti at different temperatures following irradiation
with gamma-rays and 30-keV
particles. The two radi-
ation qualities produce different spectra. At 50°C the OA
band at 5.0 eV (F center) is recognized. It is seen that
after
irradiation, the maximum of this band shifts to a
FIGURE 4.18 Glow curves for detectors irradiated only with x-rays (a) and exposed to UV after irradiation with x-rays (b). Both
detectors were read immediately after irradiation. The continuous line represents the best fit obtained by computerized glow-curve
deconvolution. (From Reference [10]. With permission.)
10
2
cm
2
g
1
10
2
cm
2
g
1
Ch-04.fm Page 237 Friday, November 10, 2000 12:01 PM
238 Radiation Dosimetry: Instrumentation and Methods
FIGURE 4.19 Typical deconvoluted TL glow curve for LiF TLD-100, annealed at 400°C for 1 h, followed by 150°C, 6-h treatment and
irradiated with 1 kGy at 77 K. The peak positions are numbered according to the usual nomenclature. (From Reference [11]. With permission.)
FIGURE 4.20 Typical TL glow curves for LiF TLD-100. Virgin ( — ) and 400°C for 1 h, followed by 150°C, 6-h pre-annealing
(-
-). The numbers 10
7
, 3 10
8
, etc. refer to the current ranges of the DC amplifier. (From Reference [11]. With permission.)
Ch-04.fm Page 238 Friday, November 10, 2000 12:01 PM
Thermoluminescent Dosimetry 239
lower energy. After
irradiation, the 4.50-and 5.54-eV
OA bands are not present; their absence suggests that
they are not active during x-irradiation and, therefore,
one can expect a linear behavior of OA bands as a func-
tion of dose.
Figure 4.25 displays the glow curves plotted for LiF
and its mixtures with Li
2
CO
3
(nonluminescent material).
The shape of the curve obtained for the composite mate-
rial applied for dosimetry coincides with that observed
for the thermoluminescent phosphor. However, the ther-
moluminescence output (i.e., the values of thermolumi-
nescence signal per unit of dose) appear to be somewhat
lower for mixtures due to the presence of additives to
phosphor.
Various LiF thermoluminescence dosimeters have been
investigated by Osvay and Deme [15] for selective assess-
ment of low and high LET radiation for space dosimetry
purposes. The aim of the investigations was to compare the
selectivity of the glow peaks of the Harshaw TLD-100, the
Polish LiF:Mg,Ti (type MTS-N) and the Austrian LiF-F
dosimeters using alpha, gamma, and thermalized neutron
radiations. Comparing TL responses using glow-curve
analysis of the peaks 4–5 (180–210°C) and on the high-
temperature peaks 6–7 (240–270°C) generated by high
LET radiation, it was found that separation of radiations
with different linear energy transfer (LET) was the most
promising in the case of Polish LiF:Mg,Ti (type MTS-N)
dosimeters.
Figure 4.26 shows the glow curves of TLD-100, LiF
(MTS-N) and LiF-F after 6-mGy gamma irradiation.
The gamma sensitivities were calculated from the mean
value of the TL responses. The sensitivity of LiF (MTS-
N) was found to be two and a half times higher compared
with TLD-100, and LiF-F was found to have nearly the
same sensitivity as TLD-100. The standard deviation of
dose readings for gamma-rays was about 5%.
The glow curves of TLD-100, LiF (MTS-N), and LiF-
F dosimeters irradiated by 24-mGy (volume-averaged)
alpha dose are shown in Figure 4.27. The glow curves
demonstrate the gamma sensitivity and the sensitivity to
5-MeV alpha particles of the LiF dosimeters investigated.
Comparing the TL responses, the following can be stated:
1. The glow peak of the gamma-irradiated LiF-F
single crystal dosimeter was found at a higher
temperature compared to TLD-100 and MTS-N
LiF dosimeters; the glow peak temperature of
LiF-F is about 240°C (Figure 4.26).
2. The effect of high LET alpha irradiation is con-
siderable for each type of dosimeter investi-
gated, but the qualitative change on the structure
of the glow curve was found to be the most
significant for the LiF (MTS-N) dosimeter.
3. The LiF-F crystal does not show an explicitly
high temperature peak using alpha irradiation
in the dose range 1–40 mGy.
Comparing the glow curves of Figure 4.28, the fol-
lowing can be stated. First, the main peak (peaks 4–5) is
shifted to lower temperature values for an initial irradia-
tion made by neutrons in comparison with the reversed
condition, i.e., with an initial gamma exposure. Second, in
addition to this effect, there is a reduction in TL response
for an initial irradiation with neutrons.
FIGURE 4.21 Deconvoluted glow curve of LiF:Mg,Ti containing 80 ppm Mg and 10 ppm Ti. Analysis of this particular glow curve
resulted in the following activation energies: peak 2 (1.3 eV), peak 3 (1.1 eV), peak 4 (1.6 eV), and peak 5 (1.4 eV). (From Reference [12].
With permission.)
Ch-04.fm Page 239 Friday, November 10, 2000 12:01 PM