Pike Robert, Neal Bill. Corporate finance and investment: decisions and strategy
Подождите немного. Документ загружается.


.
Chapter 18 Capital structure and the required return 485
Now let us consider the break-even volume, initially ignoring the debt interest
obligation. Recall that breaking even means just covering fixed operating costs and
variable costs. In Burley’s case, this requires an output sufficient to generate a gross
margin high enough to cover the fixed operating costs of £480,000. The unit variable
cost is:
(£720,000/60,000) = £12
Were it financed entirely by equity, Burley’s break-even output would be found by
dividing fixed cost by the gross profit margin of (£30 – £12) = £18:
(£480,000/£18) = 26,667 units
Allowing for the interest commitments of £200,000, Burley has to cover total fixed
charges of (£480,000 + £200,000) = £680,000. This requires the higher output of (£680,000/
£18) = 37,778 units to break even. Hence, using debt finance raises the break-even vol-
ume of production because fixed obligations are higher.
We can use this example to distinguish between operating and financial gearing.
Operating gearing can be expressed in a variety of ways. Most simply, it is the pro-
portion of total production cost accounted for by fixed costs: (£480,000/£1,200,000)
= 40 per cent. Allowing for interest payments, Burley needs to generate a gross mar-
gin or contribution of (£480,000 + £200,000) = £680,000 to cover total fixed charges.
At present, it is doing this fairly comfortably, since in percentage terms, fixed
charges account for (£480,000 + £200,000) £1,080,000 = 63 per cent of the contribu-
tion. Looking at the importance of financial gearing, out of its profit before interest
and tax of £600,000, a third (£200,000) is required to cover interest payments, i.e. the
interest cover is 3 times.
A more sophisticated way of viewing the impact of fixed charges is to calculate
leverage ratios. Operating leverage is the number of times the contribution covers the
profit before interest and tax (PBIT), i.e. a multiple of:
This indicates the leeway between contribution and the PBIT, and hence, the extent
to which the fixed costs can increase without forcing the company into an operating
loss. More significantly, the multiplier of 1.8 signifies the relationship between a given
increase in sales and the resulting effect on PBIT. As we show below, a 10 per cent
increase in sales will result in an increase in PBIT of 18 per cent.
Similarly, financial leverage is the number of times the PBIT covers the profit before
tax (PBT), i.e. a multiple of:
The difference between PBIT and PBT is the interest charge, so this multiple indi-
cates the extent to which interest charges can rise without forcing the company into
pre-tax loss. More significantly, the multiplier of 1.5 magnifies the effect of operating
leverage – the effect of a sales increase on PBT is greater in a financially geared firm
than in one with no borrowing. Taking the two multipliers together, we obtain a
combined leverage effect. In this case, a sales increase of 10 per cent will result in an
increase in PBT of times as great, i.e. 27 per cent. For a given tax
rate, here 30 per cent, the profit after tax and, hence, the EPS, will also rise by the
same proportion.
11.8 1.52 2.7
PBIT
PBT
£600,000
£400,000
1.5 times
£1,080,000
£1,600,000
1.8 times
Contribution
PBIT
1Sales VC2
PBIT
operating gearing
The relationship between fixed
and variable cost in a firm’s
cost structure
operating leverage
The ratio of contribution to
profit before interest and tax
financial leverage
The ratio of profit before
interest and tax (PBIT) to prof-
it before tax (PBT)
CFAI_C18.QXD 3/15/07 7:15 AM Page 485

.
486 Part V Strategic financial decisions
Self-assessment activity 18.4
Show the effect on the combined gearing multiplier in the Burley example if fixed costs are
£530,000 and interest charges are £240,000.
(Answer in Appendix A at the back of the book)
To clarify these relationships, it is helpful to demonstrate the impact of Burley expe-
riencing a sales increase of 10 per cent. Assuming no change in unit variable costs, the
Profit and Loss Account becomes:
£000 £000
Sales 1,980 (10% increase)
Less: Variable costs (VC) (792)
Fixed costs (FC) (480) (1,272)
Profit before interest and tax (PBIT) 708 (18% increase)
Less: Interest payable @ 10% (200)
Profit before taxation (PBT) 508 (27% increase)
Less: Corporation tax @ 30% (120)
Profit after tax (PAT) 356 (27% increase)
The new EPS is:
PAT/No. of shares = (£356,000/4 m) = 8.9p (27% increase)
The increase in EPS of 27 per cent (rounded) is a far greater proportion than the
sales increase, illustrating the operation of the combined gearing multiplier. It follows
that the higher the proportion of fixed costs in overall costs, and the greater the com-
mitment to interest charges, the greater will be the combined gearing effect. This may
suggest that using fixed factors of production and using debt capital are both desirable
things. However, as the following example demonstrates, financial gearing is double-
edged. It is beneficial in favourable economic conditions, but because the gearing
effect also works in reverse, it can spell trouble in adverse trading conditions.
18.4 FINANCIAL GEARING AND RISK: LINDLEY PLC
Lindley plc retains no profit and its shareholders require a 20 per cent return. Issued
share capital is £100 million, with par value of £1. Lindley’s operating profit can vary
as shown in Table 18.2, according to trading conditions characterised as bad, indiffer-
ent and good. These are denoted by scenarios A, B and C, which have probabilities of
0.25, 0.50 and 0.25, respectively.
After all costs, but before deducting debt interest, earnings are £5 million, £20 mil-
lion and £35 million under scenarios A, B and C, respectively. This measure of earn-
ings is termed net operating income (NOI). (For simplicity, taxation is ignored.) Let us
examine shareholder returns with gearing ratios of zero, 25 per cent and 50 per cent,
measured by long-term debt (interest rate 10 per cent) to total long-term finance held
constant at £100 million.
Notice that for a given increase in income, shareholder earnings rise by a greater
proportion: for example, with gearing of 25 per cent, if NOI rises by 300 per cent from
£5 million to £20 million, shareholder earnings increase by 600 per cent from £2.5 mil-
lion to £17.5 million. It is easy to see why adding debt to the capital structure is called
gearing – the change in earnings is magnified by a factor of 2.0 in shareholders’ favour.
Unfortunately, this effect also applies in a downward direction – a given proportion-
ate fall in earnings generates a more pronounced decrease in shareholder earnings.
Indeed, with 50 per cent gearing, under scenario A, shareholder earnings are entirely
CFAI_C18.QXD 3/15/07 7:15 AM Page 486

.
Chapter 18 Capital structure and the required return 487
Table 18.2
How gearing affects
shareholder returns in
Lindley plc
Trading conditions
Scenario A Scenario B Scenario C
(p = 0.25) (p = 0.50) (p = 0.25)
Profit before interest (PBIT)*
(Net operating income)
Zero gearing
(100 m equity, debt)
Debt interest at 10% – – –
Shareholder earnings
Return on equity (ROE) 5% 20% 35%
25% gearing
( equity, debt,
interest 10%)
Debt interest at 10%
Shareholder earnings
Return on equity (ROE) 3.3% 23.3% 43.3%
50% gearing
( equity, debt,
interest 10%)
Debt interest at 10%
Shareholder earnings 0
Return on equity (ROE) 0 30% 60%
*
Taxes are ignored.
£30 m£15 m
£5 m£5 m£5 m
£50 m£50 m
1Debt>Equity
1
1
2
£32.5 m£17.5 m£2.5 m
£2.5 m£2.5 m£2.5 m
£25 m£75 m
1Debt>Equity
1
3
2
£35 m£20 m£5 m
£0 m
£35 m£20 m£5 m
wiped out by prior interest charges. The return on equity would be negative at any
higher gearing level under this scenario.
Negative returns are not necessarily fatal – companies often survive losses in espe-
cially poor trading years – but the likelihood of survival when continued trading loss-
es combine with high fixed interest charges is lowered if the company cannot pay
interest charges. In these cases, the enterprise is technically insolvent, although credi-
tors may agree to restructure the company’s capital, e.g. by converting debt into pref-
erence shares. There is, however, an effective upper limit of gearing for Lindley.
Beyond 50 per cent gearing, it may be unable to meet interest charges out of earnings.
For practical purposes, the lower limit of earnings will dictate maximum borrowing
capacity, although, in reality, this lower earnings limit is highly uncertain. This is why
it is usually argued that the more reliable the company’s expected cash flow stream,
the greater its borrowing capacity.
Our Lindley example demonstrates that, under debt financing, although sharehold-
ers may achieve enhanced returns in good years, they stand to receive much lower
returns in bad years. In other words, the residual stream of shareholder earnings exhibits
greater variability. This can be examined by computing the expected value and the
range, or dispersion, of the return on equity (ROE) with each of the three gearing levels.
Self-assessment activity 18.5
Calculate the expected value of Lindley’s ROE under each scenario.
(Answer in Appendix A at the back of the book)
Table 18.3 shows that, although the expected value of the return on equity is greater at
higher levels of gearing, the dispersion, or range, of possible returns is also wider, which
might concern risk-averting shareholders. Notice also that we can decompose the overall
risk incurred by shareholders into its underlying business and financial elements.
CFAI_C18.QXD 3/15/07 7:15 AM Page 487
.
488 Part V Strategic financial decisions
0
5
10 15 20 25 30 35 40 45
10
60
50
40
30
20
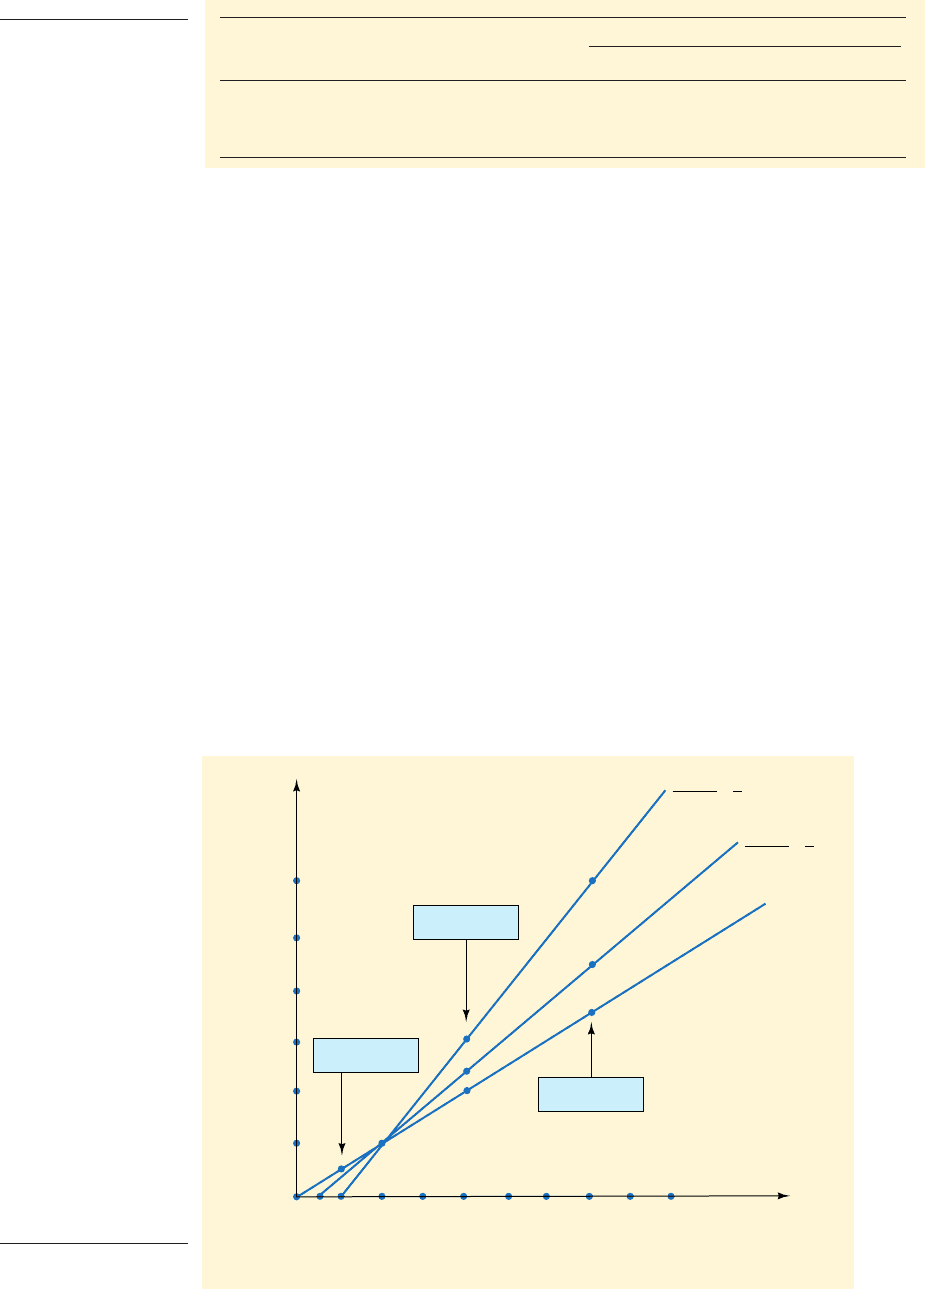
Scenario A
Scenario B
Scenario C
% Return
on equity
(ROE)
XY
All-equity
Profit before
interest and
tax (PBIT) (£m)
Debt
Equity
1
1
=
Debt
Equity
1
3
=
Figure 18.1
How gearing affects
the ROE
Business risk refers to the likely variability in returns for an equivalent all-equity financed
company, i.e. the dispersion of returns is due to underlying business-related factors.
Financial risk is the additional dispersion in net returns to shareholders due to the need
to meet interest charges whatever the trading conditions. At every gearing ratio, the range
of returns due to business risk is unchanged – nothing has happened to its product range,
its customer base or any other aspect of its trading activities. Lindley would simply share
out the proceeds of its operations in different ways at different gearing ratios.
It is also helpful to show the effect on ROE graphically. Figure 18.1 shows the data
for Lindley’s ROE for the three different capital structures. Clearly, the higher the debt-
to-equity ratio, the greater the ROE for any level of profit before interest. Figure 18.1
also shows how the break-even value of profit before interest increases as gearing
rises. As gearing increases from zero to 1:3 and to 1:1, the break-even earnings increase
from 0 to 0X and to 0Y, corresponding to the three interest payment levels of zero,
and respectively. Notice finally that earnings of £10 million would gener-
ate the same ROE under all three capital structures.
This discussion of the impact of gearing is incomplete in one important respect. The
analysis has been based on book values, despite earlier remarks that gearing ratios may
often be better measured in terms of market values. We have yet to consider the effect
of gearing on the value of the firm – does gearing actually make shareholders better off?
To examine the effect on share price, we need to focus on the expected earnings fig-
ure and recall that the value of a share can be found by discounting its stream of earn-
ings, in the simplest case, as a perpetuity. (No distinction is needed between earnings
£5 m£2.5 m
Table 18.3
How gearing affects
the risk of ordinary
shares
Expected Total Due to:
Gearing (%) ROE (%) dispersion (%) Business risk (%) Financial risk (%)
020 30 30 0
25 23.3 40 30 10
50 30 60 30 30
CFAI_C18.QXD 3/15/07 7:15 AM Page 488
.
Chapter 18 Capital structure and the required return 489
Table 18.4
How gearing can affect
share price
Gearing Number of Expected value of
% shares shareholder earnings EPS Share price*
0 100 m 20.0p
25 75 m 23.3p
50 50 m 30.0p
*Share price is found by discounting the perpetual and constant EPS at 20 per cent
30.0p>0.2 £1.50£15 m
23.3p>0.2 £1.17£17.5 m
20.0p>0.2 £1.00£20 m
Self-assessment activity 18.6
What is the effect on share price if shareholders required returns of 25 per cent under 25
per cent gearing and of 35 per cent under 50 per cent gearing?
(Answer in Appendix A at the back of the book)
and dividends, as Lindley makes no retentions.) The expected values of shareholder
earnings for each of the three gearing ratios are shown in Table 18.4. Recalling that
Lindley’s shares have a nominal value of £1, we can specify the number of shares cor-
responding to each gearing ratio and hence the expected value of the EPS. Share prices
are found by applying the valuation formula, discounting the perpetual EPS at the
20 per cent return required by Lindley’s shareholders.
It appears that, by using debt capital, financial managers can achieve significant
increases in shareholder wealth. However, we ought to be suspicious of this effect.
Why should shareholders’ wealth increase when there have been no changes in trad-
ing activity or in expected aggregate income?
The analysis assumes that shareholders are prepared to accept a return of 20 per
cent at all permissible gearing levels – they seem to be unconcerned by financial risk.
Even though there may be no risk of insolvency, gearing exposes shareholder earnings
to greater variability. We might therefore expect shareholders to react to gearing by
demanding higher returns on their capital. If they think gearing is too risky, they may
sell their holdings, thus driving down the share price.
We need to examine in more detail the likely reaction of shareholders to increased
gearing; we will find that this is a key element in the debate about optimal capital
structure. In the next section, we examine the so-called ‘traditional’ view of gearing,
probably still the most widely supported explanation.
18.5 THE ‘TRADITIONAL’ VIEW OF GEARING AND THE REQUIRED RETURN
The traditional view emphasises the benefits of using relatively cheap debt capital as
seen in the Lindley example; in particular, the effect on the rate of return required on
investment. To analyse this approach in greater depth, we first need to make some
definitions.
■ Value of an ungeared company
For an ungeared company, market value is found by discounting (or capitalising) its
stream of annual earnings, E, at the rate of return required by shareholders,
The value of an ungeared company, is simply the value of the ordinary shares,
For a constant and perpetual stream of annual earnings, E:
V
u
V
S
E
k
e
so that k
e
E
V
S
V
S
.
V
u
,
k
e
.
CFAI_C18.QXD 3/15/07 7:15 AM Page 489

.
490 Part V Strategic financial decisions
Much of the argument about capital structure centres on what happens to the dis-
count rate (or capitalisation rate) as gearing increases. If the analysis is conducted in
terms of substituting debt for equity, i.e. keeping size of firm constant as we did in the
Lindley example, the effect of gearing can be examined while holding E constant. In
this case, gearing simply rearranges the share-out of E among the company’s stake-
holders. We denote the book value of borrowings as B and the interest rate as i, thus
involving a prior interest charge of Gearing splits the earnings stream of the
company into two components, the prior interest charge and the portion attributable
to shareholders, the net income (NI) of The overall value of the company is
the value of the shares plus the value of the debt, each capitalised at its respective
rate of discount. For debt, where there is no discrepancy (as in this example) between
book value (B) and market value the capitalisation rate is simply the nominal
interest rate. The overall value of the geared company, is the combined value of its
shares and its debt:
The overall capitalisation rate (denoted by ) for a company using a mixed capital
structure is a weighted average, whose weights reflect the relative importance of each
type of finance in the capital structure, i.e. and for equity and debt,
respectively:
Bearing in mind that and iB (or when ) represent the returns to
shareholders and lenders respectively, i.e. their respective shares of corporate earn-
ings, E, the weighted average expression simplifies to:
For both ungeared and geared firms alike, is found by dividing the required earn-
ings by the value of the whole firm. is also known as the weighted average cost of
capital (WACC), since it expresses the overall return required to satisfy the demands
of both groups of stakeholders. The WACC may be interpreted as an average discount
rate applied by the market to the company’s future operating cash flows to derive the
capitalised value of this stream, i.e. the value of the whole company.
It looks as if a company could lower the WACC by adding ‘cheap’ debt to an equi-
ty base. For instance, in the Lindley example, while the required return for the all-equity
case is 20 per cent, i.e. the cost of equity, with gearing at 25 per cent, the WACC, using
book value weights, becomes:
Apparently, gearing can lower the overall cost of capital if both and i remain con-
stant. The effect of this is highly significant. In the traditional view of gearing, share-
holders are deemed unlikely to respond adversely (if at all) to minor increases of
gearing so long as the prospect of default looks remote. If the cost of equity remains
static, substitution of debt for equity will lower the overall cost of capital applied by
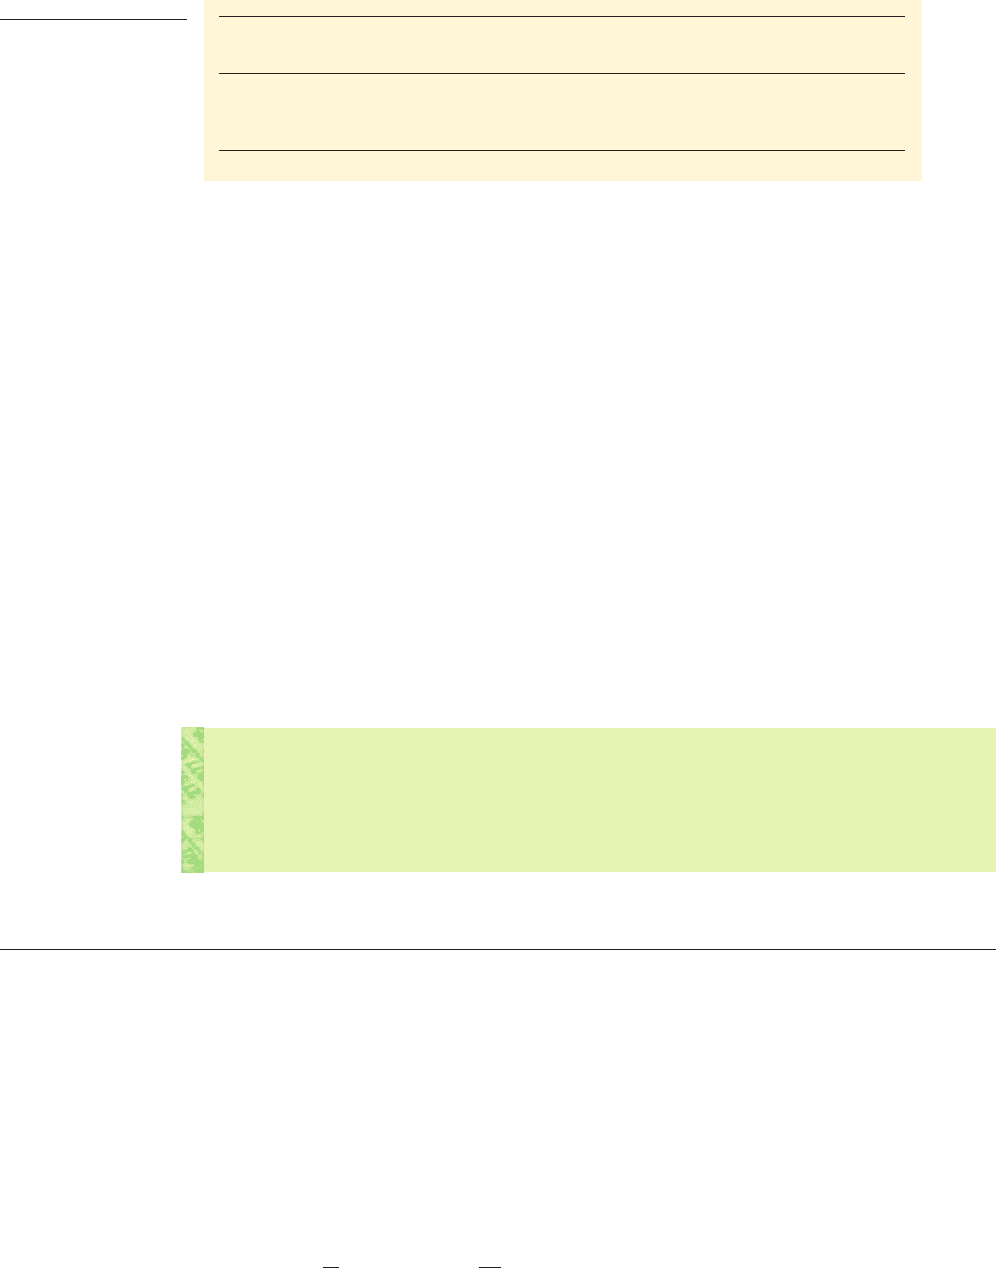
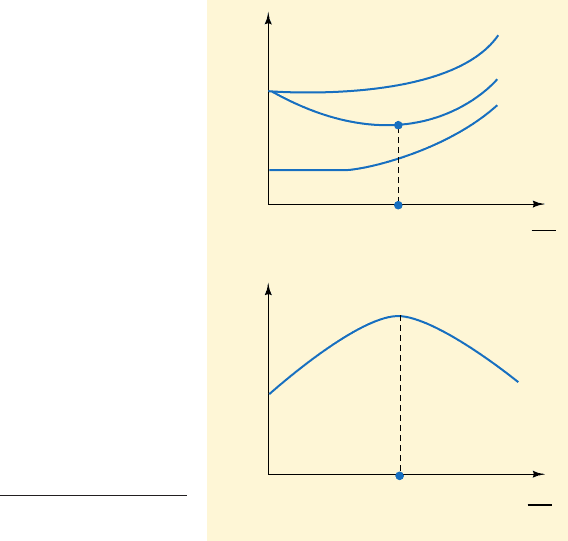
the market in valuing the company’s stream of earnings. This is shown in Figure 18.2
by the decline in the schedule between A and B. Corresponding to this fall in is an
increase in the value of the whole geared company, in relation to that of an equiv-
alent ungeared company,
This benign impact of gearing has already been shown in the Lindley example.
Looking back to Tables 18.3 and 18.4, consider the switch from 0 to 25 per cent gear-
ing. Assuming shareholders continue to seek a return of 20 per cent, the EPS
V
u
.
V
g
,
k
0
k
0
k
e
k
0
10.75 20% 2 10.25 10%2 17.5%
k
0
k
0
k
0
k
e
V
S
iB
V
g
E
V
g
V
B
BiV
B
,1k
e
V
S
2
k
0
¢k
e
V
S
V
g
≤ ¢i
V
B
V
g
≤
V
B
>V
g
V
S
>V
g
k
0
V
g
V
S
V
B
1E iB2
k
e
iB
i
1E iB2
k
e
V
B
V
g
,
1V
B
2,
1V
S
2
1E iB2.
1i B2.
CFAI_C18.QXD 3/15/07 7:15 AM Page 490
.
Chapter 18 Capital structure and the required return 491
discounted to infinity yields a share price of £1.17. The market value of equity becomes
and the overall company value is:
Gearing up to 25 per cent raises market value by £13 million above book value, thus
demonstrating the benefits of gearing to shareholders. The market value of the whole
company rises because the value per unit of the residual equity increases due to the
increase in EPS. Without gearing, each share would sell at £1.
However, sooner or later, shareholders will become concerned by the greater finan-
cial risk to which their earnings are exposed and begin to seek higher returns. In addi-
tion, providers of additional debt are likely to raise their requirements as they perceive
the probability of default increasing. The schedule will probably turn upwards
before any upturn in i, given the legally-preferred position of debt holders, although
the phasing of these movements is not clear in this model. Whatever the sequence of
the upward revisions in required returns, the WACC profile will eventually be forced
to rise, and the value of the company will fall. The model involves a clear optimal
debt/equity mix, where company value is maximised and the WACC is minimised.
This is gearing ratio 0X in Figure 18.2.
To financial managers, a major disappointment of this approach is its failure to pin-
point a specific optimal gearing ratio for all firms in all circumstances. The optimal
ratio is likely to depend on the nature of the industry (e.g. whether the activity gener-
ates strong cash flows), the general marketability of the company’s assets, expectations
about the prospects for the industry, and the general level of interest rates. Clearly,
many of these factors vary over time as well as between industries. However, a few
pointers are possible.
For example, a supermarket chain, characterised by strong cash flow, can sustain a
higher level of gearing than a heavy engineering enterprise, where the working capi-
tal cycle is lengthy. Similarly, an airline, for whose assets there is a ready and active
second-hand market, might withstand a higher gearing level (especially as flights are
k
e
V
g
V
S
V
B
1£88 m £25 m2 £113 m
1£1.17 75 m2 £88 m,
Cost of
debt
capital
k
e
k
0
V
g
V
u
B
X
0
A
i
Cost of capital
X
0
Company value
V
B
V
S
V
B
V
S
Figure 18.2
The ‘traditional’ view
of capital structure
CFAI_C18.QXD 3/15/07 7:15 AM Page 491

.
492 Part V Strategic financial decisions
Our analysis has so far assumed that market and book values of debt coincide. This is
by no means always the case. Corporate bond values behave in a similar way to the
market prices of government stock (gilt-edged securities). When general market inter-
est rates increase, the returns on previously issued bonds may look unattractive com-
pared with the returns available on newly issued ones. As a result, bond dealers mark
down the value of existing stocks until they offer the same yield as investors can obtain
by purchasing new issues. In other words, equilibrium in the bond market is achieved
when all stocks that are subject to the same degree of risk and that have the same peri-
od to redemption offer the same yield.
The simplest case is perpetual (irredeemable) stock such as the UK government’s 3.5
per cent War Loan. These were issued, never to be repaid, to support the British war effort
between 1939 and 1945. They offer the holder a return of 3.5 per cent (the nominal rate of
interest, or ‘coupon rate’) on the par value of the stock, i.e. £3.50 per £100 of stock. With
higher market rates, say, 7 per cent, War Loan would look unattractive, and its value
would fall, e.g. a £100 unit would have to sell at £50 to generate a yield of 7 per cent. An
inverse relationship applies between fixed-interest bond prices and interest rates:
The market value of an irredeemable bond ¢nominal value
coupon rate
market rate
≤
Self-assessment activity 18.7
What is this firm’s WACC? (ignore tax)
■ debt-to-equity ratio = 40%
■ cost of equity = 18%
■ cost of debt = 8%
(Answer in Appendix A at the back of the book)
often paid for well in advance) than a steel company with both a high level of operat-
ing gearing and assets that are highly specific and difficult to sell.
18.6 THE COST OF DEBT
Self-assessment activity 18.8
What is the market value of 3.5 per cent War Loan when market rates are:
(i) 11%?
(ii) 3%?
In practice, the calculation is more complex when we consider the far more com-
mon case of bonds with limited lifetimes until maturity. In assessing the value of such
bonds, the market value will also include the eventual capital repayment.
For example, if the market rate is 10 per cent, a ten-year bond with a coupon rate of
10 per cent, denominated in £100 units, would have the following (present) value:
£61.45
£38.55 £100
1£10 6.14462
1£100 0.38552
110% £1002
.
1PVIFA
110,102
2
1£1002
.
1PVIF
110,102
2
payments over 10 years
repayment in year 10
PV discounted interest
discounted capital
CFAI_C18.QXD 3/15/07 7:15 AM Page 492

.
Chapter 18 Capital structure and the required return 493
Self-assessment activity 18.9
Verify that the solution rate in the above IRR equation is 9.9 per cent.
(Answer in Appendix A at the back of the book)
The market value coincides with the par value because the coupon rate equals the
going market rate. If, however, the market rate were to rise to 12 per cent, all future
payments to the bondholder, both capital and interest, would be more heavily dis-
counted, i.e. at 12 per cent, reducing the market value to £88.70.
Values of corporate bonds behave in essentially the same way, although, since com-
panies are more risky than governments, they have to offer investors a rather higher
rate of interest. This allows us to identify the cost of corporate debt capital. A compa-
ny can infer the appropriate rate of interest at which it could raise debt by looking at
the market value of its own existing debt or that of a similar company. For example, if
the market value of each £100 unit of debenture stock is £95 and has to be repaid in
full in two years’ time, the cost of debt can be found by solving a simple IRR expres-
sion. Someone who decided to purchase the stock in the market would anticipate two
interest payments of £10 and a capital repayment of £100. The return expected is
denoted by in the following IRR expression:
The solution for is 13 per cent. The market signals this rate as the cost of raising
further debt.
There is another adjustment to make for tax relief on debt interest payments. To
allow for tax, we look at the cost of debt from the company’s perspective, since it is the
company that enjoys the tax break. With a Corporation Tax rate of 30 per cent, each £10
interest payment will generate a tax saving of £3 for the company, reducing the effec-
tive interest cost to The IRR equation becomes:
£95
£7.0
11 k
d
2
1£7.0 £1002
11 k
d
2
2
£1011 30% 2 £7.0.
k
d
£95
£10
11 k
d
2
1£10 £1002
11 k
d
2
2
k
d
The tax benefits from using debt can be substantial. Take the case of a 10-year bond,
issued and redeemable at a price of £100, with a coupon rate of 10 per cent. The value
of the tax savings on interest payments, or the ‘tax shield’, is:
In practice, this value is reduced by any delay in tax payments, which in turn delays
the receipt of tax benefits. It is also assumed that the company always has sufficient
taxable profits to benefit from the tax relief on interest payments.
£18.43
110% £1002 130%2 6.1446
Tax shield interest charge 1tax rate2 PVIFA
110,102
Self-assessment activity 18.10
What is the value of the tax shield for £10 million debt, coupon rate 6 per cent, tax rate
30 per cent:
(a) if the debt is perpetual?
(b) if it is to be repaid in 20 years?
(Answer in Appendix A at the back of the book)
CFAI_C18.QXD 3/15/07 7:15 AM Page 493

.
494 Part V Strategic financial decisions
18.7 THE OVERALL COST OF CAPITAL
Section 18.5 discussed the weighted average cost of capital (WACC) concept, illustrat-
ed in Figure 18.2. This was interpreted as the overall rate of return required in order to
satisfy all stakeholders in the company. It described a U-shaped profile as the firm’s
level of gearing increased. It fell initially, as cheap debt was added to the capital struc-
ture, reached a minimum at the optimal gearing ratio, then rose as gearing came to be
regarded as ‘excessive’. The behaviour of this schedule provides a clue to the appro-
priate rate of return required on the company’s activities, and, by implication, on new
investment projects. We will examine this issue using the Lindley example.
■ Lindley plc and the cut-off rate for new investment
Lindley’s shareholders require a 20 per cent return and its pre-tax cost of debt is 10 per
cent. Let us make the simplifying assumptions that Lindley’s debt is perpetual and sells
at par. Adjusting for tax at 30 per cent, as explained above, this corresponds to an after-
tax cost of 7 per cent. What return on investment should Lindley achieve when issuing
debt to finance a new project?
It is tempting to argue that the cut-off rate on this new project should be the cost of
servicing the finance raised specifically to undertake the project. However, this is prob-
ably erroneous because using debt has an opportunity cost. The use of ‘cheap’ debt now
may erode the company’s ability to undertake worthwhile projects in the future by the
depletion of credit lines. For example, assume that in 2005 Lindley used debt costing
7.0 per cent after tax to finance a project offering a post-tax return of 12 per cent, but
this exhausted its credit-raising capacity. As a result, it was unable to exploit a project
available in 2006 that offered 14 per cent. This suggests that the ‘true’ cost of the finance
used in 2005 exceeds 7.0 per cent. Hence, to assess the ‘correct’ cost of capital really
requires forecasting all future investment opportunities and capital supplies.
In addition, our previous analysis leads us to expect, at some level of gearing, an
adverse reaction by shareholders, who may demand higher returns to compensate for
higher financial risk. Consider two possible cases, denoted by points A and B, respec-
tively, on the WACC profile in Figure 18.2. Note that A corresponds to zero gearing
and B to the critical ratio.
Case A
Lindley has no debt at present and shareholder capital is £100 million. A new project
with perpetual life is to be financed by the issue of £10 million debt at an after-tax cost
of 7 per cent. No impact on the cost of equity is expected. In this case, the company will
have to generate additional post-tax annual returns of million
in order to meet the extra financing costs associated with the new project, so that the
hurdle rate for the new project is 7 per cent. Here, with the explicit assumption that
shareholders will not react adversely, it may be reasonable to use the cost of debt as the
cut-off rate. In this case, the required return would be simply the interest cost divided
by the debt financing provided, i.e. the interest rate:
However, this position is unlikely to be tenable, except for very small projects, and
hence small borrowings, since significant changes in gearing (in either direction) are
likely to provoke a market reaction.
Case B
We will assume that the optimal gearing ratio involves a capital structure with £50 mil-
lion of each type of capital. Any further debt financing, even at a constant debt cost, will
cause the cost of equity to increase. Assume that the extra £10 million debt financing
Required return iB>B i
17% £10 m2 £0.70
CFAI_C18.QXD 3/15/07 7:15 AM Page 494