Pike Robert, Neal Bill. Corporate finance and investment: decisions and strategy
Подождите немного. Документ загружается.


.
Chapter 10 Setting the risk premium: the Capital Asset Pricing Model 265
between systematic risk and specific risk may be relatively insignificant, since they have a vest-
ed interest in minimising total risk to increase their job security. If the company flounders,
it is of little comfort for them to know that their personal catastrophe has only a min-
imal effect on well-diversified shareholders.
As we will see in Chapter 20, there are many motives for diversification beyond
merely reducing risk. However, it is common to justify diversification to sharehold-
ers purely on these grounds, at least under certain types of market imperfection.
When a company fails, there are liquidation costs to bear as well as the losses entailed
in selling assets at ‘knock-down’ prices. These costs may result in both creditors and
shareholders failing to receive full economic value in the asset disposal. Although this
will not devastate a well-diversified shareholder, the resulting hole in his or her port-
folio will require filling in order to restore balance. Company diversification may
reduce these risks and also the costs of portfolio disruption and readjustment.
St Gobain
Despite contemporary strategic thinking, the conglomerate is not extinct everywhere. In
France, famous for its policy of nurturing national champions, the glass-maker, St Gobain, pri-
vatised in 1986, has since thrived on a diet of acquisition of often unrelated businesses. The
Chairman/CEO, Jean-Louis Beffa, is scornful of the drive for focus as firms try to concentrate
operations on ‘core’ areas of business. M. Beffa has overseen the acquisition of over 900 com-
panies, including many in the distribution of building materials, an activity uncharted by St
Gobain until the 1990s.
Beffa says about ideas of focus:
Look at Siemens. They are better for having a mix of companies from which they can
get a strong cash flow.
In support, he points to St Gobain’s balancing of distribution operations, covering a broad
range of items for the building trade and operated mainly on a regional basis, with the global
manufacturing of flat glass (where St Gobain is world number 2 after Asahi of Japan), and con-
tainers. Glass production is highly cyclical, changing with the oscillations of the world econo-
my, whereas the distribution of building materials is far more stable because different national
markets have their own peculiar patterns of troughs and peaks. St Gobain’s diversification
strategy gives it the consistent financial fire-power – cash flow of Euros 2.8 billion in 2003 –
to finance growth by capital spending and by acquisition.
Beffa also stresses the need to enable executives to build up expertise in certain areas and
to transfer skills horizontally across the overall business, for example legal expertise acquired in
different fields that can be applied elsewhere, and experience of using specific financial instru-
ments in different parts of the world. It also encourages the flow of ideas between divisions
through nine overseas ‘delegate offices’, which act as collection points for ideas so that execu-
tives can transmit them with utmost efficiency.
Of course, one might argue that a growth-oriented policy that makes the firm increasingly
important to the national economy also makes it more likely that the state will step in with
financial assistance when necessary. St Gobain makes a virtue of this by suggesting that gov-
ernments should help to fuel national economic growth by state investment, in their case, in
developing novel applications or glass structures, for example for flat-screen TVs.
Source: Based on Peter Marsh, Financial Times, 4 January 2005.
Self-assessment activity 10.11
In the light of the St Gobain case, explain why it might good to be a conglomerate.
(Answer in Appendix A at the back of the book)
CFAI_C10.QXD 3/15/07 7:28 AM Page 265

.
266 Part III Investment risk and return
Further reading
As with basic portfolio theory, Copeland and Weston (2004) offer a rigorous treatment of the
derivation of the formulae used in this chapter. Brealey, Myers and Allen (1996) offer an alter-
native, less mathematical treatment. You should also read the famous critique of the CAPM by
Roll (1977). Fama and French’s paper (1992), although difficult, is essential reading, as is Strong
and Xu (1997), for a UK perspective.
We have examined the nature of the risks affecting the holders of securities and have
begun to discuss whether the return required by shareholders, as implied by market
valuations, can be used as a cut-off rate for new investment projects.
Key points
■ Security risk can be split into two components: risk specific to the company in ques-
tion, and the variability in return due to general market movements.
■ Rational investors form well-diversified portfolios to eliminate specific risk.
■ The most efficient portfolio of risky securities is the market portfolio, although
investors may mix this with investment in the risk-free asset in order to achieve
more preferred risk–return combinations along the capital market line.
■ The risk premium built into the required return on securities reflects a reward for
systematic risk only.
■ The risk premium on a particular share depends on the risk premium on the over-
all market and the extent to which the return on the security moves with that of the
whole market, as indicated by its Beta coefficient.
■ This premium for risk is the second term in the equation for the security market
line:
■ Practical problems in using the CAPM centre on measurement of Beta, specification
of the risk-free asset and measurement of the market’s risk premium.
■ In an all-equity financed company, the return required by shareholders can be used
as a cut-off rate for new investment if the new project has systematic risk similar to
the company’s other activities.
■ There is some debate about whether managers should diversify company activities
merely in order to lower risk.
■ Empirical studies seem to throw increasing doubt on the CAPM.
■ The main proposed alternative, the Arbitrage Pricing Theory (APT), relies on fewer
restrictive assumptions but is still in the prototype stage.
ER
j
R
f
b
j
1ER
m
R
f
2.
SUMMARY
CFAI_C10.QXD 3/15/07 7:28 AM Page 266
.
Chapter 10 Setting the risk premium: the Capital Asset Pricing Model 267
‘Aggressive’
b
> 1
R
2
= 1
R
2
= 1
R
2
= 1
‘Neutral’
b
= 1
‘Defensive’
b
< 1
R
m
R
j
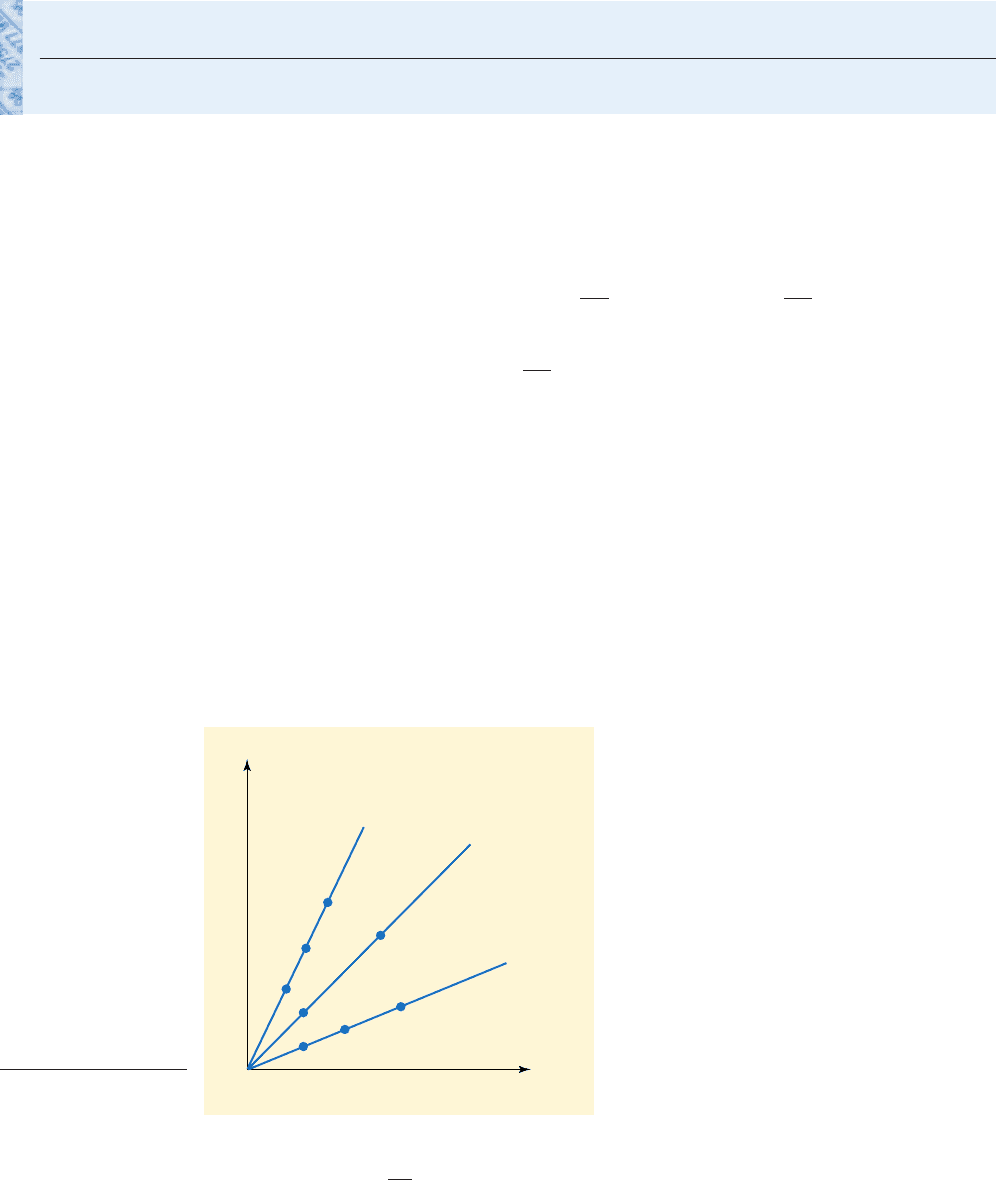
Figure 10.11
Alternative characteris-
tics lines
The total risk of a security comprising both unsystematic risk and sys-
tematic risk is measured by the variance of returns, which can be separated into
the two elements. Imagine an asset with total risk of of which 80 per cent
(400) is explained by systematic risk factors, the remainder resulting from factors spe-
cific to the firm:
In terms of standard deviations, and Notice
that we cannot express the overall standard deviation by summing the two compo-
nent standard deviations – variances are additive, but not standard deviations – the
square root of the total risk is rather than the sum of and
In regression models, the extent to which the overall variability in the dependent
variable is explained by the variability in the independent variable is given by the R-
squared statistic, the square of the correlation coefficient. The is thus a measure
of ‘goodness of fit’ of the regression line to the recorded observations. If all observa-
tions lie on the regression line, equals 1 and the variations in the market return fully
explain the variations in the return on security j. In this case, all risk is market risk. It
follows that the lower is the greater the proportion of specific risk of the security.
For investors wishing to diversify away specific risk, such securities are highly attrac-
tive. Notice that an of 1 does not entail a Beta of 1, as Figure 10.11 illustrates. All
three securities have of 1, but they have different degrees of market risk, as indi-
cated by their Betas.
R
2
R
2
R
2
,
R
2
R
2
1R
2
2
s
USR
120 10 302.
s
SR
2500 22.4,
s
USR
2100 10.s
SR
2400 20
s
T
2
500 s
SR
2
s
USR
2
100 400
s
T
2
500,
1s
SR
2,
1s
USR
2,1s
T
2,
APPENDIX
ANALYSIS OF VARIANCE
In the example above, the of 80 per cent would correspond to a correlation
coefficient, of Looking at the standard deviations, we can infer
that 0.89 of the standard deviation is market risk, i.e. while the
specific Let us re-emphasise these
relationships:
risk 11 r
jm
2 22.4 10.11 22.42 2.46.
10.89 22.42 19.94,
20.8
0.89.r
jm
,
R
2
CFAI_C10.QXD 3/15/07 7:28 AM Page 267
.
268 Part III Investment risk and return
Market, or systematic risk, is:
Specific risk is:
The reader may find it useful to test out these relationships using the data provid-
ed in Table 10.4 (‘Variability’ is total risk expressed as a standard deviation). However,
not all cases work out neatly owing to rounding errors.
10.2 5002 100; or 10.11 22.4%2 2.46%.
11 R
2
2 overall variance, s
T
2
; or 11 r
jm
2 overall standard deviation s
T
10.8 5002 400; or 10.89 22.4%2 19.94%
R
2
the overall variance, s
T
2
; or 1r
jm
the overall standard deviation, s
T
2
CFAI_C10.QXD 3/15/07 7:28 AM Page 268

.
Questions with a coloured number have a Solution in Appendix B on page 699.
1 The ordinary shares of Firm A have a Beta of 1.23. The risk-free rate of interest is 5 per cent, and the risk pre-
mium achieved on the market index over the past 20 years has averaged 11.5 per cent p.a. What is the future
expected return on A’s shares?
If you believe that overall market returns will fall to 8 per cent in future years, how does your answer
change?
2 Supply the missing links in the table:
(i) 19% ? 1.10 18%
(ii) 17% 5% ? 12%
(iii) ? 4% 0.75 10%
(iv) 15% 7% 0.65 ?
3 Locate the security market line (SML) given the following information:
4 Which of the following shares are over-valued?
Beta Current Rate of Return
A 0.7 7%
B 1.3 13%
C 0.9 9%
The risk-free rate is 5 per cent, and the return on the market index is 10 per cent.
5 The market portfolio has yielded 12 per cent on average over past years. It is expected to offer a risk premi-
um in future years of 7%. The standard deviation of its return is 8 per cent. The risk-free rate is 5 per cent.
(i) What is the expected return from the market portfolio?
(ii) Draw a diagram to show the location of the Capital Market Line.
(iii) What is the expected return on a portfolio comprising 50% invested in the market portfolio and 50%
invested in the risk-free asset?
(iv) What is the risk of the portfolio in (iii)?
(v) What is the market trade-off between portfolio risk and return suggested by these figures?
6 The following figures relate to monthly observations of the return on a widely used stock market index
and the return on a particular ordinary share over a period of six months.
Month
154
2
3 12 9.6
4 3 2.4
5
6 7 5.6
(a) Plot these data on a graph and deduce the value of the Beta coefficient.
(b) To what extent are variations in due to specific risk factors?
(c) Calculate the systematic risk of the security. (NB: )
systematic risk b
2
s
m
2
.
R
m
3.24
810
R
j
R
m
1R
j
2
1R
m
2
R
f
8%, ER
m
12%.
ER
m
BR
f
ER
j
Chapter 10 Setting the risk premium: The Capital Asset Pricing Model 269
QUESTIONS
CFAI_C10.QXD 3/15/07 7:28 AM Page 269

.
7 Z plc is a long-established company with interests mainly in retailing and property development. Its current
market capitalisation is The company trades exclusively in the UK, but it is planning to expand
overseas either by acquisition or joint venture within the next two years. The company has built up a portfolio
of investments in UK equities and corporate and government debt. The aim of developing this investment port-
folio is to provide a source of funds for its overseas expansion programme. Summary information on the port-
folio is given below.
Value Average % return
Type of security £ over the last 12 months
UK equities 23.2 15.0
US equities 9.4 13.5
UK corporate debt 5.3 8.2
Long-term government debt 11.4 7.4
Three-month Treasury bonds 3.2 6.0
Approximately 25 per cent of the UK equities are in small companies’ shares, some of them trading on the
Alternative Investment Market. The average return on all UK equities, over the past 12 months, has been
12 per cent. On US equities, it has been 12.5 per cent.
Ignore taxation throughout this question.
Required
Discuss the advantages and disadvantages of holding such a portfolio of investments in the circumstances of
Z plc.
(CIMA, November 1997)
million
£750 million.
270 Part III Investment risk and return
CFAI_C10.QXD 3/15/07 7:28 AM Page 270

.
The required rate of return on investment
and Shareholder Value Analysis
11
Learning objectives
This chapter applies the models developed in earlier chapters to measuring the required rate of
return on investment projects. After reading it, you should:
■ Understand how the Dividend Growth Model is used to set the hurdle rate.
■ Understand how the Capital Asset Pricing Model is also used for this purpose.
■ Be able to apply the required rate of return to firm valuation.
■ Appreciate that different rates of return may be required at different levels of an organisation.
■ Be aware of the practical difficulties in specifying discount rates for particular activities.
■ Appreciate how taxation may influence discount rates.
Setting the cost of equity
Very few companies are forthcoming about the rate of return they require on investment. The following quo-
tation endures as a remarkably open statement of targets by Quaker Oats Inc. (now part of PepsiCo).
The cost of equity is a measure of the minimum return Quaker must earn to properly compensate investors in
a stock of comparable risk. It is made up of two prime components: the ‘risk-free’ rate and the ‘equity risk pre-
mium’. The risk-free rate is the sum of the expected rate of inflation and a ‘real’ return, above inflation, of 2 to
3 per cent. A commonly used surrogate for the risk-free rate is the rate for US Treasury Bonds, which are uncon-
ditional obligations of the government intended to pay a real return of 2 or 3 per cent above long-term infla-
tion expectations. For fiscal 1989, the average risk-free rate on these securities was approximately 9 per cent.
For Quaker, a ‘risk premium’ of about 5.3 per cent is added to the risk-free rate to compensate investors
for holding Quaker’s stock, the returns of which depend on the future profitability of the Company. To derive
Quaker’s cost of equity, the risk premium is added to the risk-free rate. In fiscal 1989, the company’s average
cost of equity was approximately 14.2 per cent.
Source: Quaker Inc., Annual Report.
CFAI_C11.QXD 10/26/05 11:38 AM Page 271

.
272 Part III Investment risk and return
11.1 INTRODUCTION
The Quaker Annual Report showed the company’s keen appreciation of the need to
reward its shareholders. No company can expect prolonged existence without achiev-
ing returns that at least compensate investors for their opportunity costs. Shareholders
who receive a poor rate of return will vote with their wallets, depressing share price. If
its share price underperforms the market (allowing for systematic risk), a company is
ripe for re-organisation, takeover or both. A management team, motivated if only by job
security, must earn acceptable returns for shareholders. This chapter deals with assess-
ing such rates of return and showing how they can be used in valuing firms. Different
returns may be required for different activities, according to their riskiness. Multi-
division companies, which operate in a range of often unrelated activities, may require
tailor-made ‘divisional cut-off rates’ to reflect the risk of particular activities.
The return that a company should seek on its investment depends not only on its
inherent business risk, but also on its capital structure – its particular mix of debt and
equity financing. However, because determining this rate for a geared company is
complex, we defer treatment of the impact of gearing until Chapters 19 and 20. Here,
we focus on the return required by the shareholders in an all-equity company.
Shareholders seek a return to cover the cost of waiting for their returns, plus com-
pensation for inflation, plus a premium to cover the exposure to risk of their capital,
depending on the risk of the business activity.
Two widely-adopted approaches are the Dividend Growth Model (DGM), encoun-
tered in Chapter 4, and the Capital Asset Pricing Model (CAPM), developed in the last
chapter. Under each approach, we determine the return that shareholders demand on
their investment holdings. We then consider whether this return should dictate the
hurdle rate on new investment projects.
11.2 THE REQUIRED RETURN IN ALL-EQUITY FIRMS: THE DGM
■ The DGM revisited
In Chapter 4, we discussed the value of shares in an all-equity firm which retained a
constant fraction, b, of its earnings in order to finance investment. If retentions are
expected to achieve a rate of return, R, this results in a growth rate of The share
price is:
where and represent this year’s and next year’s dividends per share respectively,
and is the rate of return required by shareholders.
■ The cost of equity
Rearranging the expression, we find the shareholder’s required return is:
The shareholder’s required return is thus a compound of two elements, the prospec-
tive dividend yield and the expected rate of growth in dividends.
It is important to appreciate that this formula for is based on the current market
value of the shares, and that it incorporates specific expectations about growth,
dependent on assumptions about both the retention ratio, b, and the expected rate
of return on new investment, R. With b and R constant, the rate of growth, g, is also
constant. These are highly restrictive assumptions. Often, the nearest we can get to
k
e
k
e
D
1
P
o
g
k
e
D
1
D
o
P
o
D
o
11 g2
1k
e
g2
D
1
1k
e
g2
g bR.
CFAI_C11.QXD 10/26/05 11:38 AM Page 272

.
Chapter 11 The required rate of return on investment and Shareholder Value Analysis 273
Self-assessment activity 11.1
Determine the required return by shareholders in the following case:
Share price £1.80 (ex div)
Past growth 3%
EPS £0.36
Dividend cover 3 times
(Answer in Appendix A at the back of the book)
Table 11.1
The return on
Whitbread plc shares
Year DPS (p)
2001–2 17.80
2002–3 19.87
2003–4 22.30
Source: Whitbread plc, Annual Report and Accounts.
assessing the likely growth rate is to project the past rate of growth, ‘tweaking’ it if
we believe that a faster or slower rate may occur in future.
For example, assume Arthington plc is valued by the market at £3 per share, hav-
ing recently paid a dividend of 20p per share, and has recorded dividend growth of 12
per cent p.a. Projecting this past growth rate into the future, we can infer that share-
holders require a return of 19.5 per cent, viz:
k
e
20 p 11.122
300 p
0.12 10.075 0.122 0.195, i.e. 19.5%
*The growth rate, g, is found from the expression:
17.80/(1 g)
2
22.30, or (1 g)
2
1.2528
The growth rate can be found directly from compound interest tables, or by inverting the expression
from the present value tables, i.e. whence g approximates to 12 per cent.1>11 g2
2
0.7982,
■ Whitbread plc (www.whitbread.co.uk.)
Let us relate this approach to a real company. Table 11.1 shows the dividend payment
record and end-of-financial year share prices for Whitbread, the leisure conglomerate
for the three years 2001/2–2003/4.
The dividend per share (DPS) grew by 25 percent from 17.80p in 2001/2 to 22.30p
by 2003/4. Using discount tables, we find the average annual compound growth
rate is about 12 per cent.* Applying this result to the share price of 741.5p ruling at
Whitbread’s latest year end, we find:
k
e
22.30p 11.122
741.5p
0.12 0.033 0.12 0.153 1i.e.2 15.3%.
■ Some problems
Apart from the restrictive assumptions of the dividend growth model, some further
warnings are in order.
CFAI_C11.QXD 10/26/05 11:38 AM Page 273
.
274 Part III Investment risk and return
1 The dividend growth depends on the time period used
A period of just three years, albeit reflecting the most recent dividend record, is really
too short for a reliable growth rate calculation, being subject to random distortions.
There is no ideal period to take – perhaps 5–6 years might be more meaningful.
Unfortunately, the longer the period selected, the greater the likelihood of structural
changes in the business, e.g. major acquisitions and divestments, and/or radical
changes in dividend policy. As it happens, Whitbread fits this profile – in 2000/01, it
paid a dividend of 31.5p per share just prior to selling off its underperforming brew-
eries division. Hence, the dividend has actually fallen over the past few years, as
Whitbread has restructured and moved to a less generous dividend policy.
Nevertheless, it is a progressive one (meaning a growing dividend). It has declared its
aim to move from dividend cover of around 1.7 times to 2.5 times. So long as earnings
carry on rising, so will dividends.
The calculation of g, and hence should be based on a sufficiently long period to
allow random distortions to even out. We may still feel that past growth is an unreli-
able guide to future performance, especially for a company in a mature industry,
growing roughly in line with the economy as a whole. If past growth is considered
unrepresentative, we may interpose our own forecast, but this would involve second-
guessing the market’s growth expectations, which is tantamount to challenging the
EMH.
2 The calculated k
e
depends on the choice of reference date for measuring
share price
Our calculation used the price at the end of the accounting period, but this pre-dates
the announcement of results and payment of dividend. Arguably, we should use the ex-
dividend price, as this values all future dividends, beginning with those payable in one
year’s time. This would reduce the distortion to share price caused by the pattern of
dividend payment (i.e. the share price drops abruptly when it goes ‘ex-dividend’,
beyond which purchasers of the share will not qualify for the declared dividend).
However, the eventual ex-dividend price may well reflect different expectations from
those ruling at the company financial year end.
Conversely, in an efficient capital market, share prices gradually increase as the
date of dividend payment approaches, so that, especially for companies that pay sev-
eral dividends each year, some distorting effect is always likely to be present. Our
practical advice is to take the ruling share price as the basis of calculation, but to mod-
erate the calculation according to whether a dividend is in the offing. For example, if
a 5p dividend is expected in two months’ time, a prospective fall in share price of 5p
should be allowed for. In our assessment, the error caused by using an out-of-date
share price is likely to outweigh that from using a valuation incorporating a forth-
coming dividend.
3 The calculation is at the mercy of short-term movements in share price
If, as many observers believe, capital markets are becoming more volatile, possibly
undermining their efficiency in valuing companies, the financial manager may feel
disinclined to rely on current market prices. Managers are generally reluctant to
accept the EMH and commonly assert that the market undervalues ‘their compa-
nies’. However, there remains a need for a benchmark return to guide managers.
One might examine, over a period of years, the actual returns received by share-
holders in the form of both dividends and capital gains. One way of conducting such
a calculation is to focus on average annual rates of return, based on the analysis
adopted in Chapter 10, based on the rather artificial assumption of a one-year hold-
ing period. You are advised to re-examine Table 10.1 and to digest the wild swings
in annual returns. These are a clear indication of the risk involved in short-term
equity investment.
k
e
,
CFAI_C11.QXD 10/26/05 11:38 AM Page 274