Morris & Fan. Reservoir Sedimentation Handbook
Подождите немного. Документ загружается.


FLUVIAL MORPHOLOGY AND SEDIMENT SAMPLING 8.37
Table 8.5 Areal Weight to Grid Count Conversion
Size
d,
mm
Percent
finer
Retained
weight
W, %
Geometric
mean dia.
d (mm) W/d
W/d as
percent
Percent
finer
(1) (2) (3) (4) (5) (6) (7)
87 100 100
62 97 3 73.0 0.041 0.9 99.1
45 81 16 53.0 0.302 6.5 92.7
32 58 23 38.5 0.597 12.8 79.9
23 38 20 27.5 0.727 15.6 64.3
16 21 17 19.5 0.872 18.7 45.7
12 8 13 14.0 0.929 19.9 25.8
8 3 5 10.0 0.500 10.7 15.1
5.8 2 1 6.8 0.147 3.1 12.0
4 1.5 0.5 4.8 0.104 2.2 9.7
2.8 0 1.5 3.3 0.455 9.7 0.0
Sum 4.674
Source: Kellerhals and Bray (1971).
grain size in column 6, from which the corrected grain size distribution in column 7 is
computed.
8.10 SOURCES OF ERROR
In establishing or evaluating a suspended-sediment monitoring program to address
problems of engineering design, operation, or environmental impact, two types of
questions must be asked:
1. What are the temporal characteristics of concentration, load, and particle size
distribution needed for the design?
2. How well does the existing or proposed sampling program document these
characteristics?
This section discusses some of the sources of error which must be considered in
designing or evaluating a sediment monitoring program.
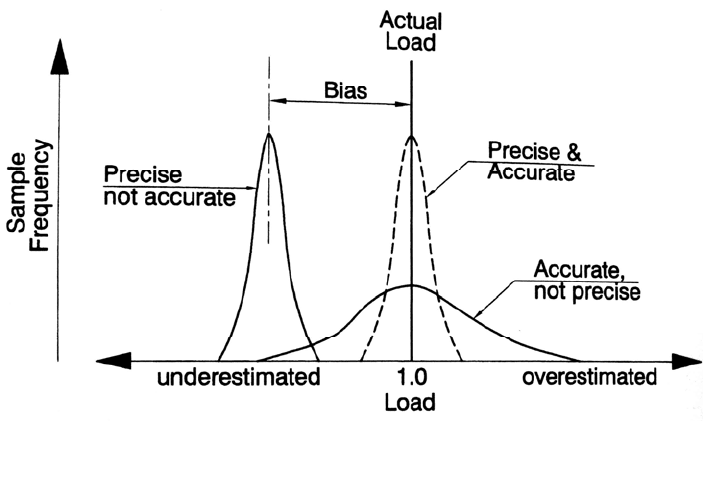
8.10.1 Sampling Precision and Accuracy
In discussing sampling procedures, the difference between the concepts of precision and
accuracy should be understood. The term precision refers to the repeatability of
measurements. If procedures are precise, the errors in each procedure will occur in a
consistent manner, making it possible to subsequently apply correction factors to offset
the systematic bias, if it can be quantified. For example, two types of sampling equipment
operated side by side may obtain consistently repeatable values but have different means,
making it possible to apply a correction factor to offset the bias between the samplers.
Accuracy refers to how well the measurement reflects the characteristic that is being
monitored; precise and repeatable measurements are not necessarily accurate measures of
conditions in the stream cross section. Thus, precise measurements of suspended solids
FLUVIAL MORPHOLOGY AND SEDIMENT SAMPLING 8.38
FIGURE 8.17 Comparison of the concepts of precision and accuracy for measurement of
sediment load.
concentration at the water surface will not be an accurate indicator of the total load in a
sand-bed river. The concept of precision and accuracy is illustrated in Fig 8.17, which
shows hypothetical histograms of a population of samples taken to estimate sediment
load.
8.10.2 Sampling Equipment
The first potential source of error is the sampling equipment itself. How well does the
sampler measure the ambient concentration? Sampling accuracy for suspended sediment
samplers is dependent on achieving isokinetic sampling velocities; the water velicity
entering the sampling intake should be within 3 to 5 percent of the ambient stream
velocity. Intake and exhaust tube diameters and lengths are sized to achieve this
condition, and use of nozzles designed for one sampler on a different sampler will
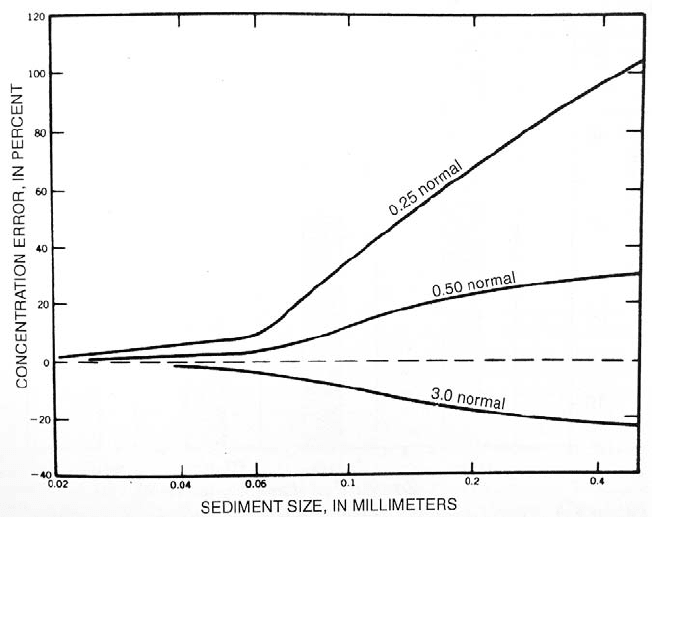
produce errors, as will the use of bent or damaged nozzles. The point sampling errors
caused when nozzle intake velocity deviates from the ambient velocity affects primarily
the sand size material, and increases as particle diameter increases (Edwards and
Glysson, 1988). See Fig 8.18. Although standardized dimensions have been established
for suspended and bed load samplers, not all samplers use the same materials, and
variances can occur in some critical dimensions. Each sampler should be calibrated to
guarantee performance. Each sampler manufactured for the Federal Interagency
Sedimentation Program is flume-calibrated, but many commercial samplers are not.
materials, and
variances can occur in some critical dimensions. Each sampler should be calibrated to
guarantee performance. Each sampler manufactured for the Federal Interagency
Sedimentation Program is flume-calibrated, but many commercial samplers are not.
Gurnell et al. (1992) compared the intake of an ISCO pumped sampler to a USDH41
hand sampler, both placed side by side at a stationary point in the stream. The ISCO
nozzle orientation was not reported. It was concluded that the ISCO sampler provided
unbiased estimates of suspended sediment concentration in comparison with the USDH48
sampler. As discussed in Sec. 8.3, nozzle orientation has a large influence on sampling,
and can influence both the total concentration and the grain size entrained in a pumped
sampler. The potential for error due to nozzle orientation increases as a function of grain
size.
Suspended-load measurements collected by depth-integrated isokinetic sampling at
multiple profiles represents the most accurate standard against which all other suspended
FLUVIAL MORPHOLOGY AND SEDIMENT SAMPLING 8.39
FIGURE 8.18 Deviation in sediment concentration as a function of grain size when intake
velocity is 0.25, 0.50, and 3.0 times stream velocity (Guy and Norman, 1970). Most of the erro
r
occurs in the sand size range.
-sed
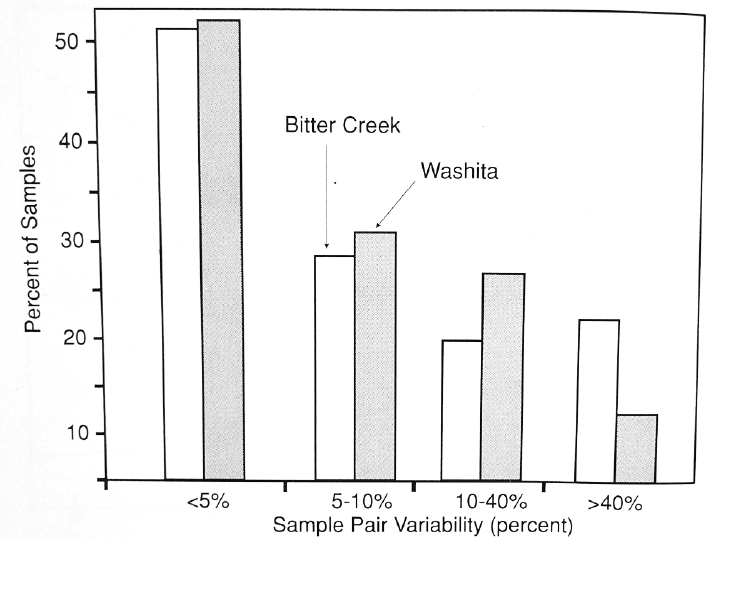
iment sampling methods are calibrated. What is the repeatability of the manually
collected depth integrated samples? Allen and Petersen (1981) examined the variability
of suspended sediment concentration by taking paired equal-transit-rate samples on two
Oklahoma streams. The smaller of the two, East Bitter Creek (18 m wide, 3 m deep
bankfull), drains 91 km
2
and transports primarily silt and clay. Washita River (55 m wide,
5 m deep bankfull) drains 12,410 km
2
and transports about 30 percent sand. Two sources
of sampling error overshadowed all others and both increased sample concentration. The
first problem was associated with dipping the sampler nozzle into the streambed; it was
caused by an irregular bottom (dunes), excessive downward transit velocity, soft bed, and
ploughing into the bed when travel reversal caused the sampler to move upstream. The
second problem occurred when the operator was late in reversing the sampler's travel,
allowing it to linger in the zone of maximum sediment concentration near the bed. The
variability between paired samples was larger for relatively inexperienced operators than
for experienced, and also increased as a function of river stage. The variability between
sample pairs for measurements at high stage are summarized in Fig. 8.19.
8.10.3 Number of Sampling Points
The most accurate measurements of sediment load are obtained if depth-integrated
verticals are used across a stream. However, because each additional vertical represents a
FLUVIAL MORPHOLOGY AND SEDIMENT SAMPLING 8.40
FIGURE 8.19 Variation in suspended sediment concentration resulting from paired sampling in
two Oklahoma rivers using depth integrated samplers (Allen and Peterson. 1981).
significant increase in manual sampling effort and additional samples to transport and
analyze in the laboratory, it is desirable to minimize the number of samples collected. In
the case of automatic equipment the sample will be withdrawn from only a single point
on the cross section. What magnitude of error may be associated with the use of a
reduced number of sampling points within a cross section?
The error introduced by reducing the number of verticals can he determined only by
field measurements in each individual stream, since the horizontal distribution of
sediment transport is unique to each cross section. From repeated sampling at multiple
verticals, it may be found that one of the verticals consistently represents the mean
characteristics of the entire stream. The suitability of an abbreviated sampling technique
must be verified by conventional sampling techniques using multiple verticals, and these
calibrations should be repeated periodically and after any large discharge that could alter
the channel configuration. Particular care must be exercised to adequately sample large
runoff events, since the transport of coarse material can increase greatly in these events
and an abbreviated sampling protocol developed for low-flow conditions may not he
representative of large discharges.
The magnitude of the error introduced by variations in the sampling protocol will be
largest in streams having a large load of coarse sediment. In streams transporting very
fine material that is uniformly distributed through the water column, and when the
sampling location has sufficient turbulence to generate concentration profiles which are
essentially uniform both horizontally and vertically, point samples can he representative
of the mean concentration of fines within the stream.
Can midstream samples at or near the surface be substituted for depth-integrated or 60
percent-depth samples? This question may arise in rivers without sand transport, in
sampling for water-quality constituents or contaminants that are associated with fine
sediment, and during floods when deeper sampling may be made impossible by high
FLUVIAL MORPHOLOGY AND SEDIMENT SAMPLING 8.41
velocity and floating debris. Yuzyk et al. (1992) analyzed results of 436 vertical
measurements from six sites on four major Canadian river systems and found that the
midstream near-surface sample was within ± 15 percent of the vertical mean 89 percent
of the time at five of the six stations sampled, with the tendency to undercount by about
10 percent. Data from the verticals showed that the concentrations of silts and clays
commonly displayed inconsistent and variable patterns of concentration within the cross
section, and at four of the six sites, the error in the clay fraction was greater than the error
in the silt fraction. An inconsistent vertical variation in the concentration of fines is also
evident in Fig. 8.8.
8.10.4 Laboratory Error
Errors may be introduced during the handling, splitting, and laboratory analysis of
samples. The differences in dry suspended-sediment weights determined with fast-
filtering Whatman 40 (8-µm retention) and Millipore 0.45-µm papers was examined by
Gurnell et al. (1992) on glacial discharge, who found that, as suspended-solids
concentration decreased, the error increased, from 1 percent at 1000 mg/L to 4 percent at
400 mg/L.
Probably the greatest potential for error occurs when sample splitting is performed.
Splitting is normally not required from pumped or single-transit depth-integrated
samples. However, in deep rivers large sample volumes may result and it may be
necessary to split the composited sample. Yuzyk et al. (1992) concluded that, when
suspended sediment samples contain rapidly settling sands, it is not possible to obtain a
representative subsample of a larger suspended-sediment sample, even when vigorous
mixing procedures are used, and errors on the order of 50 percent can be produced. This
sample splitting problem affects only suspended coarse particles, not fines. Chapel and
Larsen (1996) compiled information on sample splitting. In general they found that both
churn and cone splitters produced errors on the order of about 3 to 6 percent for fines, but
more typically in the 15 to 30 percent range for sands, with the splitting error increasing
as a function of grain size within the sand size class. Sample splitting is also a potentially
large source of error in the preparation of bed material for sieving.
Water chemistry greatly affects flocculation, which in turn controls the settling rate of
clays and the apparent grain diameter when computed as the sedimentation diameter. It is
always necessary to determine beforehand whether the suspended sediment samples
should be analyzed in native water or by using a dispersant, and the results should be
clearly marked as to the procedure used to aid in the subsequent interpretation of the
resultant grain size distribution.
8.10.5 Rating Curves
Sediment concentration is poorly correlated to discharge, and sediment rating curves
typically exhibit a high degree of scatter; suspended-sediment concentration in some
streams varies by nearly 3 orders of magnitude at a given discharge. However, the
product of the rating curve and a discharge time series can be used to accurately estimate
the total load over a long period of time, provided that rating curves are constructed from
a dataset that includes both the rising and falling limbs of large discharge events, and for
storms in all seasons of the year. A rating curve constructed from an incomplete dataset
should not be presumed to be correct.
Rating curves are frequently extended beyond the range covered by data, since
historical or synthetic discharge datasets often include discharges much larger than the
maximum sampled during the fluvial monitoring program. This extrapolation can be a
source of error and uncertainty, since a disproportionate amount of sediment can be
transported by extreme discharge events. Rating curve extrapolation should be based on

FLUVIAL MORPHOLOGY AND SEDIMENT SAMPLING 8.42
characteristics of similar streams for which a more complete dataset is available, and the
maximum suspended sediment concentrations resulting from extrapolation should be
checked for reasonableness.
Sediment load can be seriously underestimated when rating-type relationships are
applied without regard to the time base of the underlying dataset. A rating curve based on
instantaneous concentration-discharge data pairs should not be applied to average daily
discharge values, except when concentration changes so slowly that an instantaneous
value indeed approximates the daily average concentration. If average daily discharge
data are to be used to compute load, the rating curve should also be constructed from
daily loads and mean daily discharges.
8.10.6 Sampling Frequency and Computational Error
The most severe and pervasive problem with sampling protocols is the failure of the
sampled dataset to represent the full range of rapidly fluctuating sediment concentration.
Use of turbidity to gage suspended-sediment concentration is gaining favor, despite its
inherent drawbacks, because it allows the variation in sediment concentration to be
tracked continuously. In essence, the large error introduced by having no data during
most of the monitoring period is replaced by a smaller correlation error between turbidity
and suspended solids
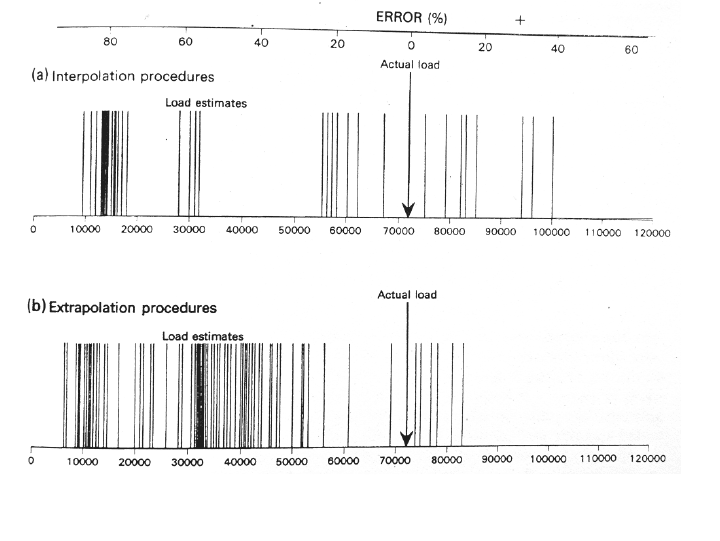
Walling and Webb (1981, 1988) used continuous turbidity measurements to monitor
actual load in River Creedy, United Kingdom. Nearly 100 independent load estimates
were also made for the same period by selecting data subsets to represent alternative
periodic sampling strategies, simulating manual sampling at either regular or irregular
intervals. including increased sampling frequency during high-flow events. A variety of
indirect load-computation techniques based on both timewise interpolation and
extrapolation (rating curves) were applied to these data subsets. Sample data subsets for
the construction of rating curves of the form concentration = aQ
b
included regular
interval sampling plus regular intervals augmented with random sampling of higher
discharge events. Rating curves were constructed from the entire data subset, and also for
additional subsets to differentiate between seasons and rising and falling stages. The
resulting estimates of suspended sediment load over a 7-year period are compared in Fig.
8.20, illustrating the large error range associated with different combinations of sampling
frequency and computational method Discontinuous sampling techniques frequently
underestimated the 7-year sediment load by an average of 60 percent. This analysis
underscores the potential for traditional methods of collecting and analyzing suspended
sediment data to underestimate the actual yield, a theme echoed by many other
researchers. The largest errors corresponded to estimates of sediment loads during short
time periods. Some of the sediment discharge characteristics that create errors in
construction of sediment rating curves were illustrated in Fig. 7.5.
8.10.7 Bias in Curve Fitting
As described in Sec. 7.4.3, if data are log-transformed before a least squares fit of the
data, a negative bias will result.
8.11CLOSURE
Sediment sampling depends heavily on the investigator’s interpretation of the fluvial
environment and design and execution of a suitable to that environment. Sampling
FLUVIAL MORPHOLOGY AND SEDIMENT SAMPLING 8.43
FIGURE 8.20 Estimates of 7-year sediment load determined by different methods, compared to
the true load determined by continuous turbidity measurement (Walling and Webb, 1981).
Sampling design must take into consideration both economic constraints and practical
logistical problems, while ensuring quality control. The use of newer sampling
technologies involving turbidity monitoring and pumped samplers is strongly
encouraged, especially at remote sites and in less developed areas, since it can provide an
independent source of data useful for checking manually collected data under conditions
of possibly limited supervision and quality control. If two independent datasets produce
quite different results, this will signal the potential for data problems and the need for
more thorough analysis. As demonstrated in the Cachí case study (Chap. 19), continuous
turbidity monitoring for even a limited period can greatly enhance the reliability of
sediment load estimates by revealing variations in sediment concentration not detected
from intermittent manual sampling (see Fig. 19.8). The cost of implementing a proper
sediment sampling program is very small compared to the scale of engineering civil
works that may be affected by sediment, and given the potential for large errors in
sediment sampling and its long-term consequences to many types of engineered
structures, cost cutting in the area of data collection is a false economy.
Users of fluvial sediment data should find out as much as possible about the way the
data was collected, especially in areas where sampling protocols may not be standardized.
Even data provided by organizations such as the U.S. Geological Survey need to be
checked to ascertain that the available dataset includes large sediment-producing storms.
Did large storms occur during the sampling period, and were these storms adequately
sampled (rising and falling limbs), or was sampling at automatic stations abbreviated by
equipment malfunction or exhaustion of sample bottles? Problems of this nature are an
unavoidable part of a field data collection program, and when they occur they enter into
that analysis process loosely called "engineering judgment" that is required to properly
interpret the available data and apply it to design problems.

CHAPTER 9
HYDRAULICS OF SEDIMENT TRASPORT
This chapter briefly reviews hydraulic formulas for fluid flow in open channels and
several fundamental sediment computations. Reservoir sedimentation alters hydraulic
conveyance by changing both the cross section (by deposition) and vegetative growth on
the delta. The condition of incipient sediment motion is important in a variety of
problems associated with reservoir sedimentation. It is fundamental for scour and
armoring computations downstream of dams, for the evaluation of flushing flow releases
below dams to maintain spawning gravels, for determining conditions under which
sediment will be deposited or eroded, for the design of stable channels and protective
revetments crossing sediment deposits (e.g., for dam decommissioning), and as a
computational parameter in sediment transport equations. Several sediment transport
equations are briefly reviewed to provide an overview of the computation of bed material
transport, which is the basis for modeling activities.
The field of sediment transport is complex, and workers in this field should refer to
more comprehensive texts to better understand the computational basis. Yang (1996)
gives an overview and comparison of sediment transport theory and equations, including
a coherent presentation of the utilization of unit stream power as a unifying concept for
the analysis of a variety of transport phenomena. Julien (1995) gives a good coverage of
fundamental equations and applications, using an approach different from Yang. Chang
(1988) discusses sediment transport with a strong emphasis on the quantitative aspect of
fluvial processes and morphology of alluvial channels. Simons and Senturk (1992) and
ASCE Manual 54 (Vanoni, 1975), currently being updated, are extensive references
providing a general-purpose overview of the field of sedimentation engineering. Senturk
(1994) gives an extensive overview of dam and reservoir hydraulics and presents many
worked problems, but gives only limited treatment to sediment issues.
Special Conditions in Reservoirs. Many of the computational methods introduced in this
chapter are based on simplifying assumptions such as conditions of steady uniform flow
in prismatic channels, and have been developed to analyze cohesionless sediment.
Transport computations also assume that the exchange between the fluid and the bed has
reached equilibrium conditions. These conditions often do not apply in reservoirs.
During impounding, a reservoir cross section is not prismatic but increases moving
downstream. Flow is not uniform. Streams entering a reservoir are depositing sediment
load, thereby violating the assumption of equilibrium between the bed and fluid. In many
reservoirs, sediment deposits consist largely of cohesive sediments, which present a
special problem from the standpoint of sediment transport because of the difficulty in

HYDRAULICS OF SEDIMENT TRANSPORT 9.2
characterizing the erodibility of cohesive materials, especially since erodibility will vary
as a function of time, depth, and operating rule. Inflow into reservoirs receiving drainage
from small steep watersheds may be very unsteady. Flow stratification commonly occurs
in reservoirs. During flushing events, flow may become hyperconcentrated. Both inflow
and flushing procedures may involve a wide range of grain sizes, with clays through
gravels being eroded and transported simultaneously. Erosion processes within the
reservoir may be further influenced by processes such as meandering and bank failure,
which are not included in any mathematical formulation.
In summary, the sediment transport conditions associated with reservoirs are
extremely complex. Detailed analysis of many of these problems lies beyond present
knowledge, and only qualitative or rough quantitative estimates can be provided. Caution
should be used in the application of numerical techniques in either hand calculations or
computer models to ensure that the basic assumptions are not grossly violated by the
prototype system, and to be aware of the direction and potential magnitude of the error
introduced by the assumptions inherent to the computational techniques.
9.1 DEFINITIONS AND UNITS
In the International System of Units (SI), mass is measured in kilograms (kg). Weight is a
force, the product of mass and gravitational acceleration, and is expressed in terms of
newtons (1 N = 1 kgm/s
2
). A mass of 1 kg subject to a gravitational acceleration of 9.8
m/s
2
at the earth's surface has a weight of 9.8 Newtons, although it is customary to say
that it "weighs" one kilogram. However, for dimensional consistency weight must be
expressed in newtons for computational purposes. In the U.S. Customary System of units
[foot-pound-second (fps)], weight is measured in pounds and mass in slugs. Symbols and
units used in this chapter, other than coefficients, are defined below. The fps system units
are given in some instances for clarity.
A Area of the wetted hydraulic cross section (m
2
)
D Water depth (m)
d Particle diameter (m or mm). When subscripted, it refers to the size
on the grain size curve. Thus, d
90
refers to the diameter of the particle
larger than 90 weight-percent of the particles in the mixture.
F
Dimensionless shear stress or Shields parameter. Most authors use
the symbol * for this dimensionless parameter, which can lead to
confusion with the absolute value of bed shear, which is also denoted
by the letter .
G Specific gravity (dimensionless), the ratio of the density or specific
weight of solid, fluid, or mixture thereof, to the density or specific
weight of pure water at 4°C. The specific gravity of most sediment is
approximately 2.65.
g Gravitational constant, 9.81 m/s
2
or 32.2 ft/s
2
.
k Size of roughness elements (m)
P Perimeter of the wetted hydraulic cross section (m)
Q Total discharge (m
3
/s).
q Discharge per unit width (m
3
/s per meter of channel width).
R Hydraulic radius (m) computed as R = A/P. It may be conceptualized
as the average depth of flow over the frictional boundary. In a
HYDRAULICS OF SEDIMENT TRANSPORT 9.3
channel which is much wider than deep, the hydraulic radius is
closely approximated by the water depth and the assumption that R =
D is made frequently.
Re
= dU
*
/v Boundary or shear Reynolds number (dimensionless).
S Channel or water surface slope (m/m, dimensionless).
U
*
= (gRS)
1/2
= (/)
1/2
Shear velocity or friction velocity, is a measure of the intensity of
turbulent fluctuations (m/s).
V Mean flow velocity within a single vertical or across an entire cross
section, in which case V = Q/A (m/s).
v Local flow velocity at a particular point within a fluid (m/s).
VS Unit stream power, the time rate of energy dissipation per unit weight
of water computed as the product of mean velocity and slope. It has
units of (N•m/N)/s[(ft•lb/lb)/s], which simplifies to velocity. See
Appendix J.
V = (
DS)V Stream power or the rate of energy dissipation per unit of surface
area N•m/(m
2
•s) or ft
•lb/(ft
2
•s)]. Stream power may also be
expressed in terms of W/m
2
, where 1 W = 1 J/s = 1 N m/s. See
Appendix J.
=
g Specific weight (N/m
3
, lb/ft
3
). The specific weight of 1 m
3
of water
on the earth’s surface is (1000 kg/m
3
)(9.81 m/s
2
) = 9810 kg/(m
3
•s
2
) =
9810 N/m
3
. For G = 2.65, the specific weight of sediment is
2.65(1000 kg/m
3
)(9.81 m/s
2
)= 25,997 N/m
3
.
Viscosity or dynamic viscosity is a measure of a fluid's resistance to
deformation, expressed as the velocity gradient dv/dy produced by
shear stress , according to the relation =
(dv/dy). For water at
20°C, the value is 1.00×10
-3
N•s/m
2
. Values are tabulated in the
appendixes.
v =
/
Kinematic viscosity, the ratio of dynamic viscosity to fluid density
. For water at 20°C, the value is 1.00×10
-6
m
2
/s. Values are
tabulated in the appendixes.
Density or mass per unit volume (kg/m
3
, slugs/ft
3
).
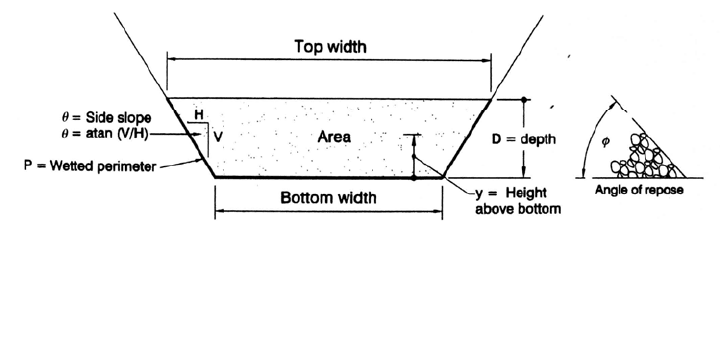
Angle of repose of sediment (degrees). See Fig. 9.1.
FIGURE 9.1 Definition sketch of geometric properties.