Mattingly J.D., Heiser W.H., Pratt D.T. Aircraft Engine Design
Подождите немного. Документ загружается.

266 AIRCRAFT ENGINE DESIGN
A general form of the enthalpy radial distribution equation is obtained by com-
bining Eqs. (iii) and (iv), giving
dht 1 ( du dv ~)
-- u + v + (8.22)
dr gc -~r -d-;r
This equation prescribes the relationship between the radial variation of the three
variables:
ht, u,
and v. The designer may specify the radial variation of any two,
and Eq. (8.22) allows the radial variation of the third variable to be determined.
For constant work,
htis
constant with respect to radius, and Eq. (8.22) becomes
du dv v 2
u ~rr + v ~rr + --r = 0 (8.23)
In this case, if the radial variation of either u or v is prescribed, Eq. (8.23) allows
the other to be determined. The traditional approach is to specify the swift velocity
v, as follows.
2) Swirl distributions:
We assume the following general swift distribution at entry and exit to the rotor
(F~) n (F-~) n
vl= a -b rm
and v2= a +b
rm
(8.24)
r r
where a and b are constants. From the Euler pump equation [Eq. (8.10)], the work
per unit mass flow is
ogr(v2 --
Vl)
2bogrm
Aht -- -- (8.25)
gc gc
which is independent of radius. The constant b in Eq. (8.24) is determined from
the enthalpy rise across the rotor using Eq. (8.25) and, as will be shown next, the
constant a in Eq. (8.24) is related to the degree of reaction at the mean radius
rm.
Three cases of the swirl distribution as considered next correspond to n = -1,
n =0, andn = 1.
Free vortex swirl distribution
(n = -1). Equation (8.24) becomes
vl = (a - b)
--rm
and
/9 2
=
(a + b)
--.rm
(8.26)
r r
Because v varies inversely with radius, this is known as "flee-vortex" flow. Thus,
if the stator airfoils preceding station 1 produce the flow
vlr = Vlmrm
and the
rotor airfoils modify the flow to
v2r = V2mrm
at station 2, then the Euler equation
confirms that this is a constant work. Furthermore, substitution of the free vortex
swirl distribution into Eq. (8.23) gives
du
--~0
dr
which requires that the axial velocity u not vary with radius. Equation (8.26) also
shows that, as long as r does not vary substantially from
rm
(say ± 10%), the airfoil
DESIGN: ROTATING TURBOMACHINERY 267
and flow properties will not vary much from the original mean-line design. Using
Eq. (8.8) for a repeating stage (v3 = Vl), the degree of reaction is given by
°Rc 1 a (~)2
= - (8.27)
o)r m
where the constant a in Eq. (8.26) is obtained by evaluating the preceding expres-
sion at the mean radius. Thus
a
= wrm
(1
-
°Rcm )
(8.28)
where
°Rcm
is the degree of reaction at the mean radius.
Free vortex aerodynamics played a prominent role in the history of turbomachin-
ery. Before high-speed computation became commonplace, this approach enabled
designers to understand and cope with the most prominent features of radial vari-
ation (see Refs. 3, 7, and 10).
Exponential swirl distribution (n = 0). Equation (8.24) becomes
Vl = a - b rm and
1) 2 =
a + b rm (8.29)
r r
Substitution of the exponential swirl distribution into Eq. (8.23) and integration
gives (Ref. 11)
uZ = uZm _ 2 (a21n r ab )
--
+ - ab (8.30a)
rm
u~ = uZm - 2 (a21n r ab )
rm
r/r~ + ab (8.30b)
For the case where Ulm = Uzm, the degree of reaction for a repeating stage
(V3 = V1) is given by (see Ref. 11)
a[
°Re = 1 + 1 - 2 (8.31)
o)r m
First-power swirl distribution (n = 1). Equation (8.24) becomes
r a r
vl=a---b rm and v2= +b rm (8.32)
rm
r
rm r
Substitution of the exponential swirl distribution into Eq. (8.23) and integration
gives (Ref. 11)
}
U 2
= U2m
--
2 a 2 -k- ab In r _ a2 (8.33a)
rm
}
U 2 = U2m
--
2 a 2 - ab In r _ a2 (8.33b)
rm
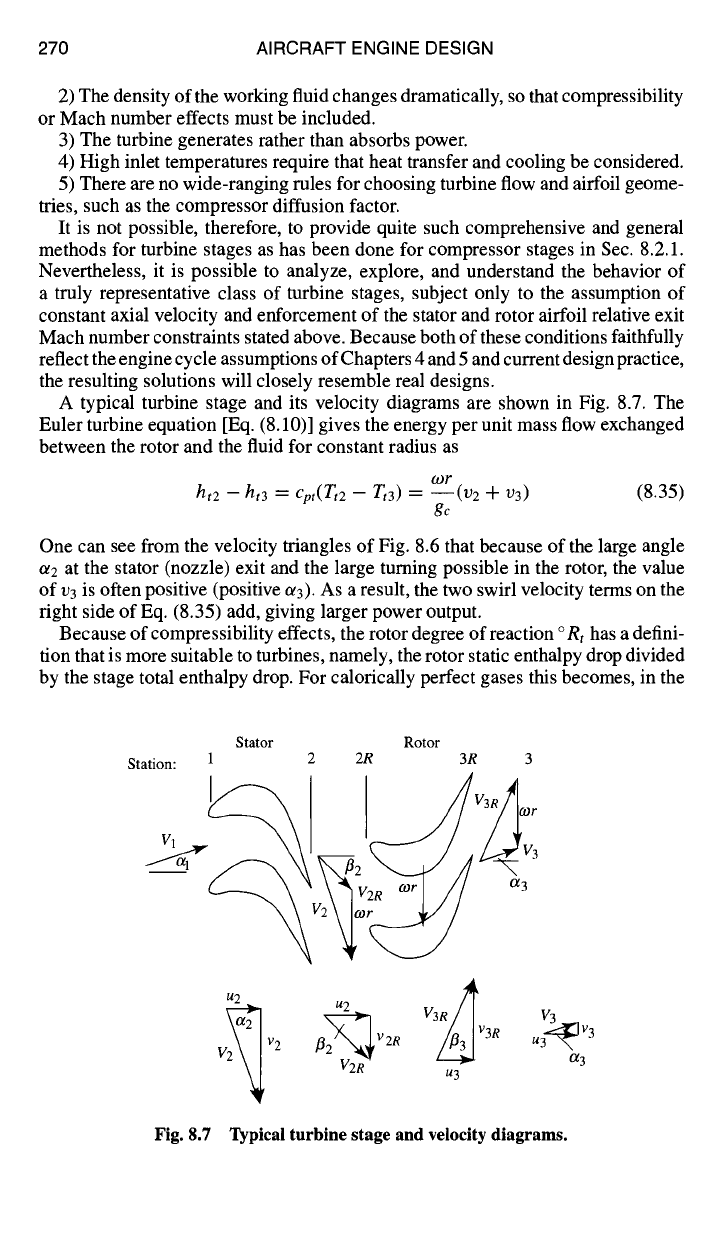
268 AIRCRAFT ENGINE DESIGN
0
0.5
1
0.5
First power _
Exponential ~
n
1
o
-1
r/r m
1.5
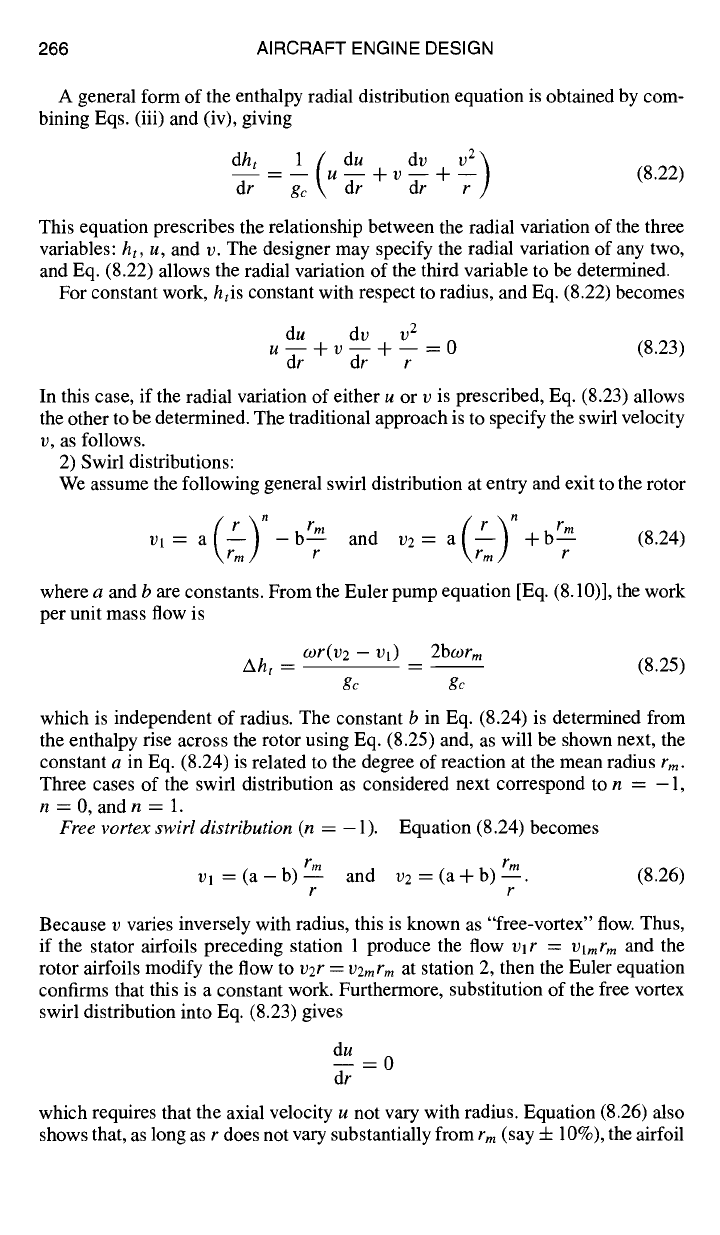
Fig. 8.6 Radial variation of the degree of reaction, u
For the case where
Ulm = bl2m ,
the degree of reaction for a repeating stage
(V3 = V1) is given by (see Ref. 11)
a { (rf~) }
°Rc
= 1 + 2 In - 1 (8.34)
O)F m
Equations (8.27), (8.31), and (8.34) give the radial variation of the degree
of reaction for the free-vortex, exponential, and first power swirl distributions,
respectively, for repeating stages (1/3 = 1/1) with
Ulm = Uzm.
The value of the
constant a is evaluated at the mean radius and is given by Eq. (8.28) for all three
cases.
Consider the case where the degree of reaction at the mean radius is 0.5 (a =
COrm~2).
Results for this case from Eq. (8.27), (8.31), and (8.34) are plotted in
Fig. 8.6 for the range 0.5 <
r/rm
< 1.5. These results show that it is more
difficult to design rotor airfoils at r <
rm
and stator airfoils at r >
rm.
In fact,
because
°Rc
----- 0 at
r/rm
= 0.707 for the free-vortex and at
r/rm
= 0.6065 for
the first-power swirl distributions, the rotor will actually experience accelerating
flow for smaller radii, whereas this is never the case for the stator. For these
reasons, modem compressor design has looked to non-free-vortex (nonconstant
work) machines, but these are absolutely dependent upon large computers for their
definition.
DESIGN: ROTATING TURBOMACHINERY 269
Table 8.1 Range of axial flow compressor design parameters
Parameter Design range
Fan or low-pressure compressor
A T, per stage
Pressure ratio for one stage
Pressure ratio for two stages
Pressure ratio for three stages
Inlet corrected mass flow rate
Maximum tip speed
Diffusion factor
High-pressure compressor
AT~ per stage
Inlet corrected mass flow rate
Hub/tip ratio at exit
Maximum rim speed at exit
Diffusion factor
Maximum exit temperature
60-100°F(35-55 K)
1.5-2.0
2.0-3.5
3.5-4.5
40-42 lbm/(s-ft 2)
[195-205 kg/(s-m2)]
1400-1500 ft/s
[427-457 m/s]
0.50-0.55
60-90°F (35-50 K)
36-38 lbm/(s-ft 2)
[175-185 kg/(s-m2)]
0.90-0.92
1300-1500 ft/s
[396-457 m/s]
0.50-0.55
1700-1800 ° R (945-1000 K)
The three swirl distributions have been incorporated into COMPR to allow you to
explore this method for improving the degree of reaction of your designs at small
radii. However, we recommend that you begin with the free-vortex distribution
because that is most frequently referred to in the open literature.
8.2.1.6 Range of compressor design parameters.
Table 8.1 contains
ranges of design parameters that can be used as guides in the preliminary design of
axial flow compressors. Additional information about the shape and construction
of axial flow compressors can be found by examining the AEDsys Engine Pictures
files.
8.2.2 Turbine Aerodynamics
8.2.2.1 Constant axial veloci~ adiabatic, selected Mach number,
mean-line stage design.
The primary goal of this section is to develop a realis-
tic
turbine stage performance model that will reveal the behavior of the important
aerodynamic and thermodynamic quantities and serve as an initial input to the com-
plete numerical calculations of TURBN. This is in the same spirit as Sec. 8.2.1,
but the design of turbines is different from that of compressors for a number of
reasons, including the following:
1) The engine cycle performance models of this textbook require that the turbine
stage entrance stator (a.k.a. inlet guide vane or nozzle) be choked and all other
stator and rotor airfoil rows be unchoked.
270 AIRCRAFT ENGINE DESIGN
2) The density of the working fluid changes dramatically, so that compressibility
or Mach number effects must be included.
3) The turbine generates rather than absorbs power.
4) High inlet temperatures require that heat transfer and cooling be considered.
5) There are no wide-ranging rules for choosing turbine flow and airfoil geome-
tries, such as the compressor diffusion factor.
It is not possible, therefore, to provide quite such comprehensive and general
methods for turbine stages as has been done for compressor stages in Sec. 8.2.1.
Nevertheless, it is possible to analyze, explore, and understand the behavior of
a truly representative class of turbine stages, subject only to the assumption of
constant axial velocity and enforcement of the stator and rotor airfoil relative exit
Mach number constraints stated above. Because both of these conditions faithfully
reflect the engine cycle assumptions of Chapters 4 and 5 and current design practice,
the resulting solutions will closely resemble real designs.
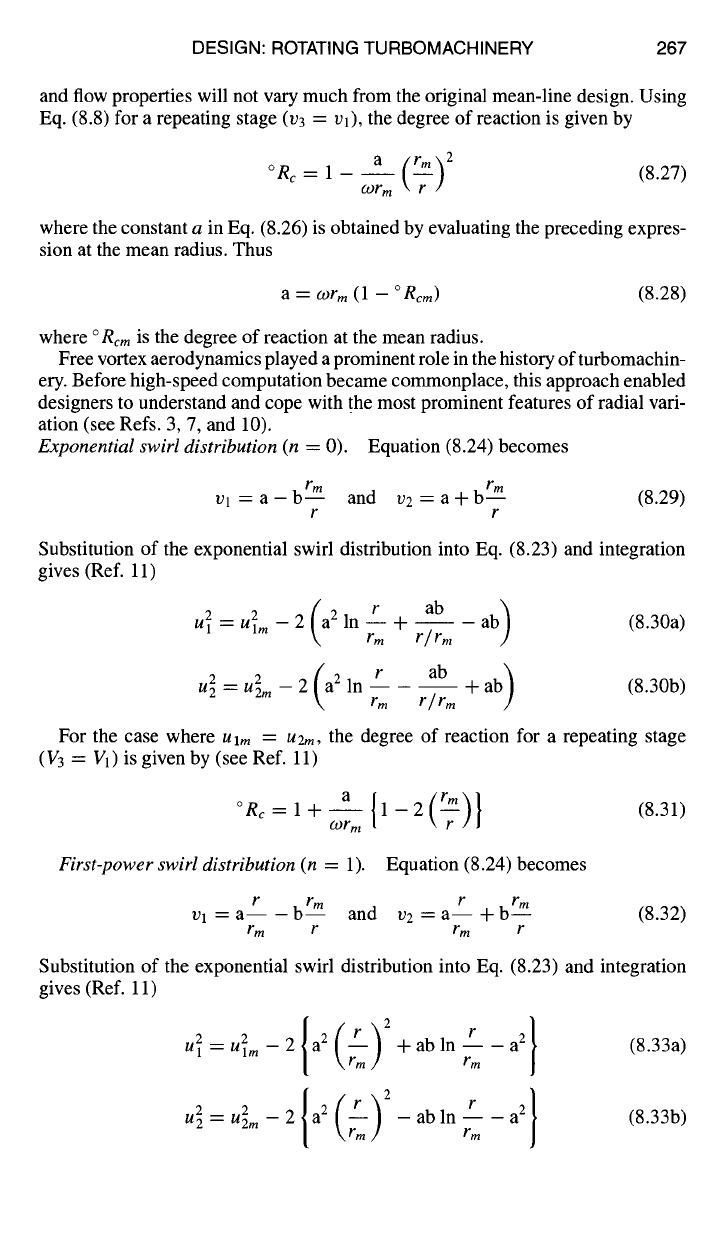
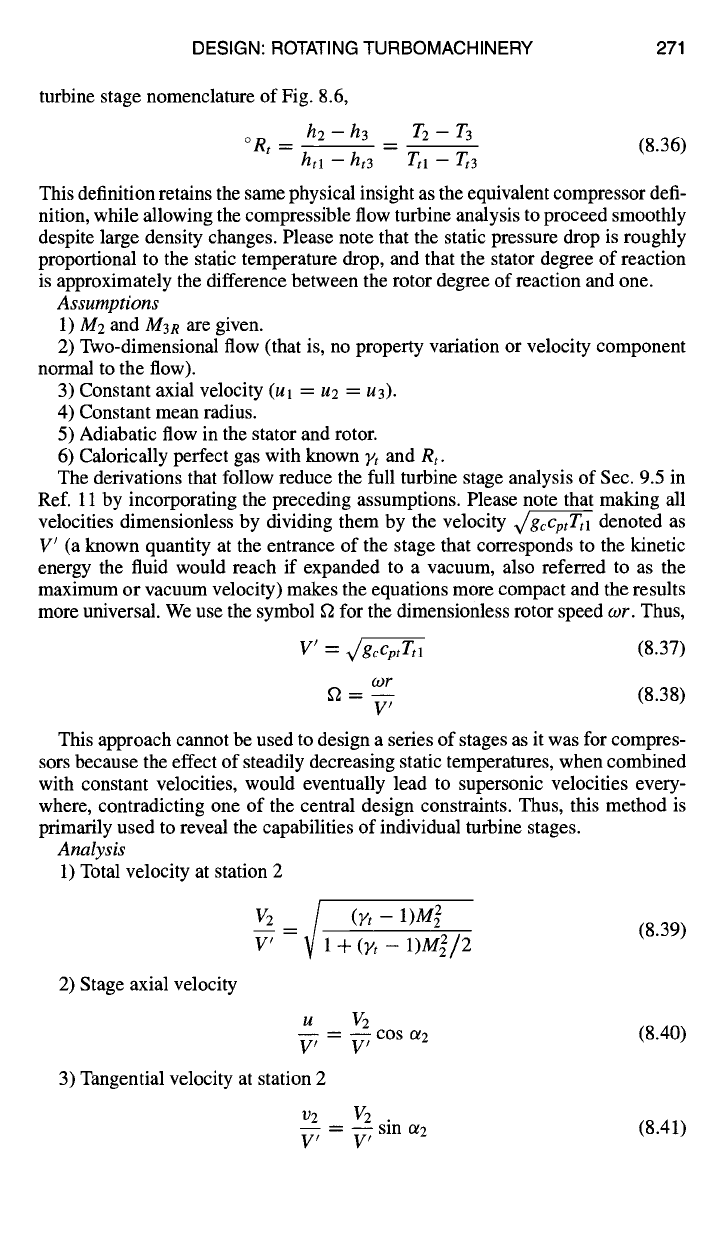
A typical turbine stage and its velocity diagrams are shown in Fig. 8.7. The
Euler turbine equation [Eq. (8.10)] gives the energy per unit mass flow exchanged
between the rotor and the fluid for constant radius as
(.or
ht2 - hi3 : Cpt(Zt2 - Zt3) :
--(1)2 --I- 1)3)
(8.35)
gc
One can see from the velocity triangles of Fig. 8.6 that because of the large angle
a2 at the stator (nozzle) exit and the large turning possible in the rotor, the value
of v3 is often positive (positive or3). As a result, the two swirl velocity terms on the
right side of Eq. (8.35) add, giving larger power output.
Because of compressibility effects, the rotor degree of reaction
°
Rt has a defini-
tion that is more suitable to turbines, namely, the rotor static enthalpy drop divided
by the stage total enthalpy drop. For calorically perfect gases this becomes, in the
Stator Rotor
Station: 1 2 2R 3R 3
V 1~~ /V3R/~°Jr
u2 u 2 V3R~
V2~ ~'~2~V2R v 2R V3R
v 2
u3
u V3
Fig. 8.7 Typical turbine stage and velocity diagrams.
DESIGN: ROTATING TURBOMACHINERY 271
turbine stage nomenclature of Fig. 8.6,
h2 - h3 T2 - T3
° Rt -- htl -
ht-------~3 -- Ttl
-- Tt3 (8.36)
This definition retains the same physical insight as the equivalent compressor defi-
nition, while allowing the compressible flow turbine analysis to proceed smoothly
despite large density changes. Please note that the static pressure drop is roughly
proportional to the static temperature drop, and that the stator degree of reaction
is approximately the difference between the rotor degree of reaction and one.
Assumptions
1) M2 and MaR are given.
2) Two-dimensional flow (that is, no property variation or velocity component
normal to the flow).
3) Constant axial velocity (ul = u2 = u3).
4) Constant mean radius.
5) Adiabatic flow in the stator and rotor.
6) Calorically perfect gas with known Yt and
Rt.
The derivations that follow reduce the full turbine stage analysis of Sec. 9.5 in
Ref. 11 by incorporating the preceding assumptions. Please note that making all
velocities dimensionless by dividing them by the velocity gv/~cptTtl denoted as
V' (a known quantity at the entrance of the stage that corresponds to the kinetic
energy the fluid would reach if expanded to a vacuum, also referred to as the
maximum or vacuum velocity) makes the equations more compact and the results
more universal. We use the symbol f2 for the dimensionless rotor speed
wr.
Thus,
V' = v/~cptTtl
(8.37)
o)?"
f2 - (8.38)
W
This approach cannot be used to design a series of stages as it was for compres-
sors because the effect of steadily decreasing static temperatures, when combined
with constant velocities, would eventually lead to supersonic velocities every-
where, contradicting one of the central design constraints. Thus, this method is
primarily used to reveal the capabilities of individual turbine stages.
Analysis
1) Total velocity at station 2
V2 _ / (gt -
1) M2
~7 -- Vl + (Yt - 1)/2/2 (8.39)
2) Stage axial velocity
u V2
-- COS Ot 2
W V'
3) Tangential velocity at station 2
(8.40)
V~
= ~ sin
Ct 2
(8.41)
V' W
272 AIRCRAFT ENGINE DESIGN
4) Rotor relative tangential velocity at station 2
V2R V2
W W
5) Rotor relative flow angle at station 2
I)2R / V I
tan
f12 -- --
u/V'
6) Rotor relative total temperature
Tt2RTtl
_ l.nt_~2 (~ v2~g')
7) Rotor relative flow angle at station 3
/Tt2R/Ttl (Vt- 1)M2R
tan f13 =V
u2/V'2 1 +--~t --1-~3n/2 - 1
8) Rotor flow turning angle
= f12 + f13
9) Tangential velocity at station 3
l) 3
V I
10) Stage exit flow angle
tan ot 3 --
11) Static temperature at station 3
U
-- - -- tan f13 -
f2
V'
v3 / V'
u/V'
T3 Tt2 R / Tt l
Ttl 1 .Jr_ ()It -
1)M2R/2
12) Stage temperature ratio
Tt3
rts--
Ttl
13) Rotor degree of reaction
T 3 b/2
1 + tan 2 c~3
+
Ttl V '2
2
°gt -- V2R -- V2R
2(1 - rt,)V 'e
14) Rotor solidity based on axial chord
Cx
S
2COS 2/33(tan
/~2 +
tan
/~3)
(8.42)
(8.43)
(8.44)
(8.45)
(8.46)
(8.47)
(8.48)
(8.49)
(8.50)
(8.51)
Crxr -- (8.52)
Cx Z
DESIGN: ROTATING TURBOMACHINERY 273
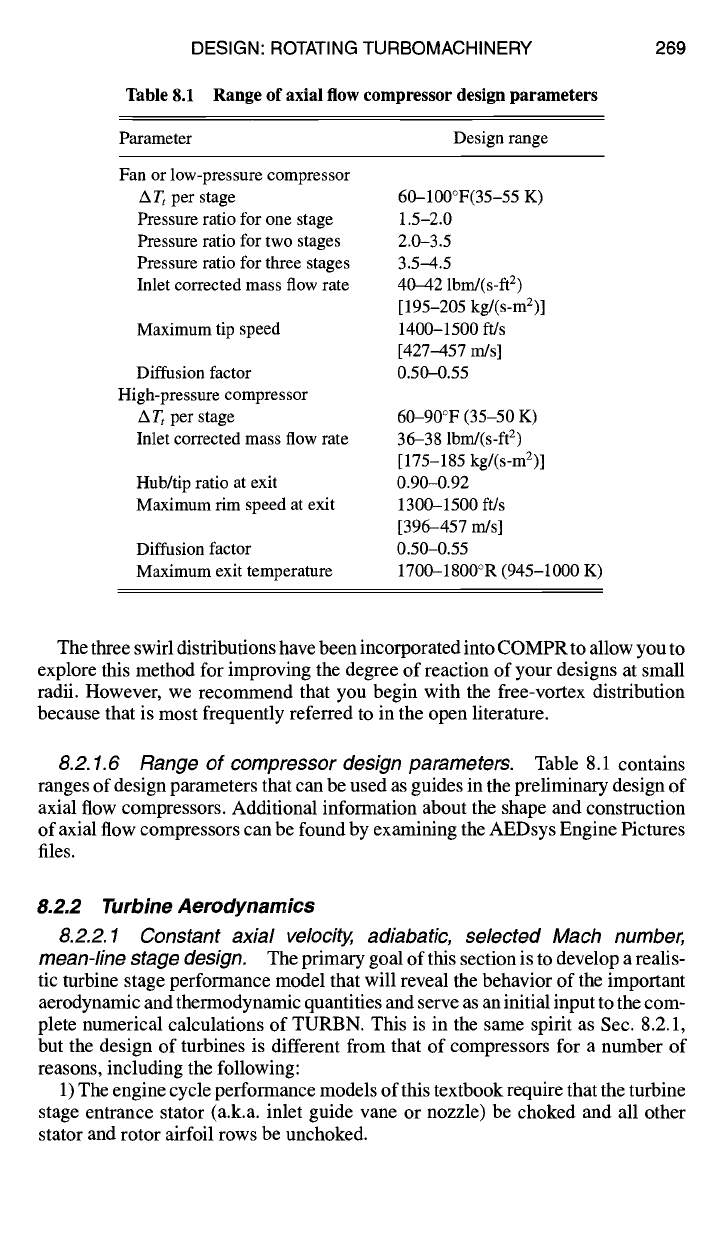
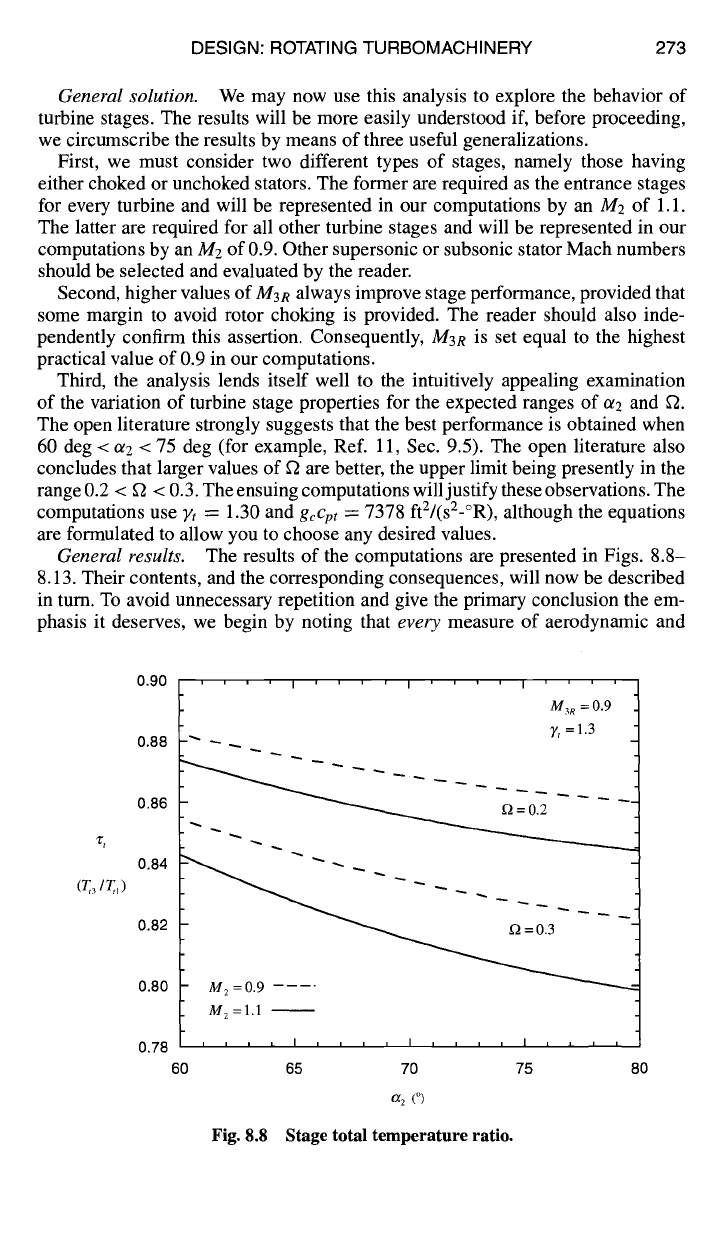
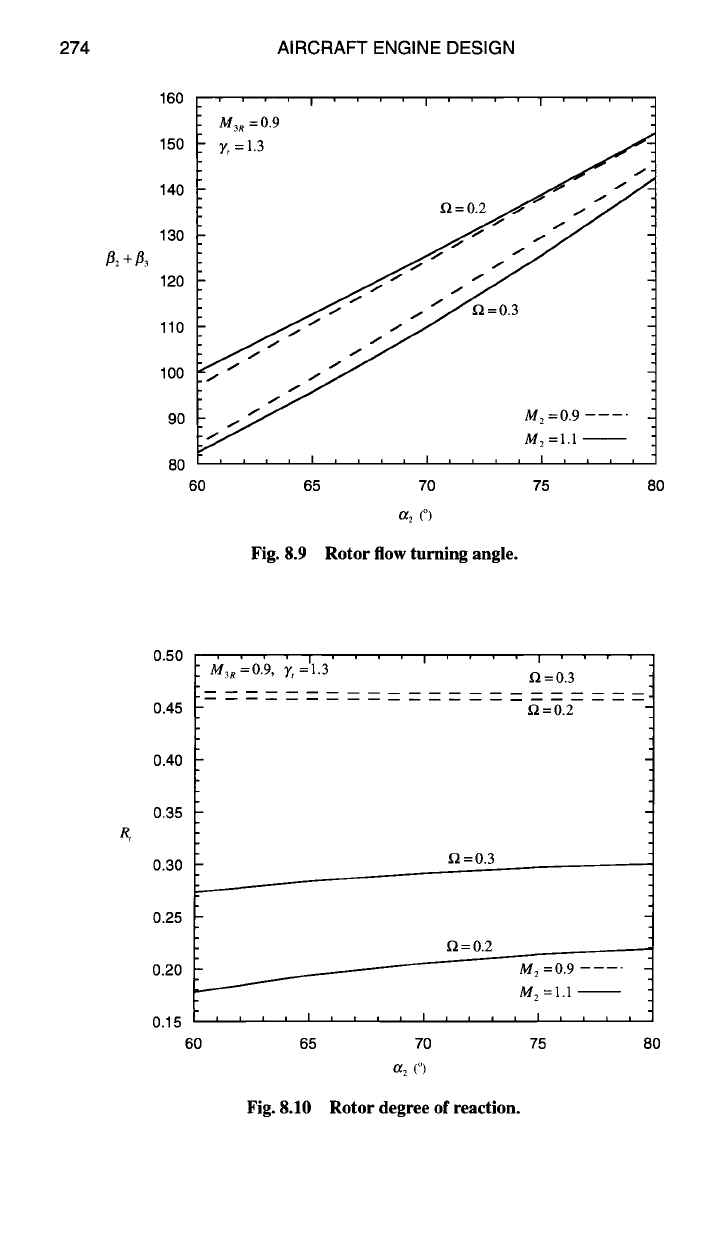
General solution.
We may now use this analysis to explore the behavior of
turbine stages. The results will be more easily understood if, before proceeding,
we circumscribe the results by means of three useful generalizations.
First, we must consider two different types of stages, namely those having
either choked or unchoked stators. The former are required as the entrance stages
for every turbine and will be represented in our computations by an M2 of 1.1.
The latter are required for all other turbine stages and will be represented in our
computations by an M2 of 0.9. Other supersonic or subsonic stator Mach numbers
should be selected and evaluated by the reader.
Second, higher values of
M3R
always improve stage performance, provided that
some margin to avoid rotor choking is provided. The reader should also inde-
pendently confirm this assertion. Consequently, M3R is set equal to the highest
practical value of 0.9 in our computations.
Third, the analysis lends itself well to the intuitively appealing examination
of the variation of turbine stage properties for the expected ranges of ~2 and ~.
The open literature strongly suggests that the best performance is obtained when
60 deg < oe2 < 75 deg (for example, Ref. 11, Sec. 9.5). The open literature also
concludes that larger values of f2 are better, the upper limit being presently in the
range 0.2 < g2 < 0.3. The ensuing computations will justify these observations. The
computations use ~,'t = 1.30 and
gcCpt =
7378 ft2/(s2-°R), although the equations
are formulated to allow you to choose any desired values.
General results.
The results of the computations are presented in Figs. 8.8-
8.13. Their contents, and the corresponding consequences, will now be described
in turn. To avoid unnecessary repetition and give the primary conclusion the em-
phasis it deserves, we begin by noting that
every
measure of aerodynamic and
0.90
0.88
0.86
0.84
(~,~ / ~,,
)
0.82
0.80
0.78
60
' ' ' ' I ' ' ' ' I ' ' ' ' I ....
M3R = 0.9
.~ 7, = 1.3
_ f2 = 0.2
M 2 =1.1 --
, , , , I , , , , I , , , , I , , i
65 70 75
1~2 (o)
i
80
Fig. 8.8 Stage total temperature ratio.
274 AIRCRAFT ENGINE DESIGN
160
150
140
130
120
110
100
90
80
60
M3R'
' = o9'
'
i , , ,
, I ' ' ' ' I ' ' ' ' t
o
i.~ "~ M: = 0.9 ....
M 2 =1.1 --
I I I I I I I I I I I I I I I I I I I
65 70 75 80
a: (%
Fig. 8.9 Rotor flow turning angle.
R,
0.50
0.45
0.40
0.35
0.30
0.25
0.20
0.15
60
' ' ' ' I ' ' ' ' I ' ' ' ' I '
M3R
=0.9,
y,
=1.3 f~=0.3
~=0.2
~=0.3
~2=0.2
M 2 = 0.9 ....
M~ =l.l --
, , , , I , , , , I , , , , I , , ,
65 70 75
a2 C)
Fig. 8.10 Rotor degree of reaction.
80
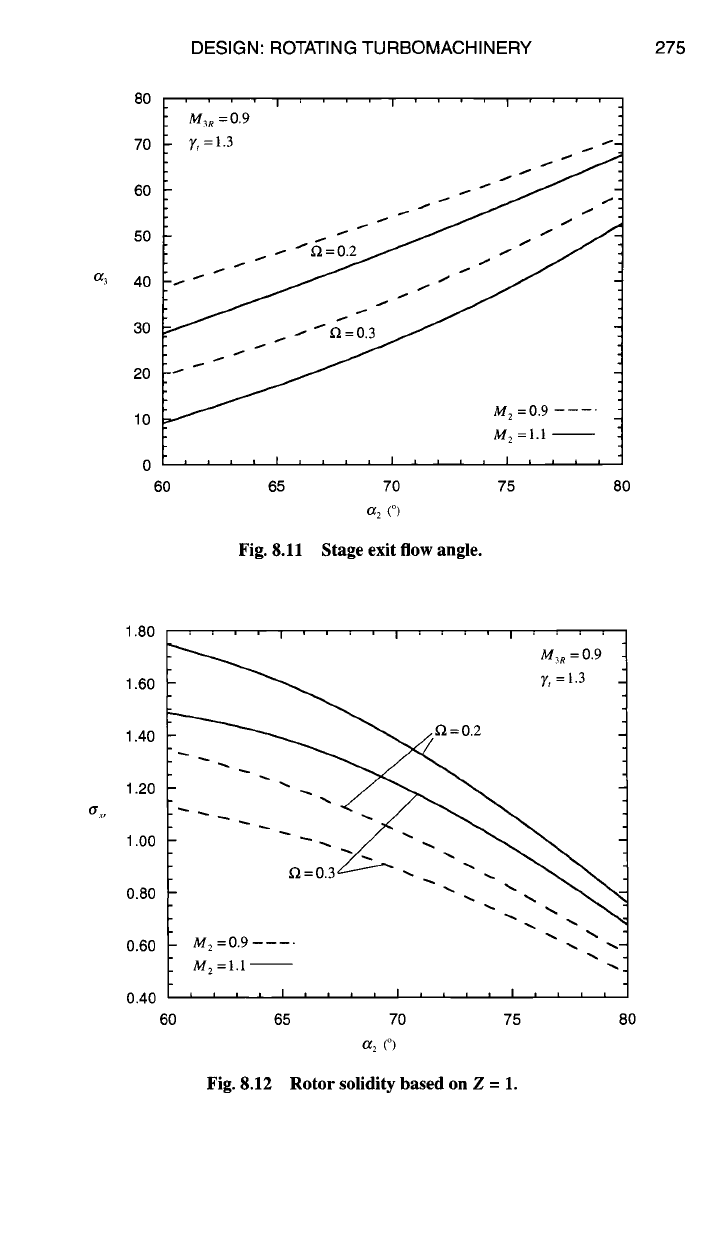
DESIGN: ROTATING TURBOMACHINERY 275
80
70
60
50
a3 40
30
20
10
0
60
M~=o9 ' .... ' .... '
.... t
= 1
M 2
=1.1 --
, , , ,
I
, , , , I , , , , I i J i
i
65 70 75 80
a 2 (°)
Fig. 8.11 Stage exit flow angle.
a~r
1.80
1.60
1.40
1.20
1.00
0.80
0.60
0.40
60
' ' ' ' I ' ' ' ' I ' ' ' ' I ' ' ' '
M3R = 0.9
~ y, =1.3
M 2
=0.9 .... "" -.. ~ ~-"
M 2 = 1.1 -- "~.
65 70 75 80
a2 (o)
Fig. 8.12 Rotor solidity based on Z = 1.