Liu A.L., Tien H.T. Advances in Planar Lipid Bilayer and Liposomes. V.6
Подождите немного. Документ загружается.

The parameters are defined in Appendix B.1, the values used are presented in
Tabl e 6 . For the membrane conductivity s
m
¼½1:4 3:510
5
and inserting
values of parameters (see Ta ble 6 ) we obtain for fraction of transient pores after 100 s
pulse being f
p
¼ 10
5
10
4
: Conductivity changes calculated theoretically taking
into account the nonohmic behavior of the conductivity inside the pore using
equation (46) are in good agreement with measured increase in conductivity during
the pulses [125].
In Fig. 28, it is demonstrated that the conductivity changes relax almost to initial
level in ten milliseconds (100 Hz) and after 1 s the following pulses have almost
identical shape as the first pulse. This indicates that during electric pulses short-lived
structural changes are formed which transiently increase ion permeation, but have
very short lifetime after the pulses.
0 0.5 1 1.5 2
0
0.05
0.1
0.15
0.2
0.25
E [kV/cm]
Δσ
N
tran
/σ
0
reference
N = 1
N = 2
N = 4
N = 8
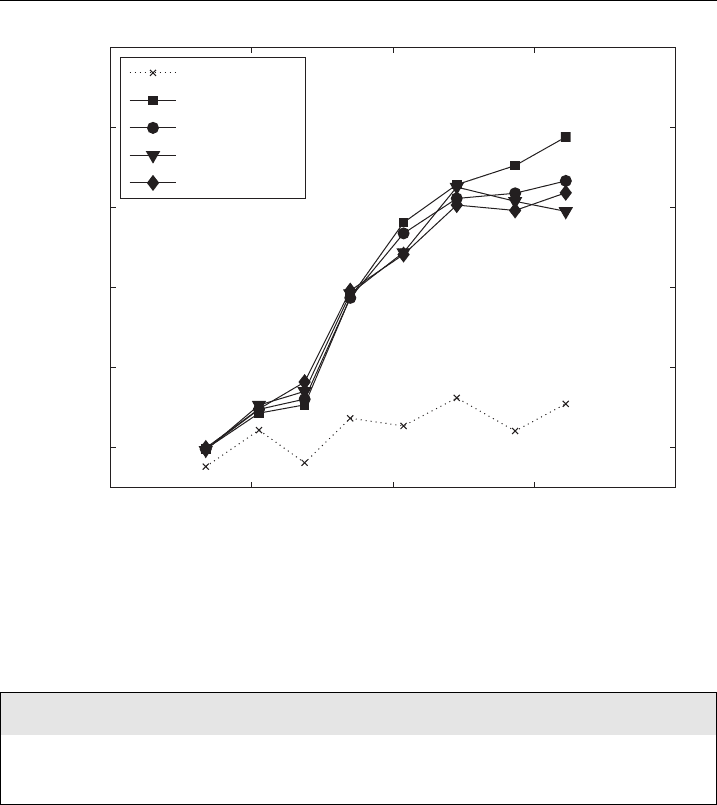
Figure 27 Trans ient conductivity changes dur ing N-th pulse of t he train of 8 100 ms pulses are
show n. Ds
N
tran
is normalized to the i nitial conductivity. Solid line-cells in medium, dotted line-
reference meas urement on medium without cells dur ing the ¢rst pulse.
Table 6 Calculation of conductivity inside the aqueous pore – values of used parameters.
Ne/kT s
i
U
m
RD
0.15 40 V
1
0.5 S/m 900 mV 9.5 mm5nm
EE
c
W
0
rs
m
D
0.84 kV/cm 0.5 kV/cm 2.5–5 0.22–0.57 1.4–3.5 10
5
S/m 2.5 10
5
cm
2
/s
M. Pavlin et al.204
Altogether the conductivity measurements enable detection of short-lived per-
meable structures which are formed during the pulses. However since the con-
ductivity drops to initial level in milliseconds after the pulses, these ‘‘pores’’ do not
represent long-lived permeable structures which enable transport of molecules after
the pulses.
4.4.3. Experimental studies of the effect of different parameters on
molecular transport
The transport, which governs the uptake of molecules and leakage of cytoplasm
contents, depends on experimental conditions, pulse parameters and the test mol-
ecule. The extensive studies of Teissie
´
, Rols and colleagues, [30,96,120,138–141]
examined the effect of different parameters (electric field strength, number of
pulses, duration) on the extent of permeabilization uptake of exogenous molecules,
cell survival, release of intracellular ATP and resealing. With these measurements it
was shown that the critical parameter is the electric field strength and that the
extent of permeabilization is governed by both duration and number of pulses. The
authors define phenomenological electropermeabilization threshold E
p
below
which no transport is observed for given pulse parameters. However, they also
define ‘‘limit’’ or real threshold E
s
[30] which is the threshold below which no
permeabilization occurs no matter how long the pulses are or how many are used.
This threshold can be interpreted as the value of the electric field where critical
transmembrane voltage is reached.
−2
0
2
4
6
8
10
12
14
x 10
−3
Δσ(t) [S/m]
1 Hz
10 Hz
2.5 kHz 1 kHz
100 Hz
N = 1
N = 3
N = 5
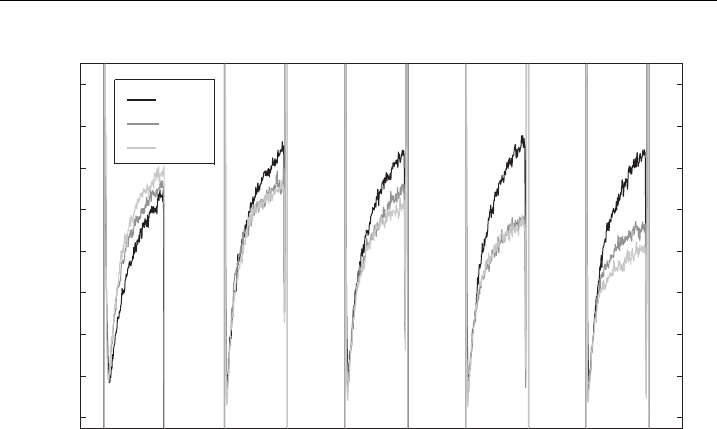
Figure 28 E¡ect of the repetition frequency on t he conductivity changes. Pulses 8 100 mswith
repetition frequencies from 1 H z^2.5 kHz were used, E ¼ 0.84 kV/cm. The time-dependent
conductivity changes DsðtÞ of the ¢rst, third and the ¢fth pulse with respect to the ¢rst pulse
(all initial levels are set to zero) are compared for di¡erent frequencies. Obtaine d from Ref.
[125] w ith permission of Biophysical Society.
Electroporation of Planar Lipid Bilayers and Membranes 205

Two other extensive studies of electroporation in vitro were made [33,34], where
authors studied uptake and viability for different electric field strength, duration,
number of pulses and also different cell volume fractions. Data indicated that nei-
ther electrical energy nor charge determines the extent of permeabilization and that
the dependency is more complex. The results of these two studies also suggest that
by increasing number and duration of pulses a certain ‘‘limit’’ threshold for perm-
eabilization is reached, or in other words, the permeabilization curves start at the
same electric field strength but the slope is electric field dependent. Even though
some studies suggested [3] that pulse shape affects efficiency of electroporation our
extensive study [142] of different pulse shapes showed that this is not crucial
parameter.
The general observation on the resealing kinetics of cell electroporation is that
resealing of the membrane lasts for minutes and is strongly dependent on the
temperature. Together with the fact that a colloid-osmotic effect is also present it is
obvious that complete resealing of the cell membrane is governed by slow bio-
logical processes, which was shown that is ATP dependant.
4.4.4. Osmotic cell swelling
It was shown in several experiments that cells swell during electroporation
[123–125,132]. Swelling of permeabilized cells is caused due to the difference in the
permeabilities of ions and larger molecules (macromolecules) which results in an
osmotic pressure that drives water into the cells and leads to cell swelling. The
dynamics and the extent of cell swelling can be observed using imaging of cells
during and after pulse application. The results of the measurements of the cell sizes
during and after the pulses are shown in Fig. 29. The time constant of colloid
osmotic swelling is few tens of seconds which is in agreement with the time
constant for efflux of ions, which is between 10 and 20 s.
Figure 29 The e¡ect of colloid- osmotic swelling ^ relative changes of the surface area DS=S
0
of
cells for di¡erent applied electric ¢eld strengths E
0
of the electric pulses (8 100 ms, 1 Hz) and
control (E
0
¼ 0kV/cm),timet ¼ 0 s ^ start of the ¢rst pulse, t ¼ 7 s end of pulsation.
M. Pavlin et al.206

4.4.5. Quantification of ion diffusion and the fraction of long-lived pores
The process of ion transport during electroporation is similarly as transport of
molecules governed mostly by diffusion. An increase in conductivity between the
pulses due to ion efflux can be therefore used to determine the permeability
coefficient and fraction of stable pores, which enable molecular transport which is
crucial for successful application of electroporation.
The diffusion of ions is a slow process compared to the duration of the electric
pulses thus we can assume that the major contribution to efflux of ions occurs
without the presence of the electric field:
dc
e
ðtÞ
dt
¼
DSðE; N Þ
dVFð1 FÞ
c
e
ðtÞFc
i
ðtÞðÞ. (47)
Definition of parameters and more detailed derivation is presented in Appendix
B.2. The solution of above equation for c
e
ðtÞ gives exponential rise to maximum,
from which it follows that the conductivity between the pulses also increases as an
exponential due to ion efflux. Form this it follows that the permeability coefficient
k
N
after the N-th pulse can be determined from the measured conductivity at N-th
pulse (Ds
N
) and at N+1-th pulse (Ds
Nþ1
):
k
N
¼
1
Dt
N
ln 1
Ds
N
Ds
max
1
Ds
Nþ1
Ds
max
(48)
The permeability coefficient is directly proportional to the fraction of long-lived
pores – f
per
:
f
N
per
k
N
dRFð1 FÞ
3D
0
; D
0
¼ D expð0:43w
0
Þ. (49)
In Fig. 30 relative changes of the initial level of conductivity due to ion diffusion
at the start of the N-th pulse Ds=s
0
¼ðs
N
0
s
0
Þ=s
0
for consecutive pulses are
shown. Similarly as in Fig. 27 the initial level starts to increase for above the
threshold E4 0.5 kV/cm, which can be explained with the efflux of ions (mostly
K
+
ions) from the cytoplasm through membrane pores. For higher electric fields
ions efflux increases up to 1.6 kV depending also on the number of applied pulses.
From measured Ds=s
0
¼ðs
N
0
s
0
Þ=s
0
using equation (48) we calculated per-
meability coefficients k
N
which are proportional to fraction of long-lived pores
(f
per
). It can be seen (see Fig. 31) that k
N
approximately linearly increases with
number of pulses, and as expected increases also with the electric field strength.
4.4.6. The effect of electric field on long-lived pore formation and
stabilization
Previously we have obtained the equation (see equation (43)) that determines how
the electric field governs the area of the cell membrane, which is exposed to the
above-critical transmembrane voltage U
c
and has increased permeability: S
c
ðEÞ¼
S
0
ð1 E
c
Þ=E
: Furthermore, we can assume that pore formation in the area
where U4U
c
is governed by the free energy of the pore, where the electrostatic
term also includes the square of the electric field DW
e
¼ aE
2
[32,46]. Based on this
we can assume that the most simplified equation, which describes the field
Electroporation of Planar Lipid Bilayers and Membranes 207

0 0.5 1 1.5 2
0
0.1
0.2
0.3
0.4
0.5
E [kV/cm]
Δσ/σ
0
N = 1
N = 2
N = 3
N = 4
N = 5
N = 6
N = 7
N = 8
Figure 30 Relative co nductivity changes between the pul ses due to ion di ¡usion ^
Ds=s
0
¼ðs
N
0
s
0
Þ=s
0
; where s
N
0
is the initial level at the start of the Nth pulse. 8 100 ms pulses
were used with repetition frequency 1Hz.
1 2 3 4 5 6 7
0
0.1
0.2
0.3
0.4
0.5
0.6
N
k
N
[s
−1
]
E = 0.35kV/cm
E = 0.52kV/cm
E = 0.70kV/cm
E = 0.86kV/cm
E = 1.05kV/cm
E = 1.22kV/cm
E = 1.43kV/cm
E = 1.61kV/cm
Figure 31 The permeability coe⁄cie nts k
N
for N pulses obtained after the N-th pulse calculated
using equation (48) from the conductivity changes Ds=s
0
using 8 100 ms pulses. Obtained from
Ref. [137] with permission of Elsevier.
M. Pavlin et al.208
dependent permeability, can be written as [137]:
k
N
ðEÞ¼C
N
ð1 E
c
=EÞE
2
. (50)
where C
N
are constants that depend on the size of the pores and their growth, and
are thus dependent also on the number of pulses. The above equation takes into
account the increase of the area of the cell exposed to the above critical voltage and
the quadratic field dependence in the permeabilized region.
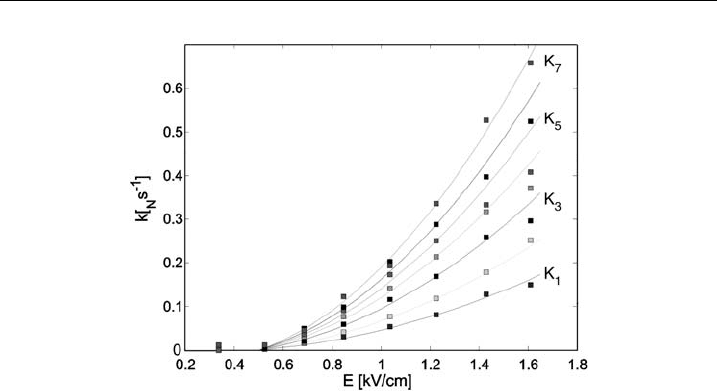
In Fig. 32 we compare the field dependence of the experimental permeability
coefficient with the theoretical model. As expected, the permeability coefficient k
N
and with this fraction of ‘‘transport’’ pores (see equation (48)) increases above the
threshold electric field. More interestingly, this simple model (equation (50)) can
very accurately describe the measured values, as can be seen in Fig. 32. This
demonstrates that long-lived pore formation is governed also by the energy of the
pores as well as by the number of pulses.
4.4.7. General experimental observations of cell electroporation
To summarize different phenomenological observations of cell electroporation
(electropermeabilization)
The state of transiently increased membrane conductivity indicates the existence
of short-lived membrane structures which enable ion permeation. In the aque-
ous pores formation model of electroporation this corresponds to conductive
hydrophilic pores [32]. An alternative explanation of these permeable structures
was that they are structural mismatches in the lipid organization [143]. The
membrane conductivity drops to the initial level in a range of a millisecond after
Figure 32 The permeability coe⁄cients k
N
for N pul ses obtained after the N-th pulse calculated
using equation (48) from the conductivity changes Ds=s
0
using 8 100 ms pulses. Comparison of
the prediction of the model according to equation (50) (lines) and the measured permeability
coe⁄cients (symbols) is shown [137], with perm ission of Elsevier.
Electroporation of Planar Lipid Bilayers and Membranes 209

the pulses. This could be explained only with the existence of many small pores
transient during the electric pulses, which close very rapidly (milliseconds) after
the pulse. The number of these short-lived pores does not depend on the
number of applied pulses but solely on the electric field strength and pulse
duration.
The state of increased permeability can last for tens of minutes after pulse
application. Therefore, it is clear that in contrast to transient pores which reseal
in milliseconds some pores are stabilized enabling transport across the membrane
in minutes after the pulses. The quantification of ion efflux shows that in con-
trast to transient short-lived pores these stable pores are governed both by elec-
tric field strength as well as the number of pulses. The fraction of long-lived
stable pores increases with higher electric field due to larger area of the cell
membrane exposed to above critical voltage and due to higher energy which is
available for pores formation. Moreover, each pulse increases the probability for
the formation of the stable pores.
The resealing of the cell membrane is a biologically active ATP-dependant
process which strongly depends on the temperature and lasts from minutes to
hours after pulse application. This clearly shows that long-lived pores are ther-
modynamically stable.
This and other observations lead to conclusion that the nature of long-lived
‘‘transport’’ pores is different than that of transient pores, which are present only
during the pulses.
4.4.8. Possible theoretical explanations of long-lived pores
As shown in previous section there exist two types of pores (structural changes) of
which nature, duration and number differs significantly. Hydrophilic pores are not
stable after pulse application therefore some additional process must be involved in
formation of stable pores. In Fig. 33 possible inter-relations between structural
changes, conductivity changes and permeabilization (increased transport of mol-
ecules) are shown.
As shown in figure above the nature of long-lived pores and the relation be-
tween short-lived structural changes and long-lived is still not completely under-
stood. In literature several explanations for the existence of these stable long-lived
pores can be found. It was proposed that larger pores are formed by coalescence of
smaller pores (defects) which travel in the membrane [144]. Some authors suggested
that pores (defects) migrate along the membrane surface [32] and are grouped
around inclusions. Altogether, there are no direct experimental observations which
would confirm the hypothesis of a coalescence of pores.
There is general agreement that proteins are involved in stabilization of larger
pores [32,46]. Authors speculated that cytoskeleton structure could act similarly to
the macroscopic aperture of planar membrane experiments leading to rupture of
limited portions of a cell membrane but not of the entire membrane [32]. Other
authors suggested [139] that disintegration of the cytoskeleton network could affect
electroporation where specific sites in the membrane would be more susceptible to
M. Pavlin et al.210

pore formation. Some experiments suggest that only a few large pores contribute
to increased permeability [145], whereas other suggests a contribution from a
larger number of small defects due to the structural mismatches in the lipid mem-
brane or due to structural discontinuities at borders between the domains. Recently
it was also shown that anisotropic inclusions can stabilize pores in the membrane
[146].
Altogether, there is still no definite explanation for the long-lived permeable
structures in the cell membrane [99]. Whatever these structures are, they have
long resealing times and are large enough to facilitate transport of larger mole-
cules.
5. Comparison between Planar Lipid Bilayers and Cell
Electroporation
We have to stress that the described theories were developed for planar bilayer
membranes which differ from cell membranes where membrane proteins and
cytoskeleton are present. However, several experiments demonstrated that the
structural changes probably occur in the lipid region of the cell membrane
[29,32,147] and thus these theories can be applied to cell membranes as well.
Both in planar bilayer membranes and cell membranes the authors obtained a
gradual increase of conductivity in high electric fields. The time interval preceding
the irreversible breakdown and the rate of increase of conductivity are determined
by the strength of the applied electric field [147]. The greatest observed difference
is that the reversible electroporation in cells is much more common than in planar
Figure 33 Possible inter-relations between structural changes, co nductivity changes a nd
permeabilization (increased tra nsport of molecules).
Electroporation of Planar Lipid Bilayers and Membranes 211

bilayer membranes and that resealing of artificial bilayer membranes takes milli-
seconds whereas resealing of cells can last for several minutes. And specifically this
long-lasting increased permeability of cell membrane is crucial for biotechnological
and biomedical applications. This shows clearly that for a complete description of
cell electroporation the role of the curvature, colloid osmotic swelling and specially
cell structures, such as cytoskeleton, domains and membrane proteins have to be
discussed and examined.
Altogether from theoretical model of aqueous pore formation can relatively
good describe experimental observations on lipid bilayers: critical transmembrane
voltage and stochastic nature of the process. However, up to now there is no
theoretical description which could completely describe all observable phenomena
present during cell electroporation and the underlying physical mechanism: the
formation of structural changes in the membrane on a molecular level during the
electric pulse, stochastic nature of electroporation, the observed dependency of
molecular uptake on pulse duration and number of pulses, field strength, repetition
frequency, the strong nonlinear transmembrane current-voltage characteristics with
the critical transmembrane voltages between 0.2–1 V and the stability of ‘‘pores’’
after the pulses as well as the resealing dynamics.
Altogether, the model of an aqueous pore formation offers a plausible expla-
nation for its stochastic nature and dependence on the pulse duration. The local
minimum in the free energy could represent stable hydrophilic pores, which could
explain the state of increase conductivity and permeability during the electric
pulses. However, as it can be seen from Fig. 21, by using the realistic parameters
a minimum in free energy is obtained only for very specific values of parameters
usually suggesting that electroporation would immediately lead to irreversible
electroporation. Thus as already discussed in the review of Weaver and
Chizmadzhev, some additional processes/structures have to be included to obtain
a realistic theoretical model of stable pores which could explain long-lived per-
meability of the cell membrane after electroporation. It is also clear that this the-
oretical description should incorporate proteins and cytoskeleton which can be
crucial factors that enables pore stabilization and prevent breakdown of the cell
membrane thus enabling the most important applications of cell electroporation:
electrogene transfer and electrochemotherapy.
Strong support for the existence of pores was given recently by Marrink and
colleagues in a molecular dynamics simulation of a lipid bilayer without [148] and
in the presence [149] of an external electric field. Owing to thermal energy the
lipid molecules constantly fluctuate and sometimes form short-lived states, with a
structure similar to that of a small hydrophilic pore. By this, the assumption of the
existence of small pores in the membrane before the application of the electric pulse
is justified. The dynamic simulation in the presence of an external electric field
[149] further showed existence of hydrophilic pores for the induced transmembrane
voltage above 2.5 V, which is much higher than experimentally observed critical
transmembrane voltage (0.2–1 V), however, these studies are important since they
present calculations of the possible lipid states by taking into account forces on
a molecular level. Future studies will probably enable building more realistic
models.
M. Pavlin et al.212
Appendix A
A.1. The Instability in the Hydrodynamic Model
In this model, the membrane is a layer of nonconductive liquid with permittivity e
m
and surface tension G. Its volume V is constant, while both its surface S and
thickness d are variable, with initial values denoted by S
0
and d
0
. The pressure
exerted on the membrane by the transmembrane voltage U is given by
p
1
¼
m
U
2
2d
2
(A.1)
and is opposed by the pressure due to the increase of membrane surface, which is
given by
p
2
¼
G
V
Z
S
S
0
dS ¼
GðS S
0
Þ
dS
. (A.2)
Since in this model the volume is constant, dS ¼ d
0
S
0
; and we can write
p
2
¼
GðS S
0
Þ
d
0
S
0
¼
G
d
0
S
S
0
1
¼
G
d
0
d
0
d
1
¼G
1
d
1
d
0
. (A.3)
The equilibrium is obtained at a value of d at which p
1
þ p
2
¼ 0:
m
U
2
2d
2
G
1
d
1
d
0
¼ 0 (A.4)
We rewrite this expression as
1
d
0
d
2
d þ
U
2
m
2G
¼ 0. (A.5)
This is a quadratic equation and thus has two solutions, but since at U ¼ 0 the
membrane thickness is by definition d ¼ d
0
, only one has a physical meaning,
namely
d ¼
d
0
2
1 þ
ffiffiffiffi
D
p
; whereD ¼ 1
2U
2
m
Gd
0
. (A.6)
Real solutions then exist only for D 0; and the equilibrium is only reached at
voltages below the critical value given by
U
c
¼
ffiffiffiffiffiffiffiffi
Gd
0
2
m
r
. (A.7)
A.2. The Instability in the Elastic Model
We represent the membrane as an elastic layer with permittivity e
m
and elasticity
module Y
m
. We assume that the membrane surface S is constant, while its volume
V and its thickness d are variable, with initial values V
0
and d
0
. The pressure caused
Electroporation of Planar Lipid Bilayers and Membranes 213