Liu A.L., Tien H.T. Advances in Planar Lipid Bilayer and Liposomes. V.6
Подождите немного. Документ загружается.

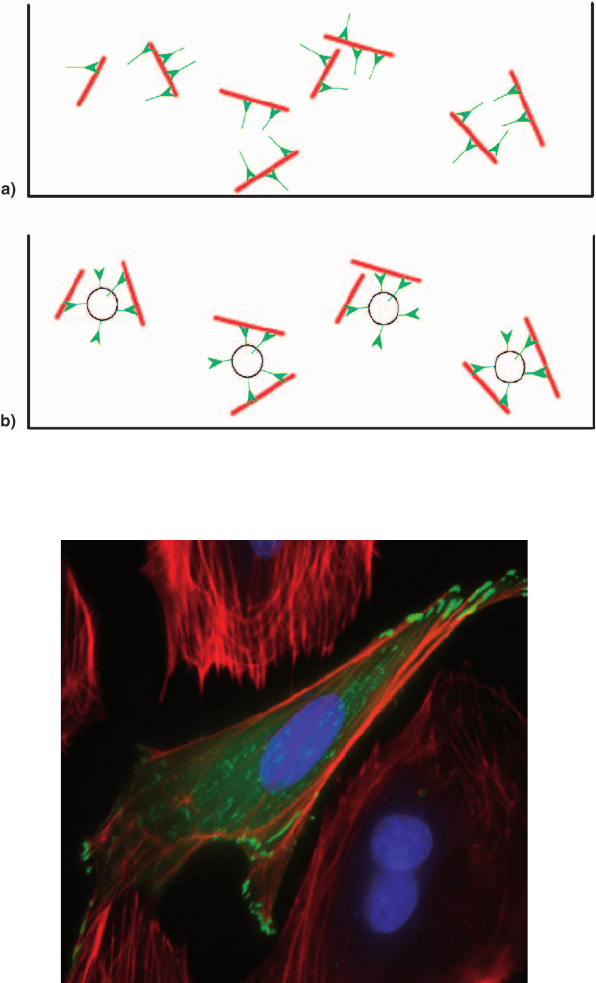
Plate 5 Schematic representation of protein^lipid interaction. Schematic view of (a) myosin II
(green) and putative binding to actin (red) and (b) myosin II (bound to lipid vesicles) and actin
(see page 234 in this volume).
Plate 6 Fluoresce nce images. Fluorescence image of a single capillary endotheli al cell
expressing GFP-vinculin ( gree n), stained for F-actin with Alexa phalloidin (red) and nuclei
with DAPI (blue). Note: how each actin stress ¢ber is anchored into foc al adhesions at its distal
ends (bar ¼ 10 mm). Reproduced with permission from Ref. [103], Copyright (c) 2006,W|ley-Liss,
Inc. (see page 245 in this volume).
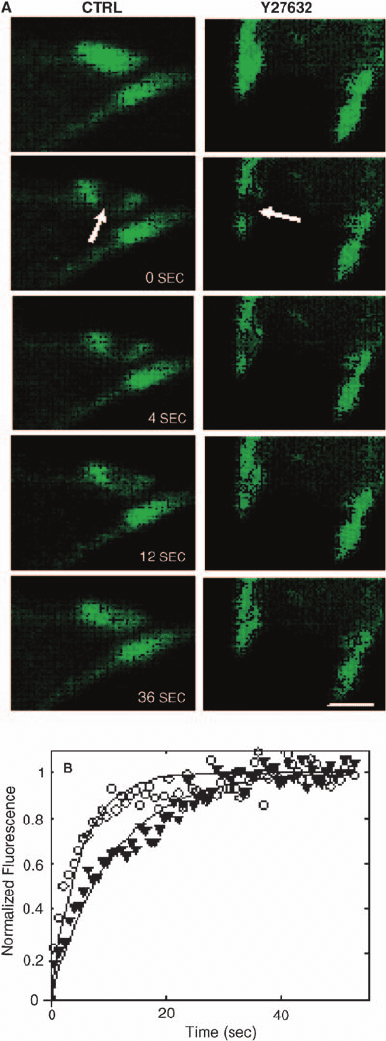
Plate 7 FRAP analysis of GFP zyxin recovery within individual photobleached focal adhesions.
(A) Representative images of a FRAP experiment in control versus Y27632-treated cells showing
that force dissipation accelerates zyxi n recovery. Arrows indicate photobleached spots within
individual focal adhesions that are analyzed over a period of 36 seconds follow photobleaching
(bar ¼ 2 mm). (B) Recovery curve for zyxin in control (open circles) ver sus Y27632-treated cells
(closed triangles) from the experiment shown in A; solid lines are curves ¢t to the data using the
method of least squares to estimate the dissociation rate constant k
OFF
(see page 248 in this volume).
This page intentionally left blank