Kutz M. Handbook of materials selection
Подождите немного. Документ загружается.


658 NONDESTRUCTIVE INSPECTION
the returning echoes, also gates the echoes that return between the front surface
and rear surfaces of the component. Thus, any unusually occurring echo can
either be displayed separately or used to set off an alarm.
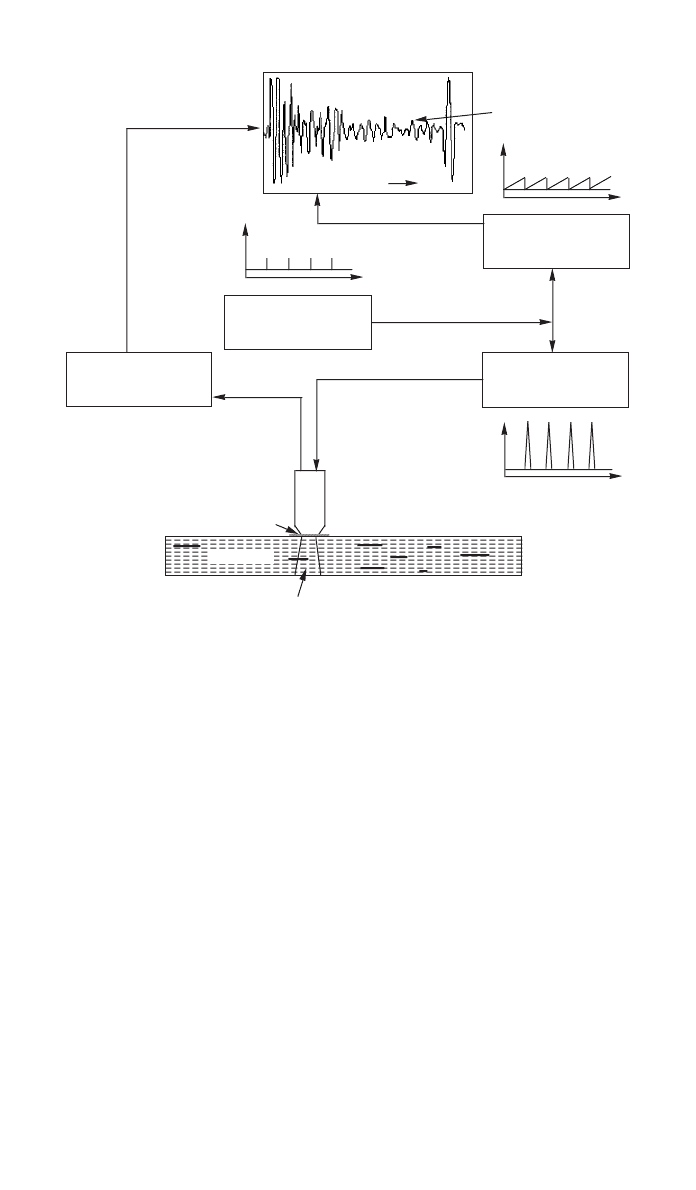
A schematic diagram of a typical ultrasonic pulse echo setup is shown in Fig.
6. This method of displaying of voltage amplitude of the returning pulse versus
time or depth (if acoustic velocity is known) at a single point of the specimen
is known as an A-scan. In this figure, the first signal corresponds to a reflection
from the front surface (FS) of the part and the last signal corresponds to the
reflection from its back surface (BS). The signal or echo between FS and BS is
from the defect in the middle of the part.
The portion of sound energy reflected from or transmitted through each in-
terface is a function of the impedances of media on each side of that interface.
The reflection coefficient R (ratio of the sound pressures or intensities of the
reflected and incident waves) and transmission coefficient T (ratio of the sound
pressures or intensities of the transmitted and incident waves) for an acoustic
wave normally incident on to an interface are
pZ
⫺ Z
t 12
R ⫽⫽
pZ⫹ Z
i 12
2
IZ⫺ Z
r 12
R ⫽⫽
冉冊
pwr
IZ⫹ Z
i 12
Likewise, the transmission coefficients, T and T
pwr
, are defined as
p 2
⫻ Z
t 2
T ⫽⫽
pZ⫹ Z
i 12
Z
2
4 ⫻
冉冊
Z
1
I
t
T ⫽⫽
2
I
Z
i
2
1 ⫹
冋冉冊册
Z
1
where I
i
, I
r
, and I
t
are the incident, reflected, and transmitted acoustic field
intensities, respectively. Z
1
is the acoustic impedance of the media from which
the sound wave is incident and Z
2
is impedance into which the wave is trans-
mitted. From these equations one can calculate the reflection and transmission
coefficients for a planar flaw containing air, Z
1
⫽ 450 kg/cm
2
s, located in a
steel part, Z
2
⫽ 45.4 ⫻ 10
6
kg/m
2
s. In this case, the reflection coefficient for
the flaw is practically
⫺1.0. The minus sign indicates a phase change of 180⬚
for the reflected pulse (note that the defect signal in Fig. 6 is inverted or phase
shifted by 180
⬚ from the front surface signal).
Effectively no acoustic energy is transmitted across an air gap, necessitating
the use of water as a coupling media in ultrasonic testing. The acoustic properties
of several common materials are shown in Appendix A. These data are useful
for a number of simple, yet informative, calculations.
3 ULTRASONIC METHODS 659
Voltage
time
time
FS
BS
D
time
Sweep Generator
Pulser
Time Base
Receiver
Ultrasonic Transducer
Couplant
Front Surface (FS)
Back Surface (BS)
Voltage
Voltage
time
Sound
Field
x axis
y axis
Ultrasonic
Signal
Defect (D)
Fig. 6 A schematic representation of ultrasonic data collection and display
in the A-scan mode.
Thus far our discussion has involved only longitudinal waves. This is the only
wave type that travels through fluids such as air and water. The particle motion
in this wave, if it were observed, is similar to the motion one would observe in
a spring, or a Slinky toy, where the displacement and wave motion are collinear
(the oscillations occur along the direction of propagation). The wave is referred
to as compressional or dilatational since both compressional and dilatational
forces are active in it. Audible sound waves are compressional waves. This wave
type is observed in liquids and gases as well as in solids. However, a solid
medium can also support additional types of waves such as shear and Rayleigh
or surface waves. Shear or transverse waves have a particle motion that is anal-
ogous to what one sees in a rope that has been snapped. That is, the displacement
of the rope is perpendicular to the direction of wave propagation. The velocity
of this wave is about half that of compressional waves and is only found in solid
media as indicated in the acoustic velocity appendix, i.e., Appendix A. Shear
waves are often generated when a longitudinal wave is incident on a fluid/solid
interface at angles of incidence other than 90
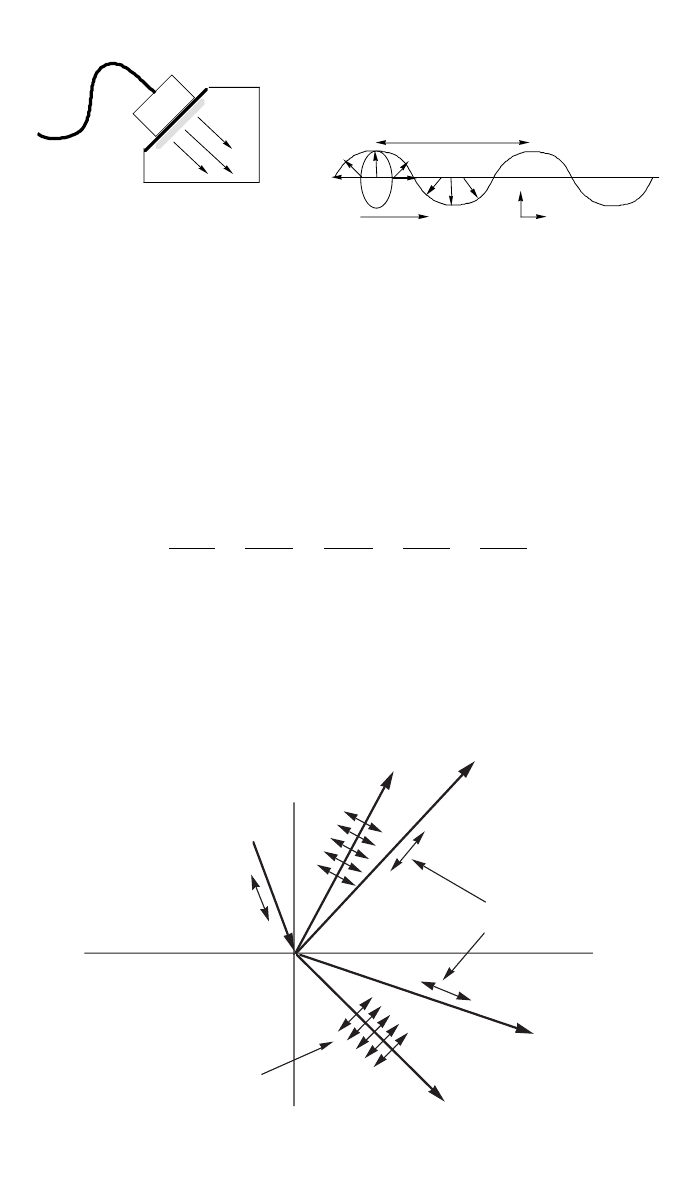
⬚. Rayleigh or surface waves have
elliptical wave motion, as shown in Fig. 7, and penetrate the surface for about
one wavelength; therefore, they are used to detect surface and very near surface
flaws. The velocity of Rayleigh waves is about 90% of the shear wave velocity.
Their generation requires the special device shown in Fig. 8, which enables an
660 NONDESTRUCTIVE INSPECTION
Transducer
Couplant
Conversion
Wedge
Direction of
Pro
p
a
g
ation
Wavelength
Z
Y
Air
Solid
Particle
displacement as
surface wave
propagates on a
material surface
Fig. 7 Generation and propagation of surface waves in a material.
Incident
Longitudinal
Wave
Reflected
Longitudinal
Wave
Refracted
Longitudinal
Wave
Refracted
Shear Wave
(Vertically
Polarized)
Reflected
Shear
Wave
Medium I
c , b ,
I
I
I
Medium II
c , b ,
II
II
II
Direction of
particle
displacement
Direction of
particle
displacement
Fig. 8 Schematic representation of Snell’s law and the mode conversion of a longitudinal wave
incident on a solid / solid interface.
incident ultrasonic wave on the sample at a specific angle that is characteristic
of the material (Rayleigh angle). The reader can find more details in Ref. 63.
3.3 Refraction of Sound
The direction of propagation of acoustic waves is described by the acoustic
equivalent of Snell’s law. Referring to Fig. 8, the directions of propagation are
determined with the following equation:
sin
sin
sin
␥
sin
sin
␥
irrtt
⫽⫽⫽⫽
ccbcb
II IIIII
where c
I
is the velocity of the incident longitudinal wave, c
I
and b
I
are the
velocities of the longitudinal and shear reflected waves, and c
II
and b
II
are the
velocities of the longitudinal and shear transmitted waves in solid II. The angles
of incidence and transmission are shown in Fig. 8. In the case of the water/steel
3 ULTRASONIC METHODS 661
Fig. 9 The amplitude (energy flux) and phase of the reflected coefficient and transmitted ampli-
tude versus angle of incidence for a longitudinal wave incident on a water –steel interface.
The arrows indicate the critical angles for the interface.
interface, there are no shear waves reflected because these waves do not prop-
agate in fluids such as water. In this case, the above relationship is simplified.
Since the water has a lower wave speed than either the compressional or shear
wave speeds of the steel, the acoustic waves in the metal are refracted away
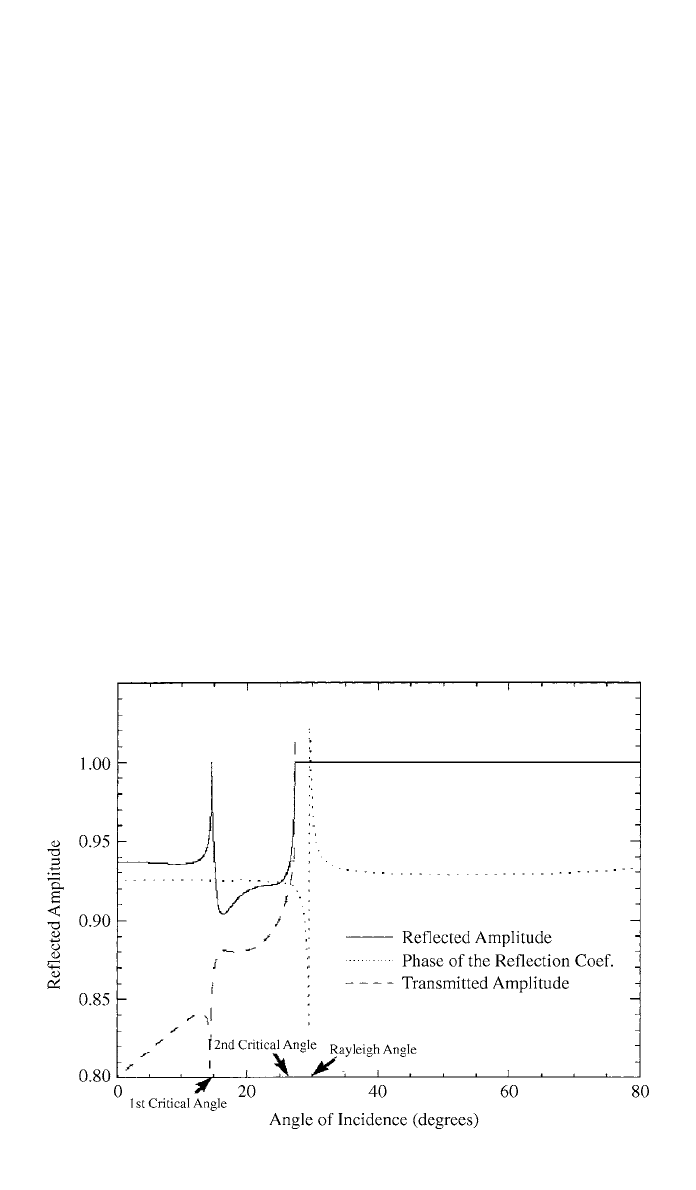
from the normal. There will be a critical angle at which the refracted wave travels
along the interface and does not enter the steel. Above this angle the acoustic
wave will not be generated in the metal. A computer-generated curve is shown
in Fig. 9 in which the normalized acoustic energy reflected and refracted at a
water/steel interface are plotted as a function of angle of incidence. Note that
the longitudinal or first critical angle for steel occurs at 14.5
⬚. Likewise the shear
or second critical angle occurs at 50
⬚. If the angle of incidence is increased,
above the first critical angle, only the shear wave is generated in steel and travels
at an angle of refraction determined by Snell’s law. Angles of incidence above
the second critical angle produce a complete reflection of the incident acoustic
wave; that is, no acoustic energy enters the solid. At a specific angle of incidence
(Rayleigh angle) surface acoustic waves are generating on the material. The
Rayleigh angle can be easily calculated from Snell’s law by assuming that the
refracted angle is 90
⬚. The Rayleigh angle for steel is 29.5⬚. In the region be-
tween the two critical angles only the shear wave is generated and is referred
to as ‘‘shear wave testing.’’ There are two distinct advantages to inspecting parts
with this type of shear wave. First, with only one type of wave present, the
ambiguity that would exist concerning which type of wave is reflected from a
defect does not occur. Second, the lower wave speed of the shear wave means
that it is easier to resolve distances within the part. For these reasons, shear wave

662 NONDESTRUCTIVE INSPECTION
inspection is often chosen for inspection of thin metallic structures such as those
in aircraft.
Using the relationships for the reflection and transmission coefficients, a great
deal of information can be deduced about any ultrasonic inspection situation
with the acoustic wave incident at 90
⬚ to the surface. For other angles of inci-
dence, computer software is often used to analyze the acoustic interactions. For
more complicated materials or structures such as fiber-reinforced composites
analytical predictions require the use of a rather complex analysis. In some cases,
more complicated modes of wave propagation can occur. Examples of these
include Lamb waves (plate waves), Stoneley waves (interface waves), Love
waves (guided waves in the layer on a coated material), and others.
3.4 Inspection Process
Once the type of ultrasonic inspection has been chosen and the optimum ex-
perimental parameters determined, then one must choose the mode of presen-
tation of the data. If the principle dimension of the flaw is less than the diameter
of the transducer, then the A-scan method may be chosen, as shown in Fig. 6.
The acquisition of a series of A-scans obtained by scanning the transducer in
one direction across the specimen and displaying the data as distance versus
depth is referred to as B-scan. This is the mode most often used by medial
ultrasound instrumentation. In the A-scan mode, the size of the flaw may be
inferred by comparing the amplitude of the defect signal to a set of standard
calibration blocks. Each block has a flat bottom hole (FBH) drilled from one
end. Calibration blocks have FBH diameters that vary in -in. increments.
1
––
64
Therefore, a number 5 block has a -in. FBH. By comparing the amplitude of
5
––
64
the signal from a calibration block with one from a defect, the inspector may
specify a defect size as equivalent to a certain size FBH. The equivalent size is
meaningful only for approximately smooth flaws that are nearly perpendicular
to the path of the ultrasonic beam.
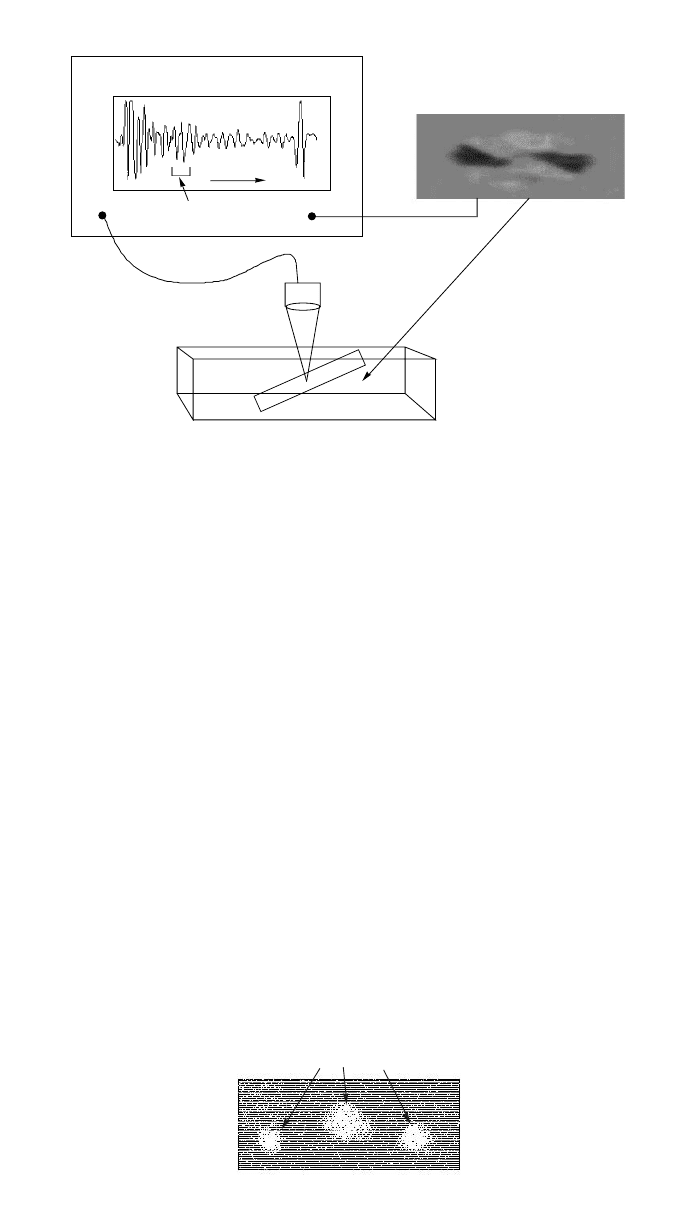
If the flaw size is larger than the transducer diameter, then the C-scan mode
is usually selected. In this mode, shown in Fig. 10, the transducer is rastered
back and forth in two directions across the part. In normal operation a line is
traced on a monitor or piece of paper. When a flaw signal is detected between
the front and back surface, a line with much increased darkness appears on the
paper or monitor. Using this mode of presentation, a planar projection of each
flaw is presented to the viewer and its positional relationship to other flaws and
to the component boundaries is easily ascertained. Unfortunately, the C-scan
mode does not show depth information, unless an electronic gate is set to capture
only information from within a specified time window or time gate in the part.
With current computer capability it is a rather simple matter to store all of the
returning A-scan data and display only the data in a C-scan mode for specific
depth. The C-scan mode provides a visual representation of a slice of the ma-
terial at a certain depth and is very useful for inspection purposes.
Depending on the structural complexity and the attenuation of the signal by
the material, flaws as small as 0.015 in. can be reliably detected and quantified
using this inspection method. An example of a typical C-scan printout of an
adhesively bonded test panel is shown in Fig. 11. While the panel was fabricated
with a Teflon void-simulating implant in the center, the numerous additional
white areas indicate the presence of a great deal of porosity in the part.
50,58
4 RADIOGRAPHY 663
0.6
0.4
0.2
0.0
-0.2
-0.4
-0.6
Pulser-Receiver
Recording
of C-scan
Time
Gate
Out
In
Transducer
Fig. 10 Schematic representation of ultrasonic data collection. The data are displayed using
the C-scan mode. The image shows a defect located at a certain depth in the material.
Delaminations
Fig. 11 Typical C-scan image of a composite specimen showing delaminations and porosity.
Black and white are reversed.
4 RADIOGRAPHY
In classical NDE radiography the projected X-ray attenuation for a multitude of
paths through a specimen are recorded as a two-dimensional image on some
type of recording media. In computed tomography (CT), the attenuation values
are used to calculate a cross-sectional image of the component being inspected.
A detailed description of radiography testing (RT) may be found in the Non-
destructive Testing Handbooks.
10
The classic RT process is shown schematically in Fig. 12. Note that RT re-
cords visually any feature that changes the attenuation of the X-ray beam as it
transverses a path through the component. This local change in attenuation pro-
duces a change in the intensity of the X-ray beam, which translates to a change
in the density or darkness on a film or electronic recording device. The inspector
uses this change in brightness to detect internal anomalies, which sometimes
appear as a mere shadow on the radiograph. The inspector is greatly aided in
detecting and quantifying flaws by knowing the geometry of the part and how
this relates to the image. It should be noted in Fig. 12 that only flaws that change
the attenuation of the X-ray beam on passage through the part are recorded. For
example, a delamination in the laminated specimen is not visible because there
is no change in attenuation of the X-ray beam. Flaws that are oriented parallel
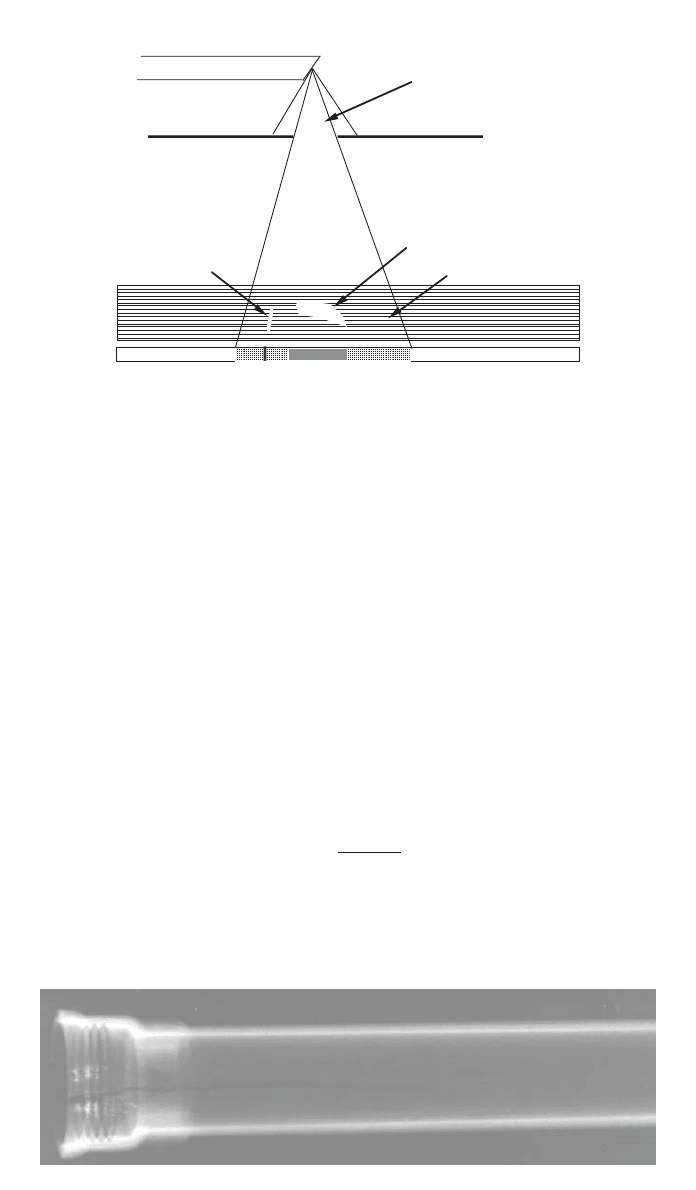
664 NONDESTRUCTIVE INSPECTION
Lead Diaphram
Collimated Beam
X-Ray Film
Crack
Large Pore
Delamination
Fig. 12 Schematic radiograph of a typical composite with typical flaws.
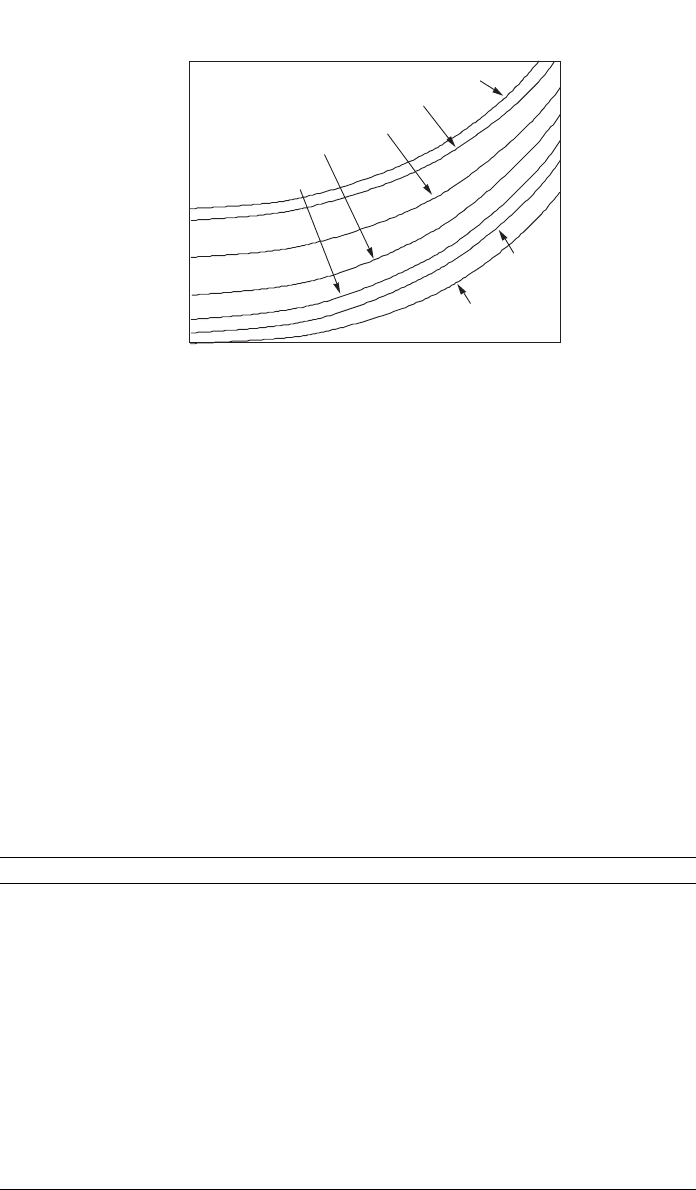
Fig. 13 Radiograph of a crack in the end of an aluminum tubing.
to the X-ray path do not attenuate the X-ray beam and thus allow more radiation
to expose the film and thus appear darker than the surrounding image. An ex-
ample of a crack in the correct orientation to be visible on a radiograph of a
piece of tubing is shown in Fig. 13.
4.1 Generation and Absorption of X-Radiation
X-radiation can be produced from a number of processes. The most common
form of producing X-rays is with an electron tube in which a beam of energetic
electrons impacts a metal target. As the electrons are rapidly decelerated in this
collision, a wide band of X-radiation is produced, analogous to white light. This
band of radiation is referred to as Bremsstrahlung or breaking radiation. Higher-
energy electrons produce shorter-wavelength or more energetic X-rays. The re-
lationship between the shortest-wavelength radiation and the highest voltage
applied to the tube is given by
12,336
⫽
voltage
where
,inA
˚
ngstroms, is the shortest wavelength of the X-radiation produced.
4 RADIOGRAPHY 665
0.01 0.1 1.0 5.0
1000
100
10
Specimen Thickness, inches
X-Ray Potential, Kilovolts
Cooper & Nickel Alloys
Steel & Stainless Steel
Titanium Alloys
Aluminum &
Borsic/Aluminum
Boron/Epoxy
Fiberglass/
Epoxy
Graphite/Epoxy
& Adhesives
Fig. 14 Plot of the X-ray tube voltage versus thickness of several important
industrial materials.
Table 2 Approximate Radiographic Equivalence Factors
64
100 kV 150 kV 220 kV 250 kV 400 kV 1 MeV 2 MeV 4–25 MeV 192Ir 60Co
Metal
Magnesium 0.05 0.05 0.08
Aluminum 0.08 0.12 0.18 0.35 0.35
Aluminum alloy 0.10 0.14 0.18 0.35 0.35
Titanium 0.54 0 54 0.71 0.9 0.9 0.9 0.9 0.9
Iron / all steels 1.0 1.0 1.0 1.0 1.0 1.0 1.0 1.0 1.0 1.0
Copper 1.5 1.6 1.4 1.4 1.4 1.1 1.1 1.2 1.1 1.1
Zinc 1.4 1.3 1.3 1.2 1.1 1.0
Brass 1.4 1.3 1.3 1.2 1.1 1.0 1.1 1.0
Inconel X 1.4 1.3 1.3 1.3 1.3 1.3 1.3 1 3
Monel 1.7 1.2
Zirconium 2.4 2.3 2.0 1.7 1.5 1.0 1.0 1.0 1.2 1.0
Lead 14.0 14.0 12.0 5.0 2.5 2.7 4.0 2.3
Halfnium 14.0 12.0 9.0 3.0
Uranium 20.0 16.0 12.0 4.0 3.9 12.6 3.4
The more energetic the radiation, the more penetrating power it has. Therefore,
higher energy radiation is used on dense materials such as metals. While it is
possible to analytically predict what X-ray energy would provide the best image
for a specific material and geometry, a simpler method of determining the op-
timum X-ray energy is shown by Fig. 14. Note that higher energies are used for
dense materials, e.g., steels, or for thick light materials, e.g., large plastic parts.
An alternative method to using this figure is to use radiographic equivalence
factors shown in Table 2.
64
Aluminum is the standard material for voltages below
100 KeV, while steel is the standard above this voltage. When radiographing
any other material, its thickness is multiplied by the factor to obtain the equiv-
alent thickness of the standard material. The radiographic parameters are set for
this thickness of aluminum or steel. In this manner a good-quality radiograph is

666 NONDESTRUCTIVE INSPECTION
Log(mass absorption coefficient)
Atomic Number
•
•
•
•
•
•
Gd
•
Eu
•
Cd
• B
• H
• Li
Sm
•
N •
In
•
Ni •
O •
S •
Al •
Co
•
•
•
•
•
•
•
•
•
•
•
•
•
•
•
•
Pb •
Sn •
Cr
•
•
•
•
•
•
•
•
•
•
•
•
U
• Fe
C
•
•
•
•
•
•
•
•
•
•
•
•
•
•
•
•
•
•
•
•
•
•
Fig. 15 Plot of mass absorption coefficient versus atomic number.
obtained for the part in question. For example, assume that one must radiograph
a 0.75-in.-thick piece of brass with a 400 KeV X-ray source; then the inspector
should multiply 0.75 by the factor of 1.3 to obtain 0.98. This means that an
acceptable radiograph of the brass plates would be obtained with the same ex-
posure parameters as would be used for 0.98 in. (approximately 1 in.) of steel.
Radiation for RT can also be obtained from the decay of radioactive sources.
In this case, the process is usually referred to as gamma radiography. These
radiation sources have several different characteristics from X-ray tubes. First,
the gamma radiation is very nearly monochromatic; that is, the spectrum of
radiation contains only one or two dominant energies. Second, the energies of
most sources is in the million-volt range, making this source ideal for inspecting
highly attenuating materials and structures. Third, the small size of these sources
permits them to be used in tight locations where an X-ray tube could not fit.
Fourth, since the gamma-ray source is continually decaying, adjustments to the
exposure time must be made to achieve consistent results over time. Finally, the
operator must always remember that the source is continually on and is therefore
a persistent safety hazard. Aside from these differences, gamma radiography
differs little from standard practice, so no further distinction between the two
will be given.
4.2 Neutron Radiography
Neutron radiography
65
may be useful in inspecting materials and structures in
some circumstances. Because the attenuation of neutrons is not related to atomic
number in a regular manner, some elements can be more easily detected that
others. While X-rays are most heavily absorbed by high-atomic-number ele-
ments, this is not true of neutrons, as shown in Fig. 15. The reader can discern
that hydrogen adsorbs neutrons more strongly than do most metals. This means
that any hydrogen-containing materials would be easily detected within a heavy
metal container. Neutron radiography has been used to detect porosity in the

4 RADIOGRAPHY 667
Missing Adhesive
Porosity
Fig. 16 Neutron radiograph of specimen showing bond line flaws.
adhesive used to join metal structures. In this case, the hydrogen of the adhesive
is preferentially absorbed compared to the metal—see the schematic represen-
tation of a neutron radiograph of an adhesively bonded specimen with various
flaws shown in Fig. 16.
Neutron radiography, however, does have several constraints. First, neutrons
do not expose radiographic film and therefore fluorescing must be used to pro-
duce an image with light. The image produced in this manner is not as sharp
and well defined as that from X-rays. Second, there does not exist a high-flux,
portable source of neutrons. This means that a nuclear reactor is most often used
to supply the penetrating radiation. Given these restrictions, there are times when
there is no other alternative to neutron radiography, and utility of the method
outweighs its expense and difficulty.
4.3 Attenuation of X-Radiation
An appreciation of how radiographs are interpreted requires a fundamental un-
derstanding of the X-ray absorption. The basic relationship governing this phe-
nomenon is de Beer’s law.
⫺
x
I ⫽ Ie
0
where I and I
0
are the transmitted and incident X-ray beam intensities, respec-
tively,
is the attenuation coefficient of the material in reciprocal centimeters
(cm
⫺
1
), and x is the thickness of the specimen, in centimeters. Since the atten-
uation coefficient is a function of both the composition of the specimen and the
wavelength of the X-rays, it would be necessary to calculate or measure it for
each wavelength used in radiographs testing (RT). However, it is possible to
calculate the attenuation coefficient of a material for a specific X-ray energy
using the mass absorption coefficient,
, as defined below. The mass absorption
coefficients for most elements are readily available for a variety of X-ray ener-
gies
10
⫽
m
where
is the attenuation coefficient of one element of the material, in recip-
rocal cm, and
its density in g/cm
3
. The mass absorption coefficient for the
material is obtained, at a specific X-ray energy, by multiplying
m
of each ele-
