Korb K.B., Nicholson A.E. Bayesian Artificial Intelligence
Подождите немного. Документ загружается.

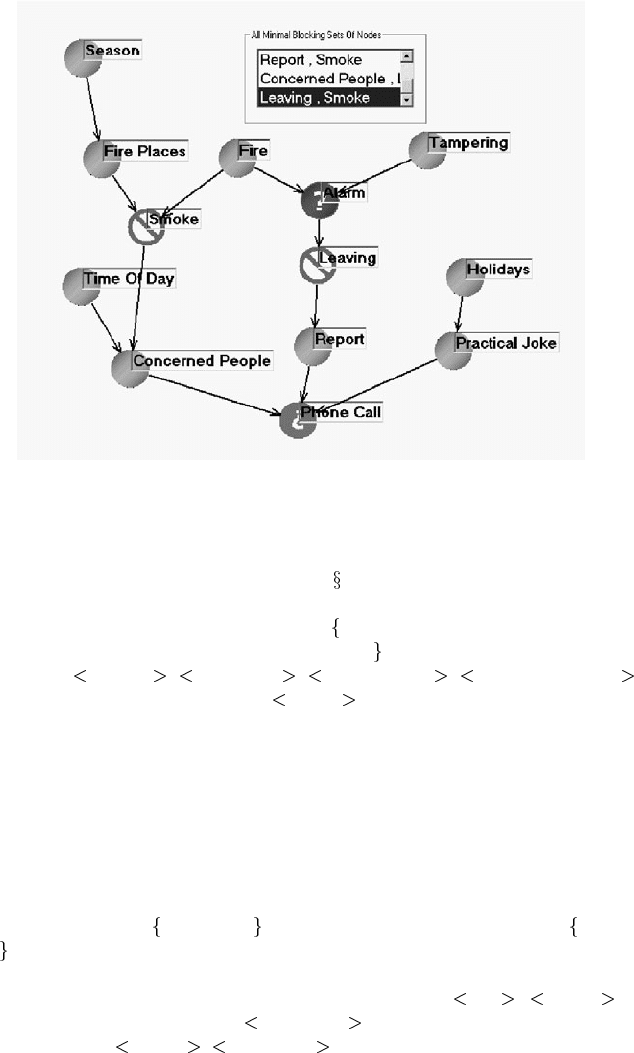
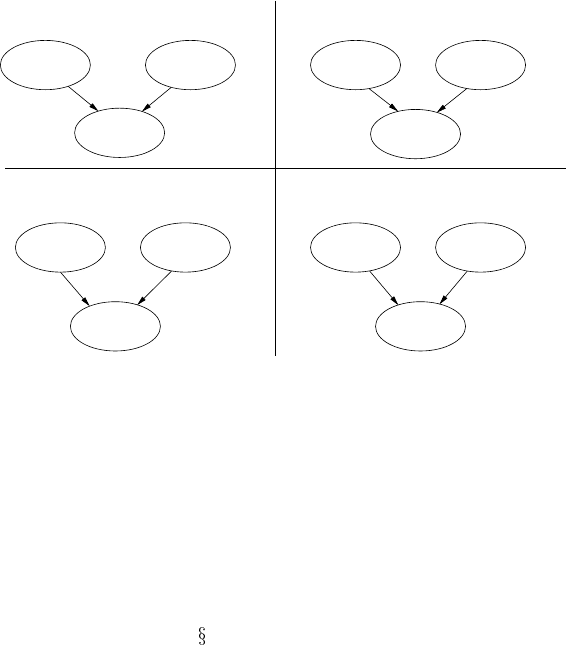
FIGURE 9.5
Matilda’s Type 1 visualization of d-separation in the fire alarm example.
only one set, namely the Markov blanket (see
2.2.2).
Example: selected X=Report (Figure 9.6).
The Markov blanket for this node is the set
Leaving (parent), Phone Call (child),
Practical Joke, Concerned People (child’s parents)
. The verbal explanation is: “IF
the value of:
Leaving , Phone Call , Practical Joke , Concerned People
is known then knowing the value of Report WILL NOT CHANGE the belief
about the value of any other node and vice versa.”
Matilda’s Type 3 question. Given some information, what happens to the rela-
tionships between nodes?
Here, Matilda visualizes the relationships between sets of nodes. This option allows
the user to select a set of nodes X (the query nodes) and a set of nodes Z (the prior
information) and request the set of all Y nodes that are d-separated (blocked) from X.
Matilda highlights all the nodes Y in response.
Example: selected X=
Phone Call , with prior information for nodes Z= Smoke,
Fire
(Figure 9.7).
The nodes that are d-separated from Phone Call by Smoke and Fire are Fire Places
and Seasons. The verbal explanation is “IF the value of:
Fire , Smoke is
known then knowing the value of
Phone Call WILL NOT CHANGE the belief
about the value of
Season , Fire Places and vice versa.”
In short, for various types of query, Matilda visualizes the relation “X is d-separated
© 2004 by Chapman & Hall/CRC Press LLC
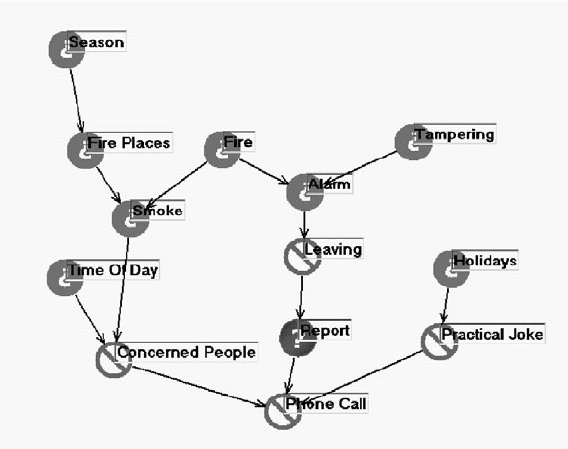
FIGURE 9.6
Matilda’s Type 2 visualization of a Markov blanket for Report.
from Y given Z.” In the first type, the user chooses X and Y; in response the tool
highlights Z. In the second question type, the user chooses X; in response the tool
highlights Z. In the third question type, the user chooses X and Z; in response the
tool highlights Y. Note that in the first two types of queries the tool identifies the
d-separating sets of nodes, whereas in the latter type of query the user is asking the
question with regard to a specific d-separating set of nodes.
Case-studies [24] suggest that Matilda is useful in understanding networks as they
are being built and in understanding the consequences of different possible design
choices. It can be used not just by BN experts, but also by domain experts to validate
the network and identify potential problems with the structure. It can be used to
investigate an existing network at any stage during development. It is especially
helpful in investigating networks built by automated methods, when prior intuitive
understanding may be weak.
9.3.2.3 Other relationships
There are other less explicit indications of the correct network structure.
Association relationships occur when knowing a value of one variable provides
information about another variable. By Reichenbach’s Principle of the Common
Cause, some causal nexus must explain the association; although any active (un-
blocked) path will do this, just the information that there is some active path may
serve as a beginning in building the causal structure. The absence of an uncondi-
© 2004 by Chapman & Hall/CRC Press LLC
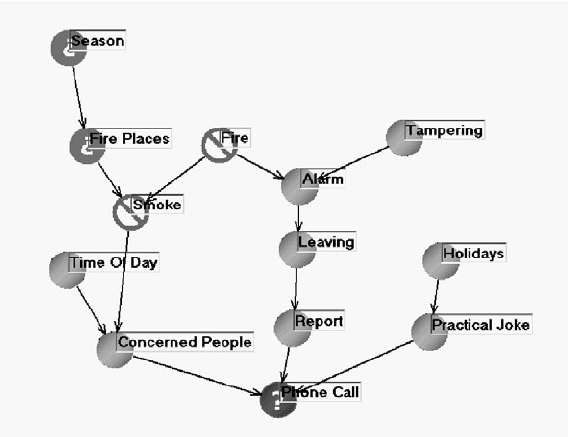
FIGURE 9.7
Matilda’s Type 3 visualization.
tional association is also useful to know. Thus, in the fire alarm example of Fig-
ure 9.4, there is no marginal dependence between Time of Day and Fire,whichis
an implication worth checking. On the other hand, there is an implied association
between Report and Smoke (through their common ancestor Fire).
In many domains, there may be a known temporal ordering of variables, where
one event or value change occurs before another. The known ordering may be either
total or partial. In either case, the temporal information will restrict the orientation
of some of the arcs, assuming you are building a causal network.
9.3.2.4 Combining discrete and continuous variables
The initial work on BNs with continuous variables [217, 251] only allowed variables
with linear Gaussian distributions. A method for combining discrete and continuous
variables was proposed [168] and implemented in cHugin [210]; this approach did
not allow for discrete children of continuous parents. The usual solution is to dis-
cretize all continuous variables at some stage. As suggested above, this is best done
manually at the moment. In the future, we expect the best discretization methods
will be incorporated in Bayesian network tools, so that the process can be automated,
given sufficient statistical data.
There has also been some research on extending the inference algorithms to cope
with some special cases of continuous variables and inference, and these no doubt
will eventually be applied in application tools (e.g., [170]).
© 2004 by Chapman & Hall/CRC Press LLC

9.3.3 Probabilities
The parameters for a BN are a set of conditional probability distributions of child
values given values of parents. There is one distribution for each possible instantia-
tion of parent variables; so the bad news is that the task of probability assessment is
exponential in the number of parent variables. If there is local structure (see
7.4),
of course, the number of parameters to be estimated is reduced.
9.3.3.1 Parameter sources
There are three possible parameter sources.
1. Data
We have previously described some specific methods for learning parameters from
domain data (see Chapter 7). General problems with data include: noise, missing
values and small samples. These can be overcome to a certain extent by using robust
data mining techniques. It is also useful to instrument the domain for collecting data
to use in the future, by adaptation of parameters.
2. Domain Experts
The most basic problem is finding suitable experts who have the time and interest
to assist with the modeling process. Another difficulty is that humans, including ex-
pert humans, almost always display various kinds of bias in estimating probabilities.
These include:
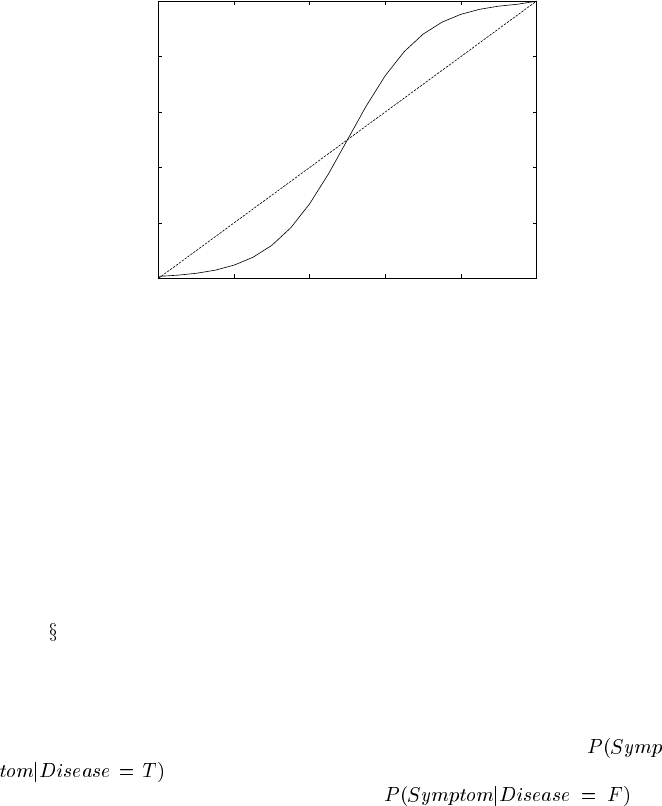
Overconfidence, the tendency to attribute higher than justifiable probabilities
to events that have a probability sufficiently greater than 0.5. Thus, an event
which objectively has a probability of 0.9 will usually be attributed a proba-
bility that is somewhat higher (see Figure 9.8). To be sure, expertise itself has
been found to have a moderating effect on this kind of miscalibration [239].
Anchoring, the tendency for subsequent estimates to be “weighed down” by
an initial estimate. For example, if someone is asked to estimate the average
age of coworkers and begins that process by estimating the average age of
those in a meeting, a high (or low) age at the meeting will very probably bias
the estimate upwards (or downwards) [137].
Availability, that is, assessing an event as more probable than is justifiable,
because it is easily remembered or more salient [278].
There is a large, and problematic, literature on assessing these biases and propos-
als to debias human probability estimates. The latter have met with highly limited
success. The best advice we can give, short of an in-depth exploration of the litera-
ture (and we do recommend some such exploration, as described in
9.6 below), is to
be aware of the existence of such biases, discuss them with the experts who are being
asked to make judgments and to take advantage of whatever statistics are available,
or can be made available, to test human judgments against a more objective standard.
Two attributes of a good elicitation process are (adapted from Morgan and Henrion
[194, pp. 158-159]):
1. The expert should be apprised of what is known about the process, especially
the nearly universal tendency to overconfidence and other forms of bias. In
© 2004 by Chapman & Hall/CRC Press LLC
0
0.2
0.4
0.6
0.8
1
0 0.2 0.4 0.6 0.8 1
FIGURE 9.8
Overconfidence curve: subjective probability (vertical axis) vs. objective probability
(horizontal axis).
order to avoid some of the problems, values should be elicited in random order
and the expert not given feedback on how the different values fit together until
a complete set has been elicited.
2. The elicitation process is not simply one of requesting and recording numbers,
but also one of refining the definitions of variables and terms to be used in
the model. What values are elicited depends directly upon the interpretation
of terms and these should be made as explicit as possible and recorded during
the elicitation. This is a part of the process management described earlier in
9.2.4.
3. The Literature
There may be a published body of knowledge about the application domain. One
common problem with published statistics is sparseness. For example, in a medical
diagnosis domain, the probability of observing a symptom given a disease,
-
, may be available in the medical textbooks (“80% of patients
with TB will present with a cough”), but not
,the
information about the frequency of the symptom occurring when the disease is not
present. There is also a bias in what information is available in the literature: the fact
of its publication reflects interest. These problems can be moderated by using expert
opinion to review the proposed parameterization.
There is a risk involved with combining parameters from different sources, with
different biases. It is not necessarily the case that combining sources with multiple
biases smoothly averages out to no bias, or to a readily measurable and manageable
bias. For an informal example, one author shot baskets at the Exploratorium in San
Francisco with some biased goggles. At first, this resulted in missing to the left,
but fairly soon the brain accommodated the misdirection and the basketball started
hitting the hoop again. As soon as the goggles were removed, however, the shots
© 2004 by Chapman & Hall/CRC Press LLC
missed to the right! The unbiased new input was being combined with an older bias,
leading to error.
9.3.3.2 Probability elicitation for discrete variables
For discrete variables, one approach is direct elicitation, where an expert provides a
number such as “the probability is 0.7.” However, given the problems people have
with such estimation, noted above, other elicitation techniques might be considered.
People are often better at providing frequencies rather than probabilities, such as “1
in 4” or “1 in 10,000” [92], especially for situations where the probabilities involved
are very large or very small. Assessing extreme probabilities directly is difficult, and
orders of magnitude assessments might be tried.
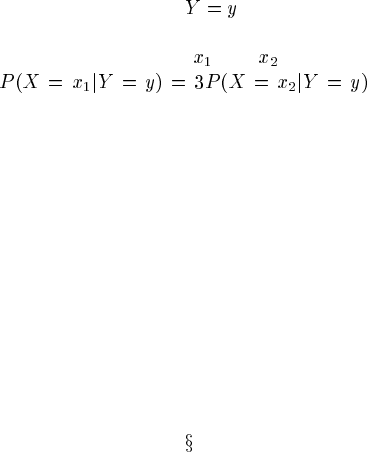
Assessing by odds is often useful. For example, given that
, a domain expert
may report:
“It is three times more likely that variable X has the value than .”
This information gives the equation
,
and only one probability has to be elicited.
An alternative approach is to use qualitative assessment, where the domain expert
describes the probability in common language, such as “very high” or “unlikely.”
Such probability elicitation using a scale with numerical and verbal anchors is de-
scribed in [280]. The verbal cues in that scale were certain, probable, ex-
pected, fifty-fifty, uncertain, improbable and impossible.Hav-
ing been translated from Dutch some of these cues are inappropriate, for example
“uncertain” is ambiguous and could be replaced with “unlikely.” Because
these qualitative phrases can be ambiguous (in fact, this is the problem of linguistic
uncertainty), they can cause miscommunication, especially where more than one
domain expert is involved, unless they are themselves calibrated. It is advisable to
do the mapping of verbal levels to actual probabilities (called the verbal map) sepa-
rately from the probability elicitation exercise. The verbal map should be customized
to suit the individual expert. We have developed a software tool called VE (for Ver-
bal Elicitor) in conjunction with the Netica BN software (see
B.4.8), which supports
the qualitative elicitation of probabilities and verbal maps [109].
An example of VE’s main window for eliciting qualitative probabilities is shown
in Figure 9.9, together with the window editing the verbal map for this tool. The
probabilities associated with each verbal cue are set using a slider bar, and other
verbal cues can be added if desired.
A common problem when eliciting probabilities is that an expert may specify
probabilities that are incoherent, failing to satisfy the probability axioms. For ex-
ample, suppose the verbal mapping shown in Figure 9.9 is being used and that the
expert provides the qualitative assessment of the probabilities for X-ray results given
in Table 9.3.
These probabilities are incoherent, since they do not sum to one for each condi-
tioning case. VE provides a function to correct incoherent probabilities automati-
cally; it uses an iterative, linear optimization to find verbal mappings that are coher-
ent and as close as possible to the original map.
© 2004 by Chapman & Hall/CRC Press LLC
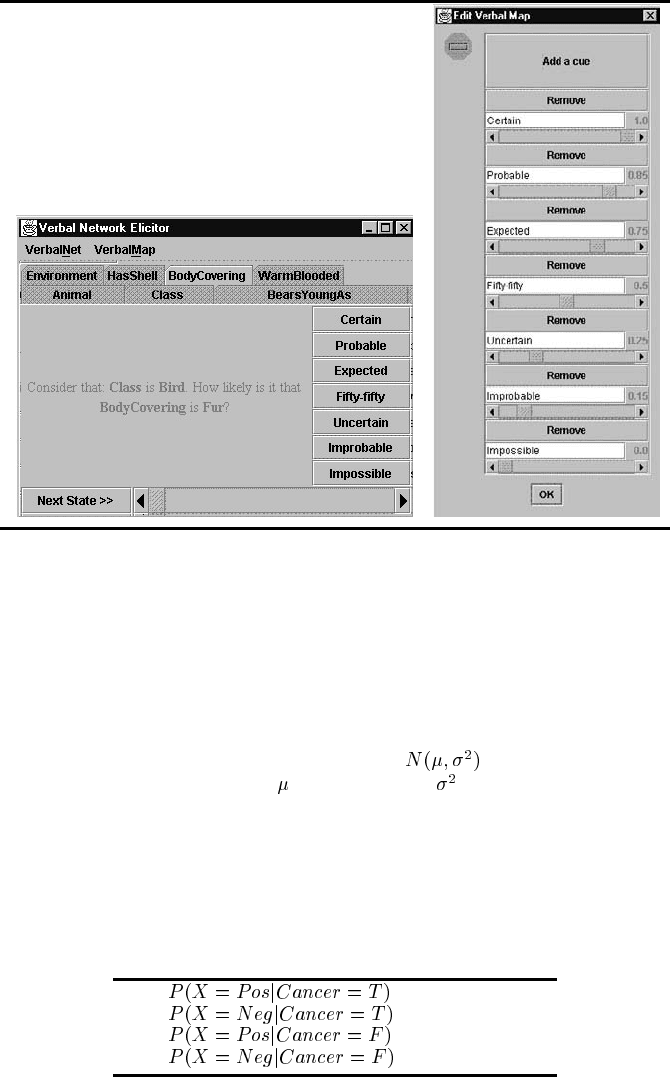
FIGURE 9.9
VE: main elicitation window (left) and the verbal map editing window (right).
9.3.3.3 Probability elicitation for continuous variables
The easiest continuous variables to parameterize are those which are distributed ac-
cording to a parametric model, that is, those which are fully characterized by a
limited number of parameters. The most common example is the Normal distribu-
tion (also known as the Gaussian or “bell curve”),
, which is characterized
by just two parameters, the mean
and the variance . Normal distributions are
used to model: noisy measurement processes (e.g., velocities, the positions of stars);
the central tendencies (average values) of almost any process (e.g., average age or in-
come of samples from a population), which is justified by the central limit theorem of
probability theory; and, by a kind of metaphorical extension, summative measures of
TABLE 9.3
Incoherent qualitative assessments for the X-ray CPT
= Probable
= Improbable
= Uncertain
= Certain
© 2004 by Chapman & Hall/CRC Press LLC
a complex of processes when the individual processes are not well understood (e.g.,
IQ). Another popular parametric distribution is the exponential, which is often used
to model life- and death-processes, such as the life span of an electrical part. Still
other parametric continuous distributions are the Gamma, Chi-square and F distribu-
tions. These, and the discrete parametric distributions (e.g., binomial and Poisson),
form much of the material of probability and statistics classes. They are worth learn-
ing about since in every case one need only obtain a good estimate of only a few
parameters from an expert in order to obtain a good estimate of the entire probability
distribution — assuming, of course, that the variable in question is properly modeled
by the chosen family of distributions!
If the problem is not as simple as estimating a couple of parameters, like the mean
and variance of a normal distribution, then most common is to elicit estimates of key
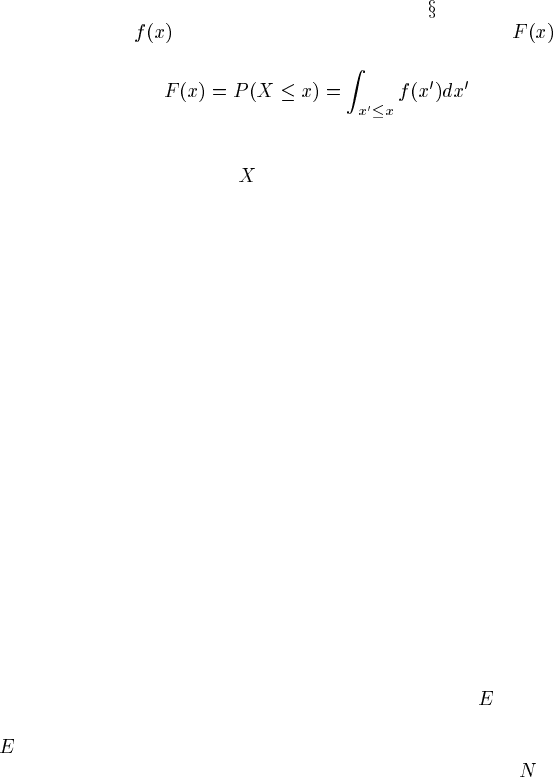
values for the probability density function. Recall from
1.3.2 that if the continuous
density function is
, then the cumulative distribution function is
(9.1)
A likely route to estimating the density function is by bi-sectioning it. First, elicit
the median, the value at which
is equally likely to be found either above or be-
low. Then elicit the 25th percentile by “bisecting” the region below the median into
two further equally likely regions, and then the 75th percentile analogously. This
process can be continued until the density has been sufficiently well refined for the
problem, or until the expert can no longer make meaningful distinctions. This kind
of estimation may be usefully accompanied by the expert simply sketching her or his
impression of the shape of the density function; otherwise one might overlook some-
thing simple and important, such as whether the density is intended to be unimodal
or bimodal, skewed or symmetric, etc.
Having estimated a distribution in this fashion, it may be best and simplest to
find a parametric model (with parameter values) which reproduces the estimated
distribution reasonably well and use that for your Bayesian network model.
9.3.3.4 Support for probability elicitation
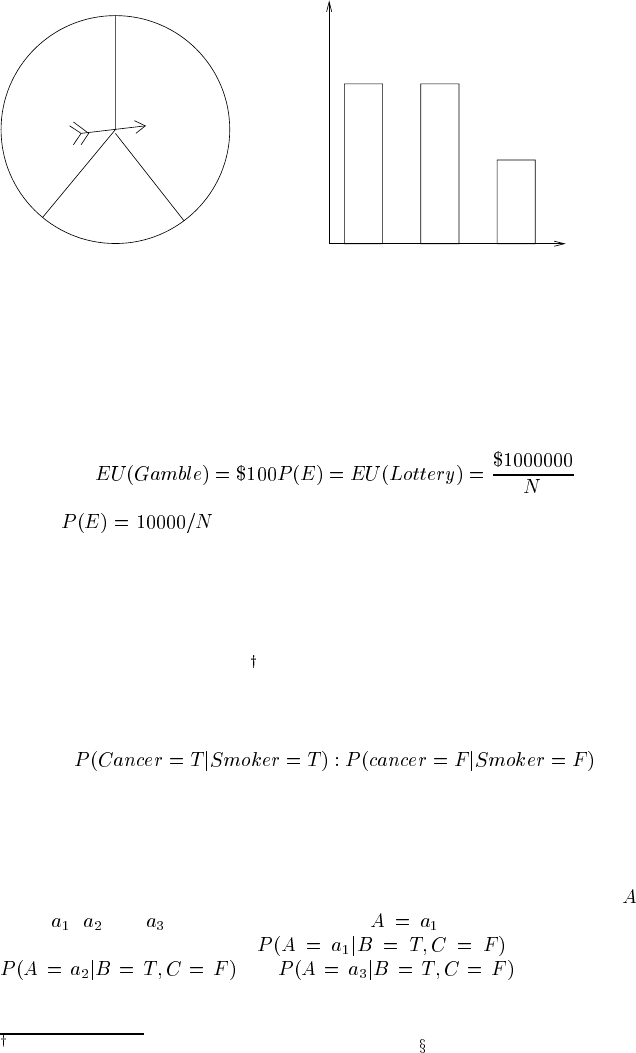
Visual aids are known to be helpful and should be used for probability elicitation (see
Figure 9.10). With a pie chart the expert aims to size a slice of the “pie” so that a
spinner will land in that region with the probability desired. A histogram may help
the expert to order discrete events by probability. As we mentioned, simple freehand
drawings of probability distributions can also be informative.
Lotteries can be used to force estimates of either probabilities or utilities, in tech-
niques going back to Ramsey [231]. Given clear utility values, say dollars, you can
elicit someone’s estimated probability of an uncertain event
by finding at what
point the person is indifferent between two gambles: the first one paying, say, $100
if
comes true; the second one paying, say, $1 million if a (free) lottery ticket Wins.
Since the two gambles are considered equivalued, we have (where
is the number
© 2004 by Chapman & Hall/CRC Press LLC
Red Green
Blue
Probability
Red Green Blue
(b)(a)
(a)
FIGURE 9.10
Examples of visual aids for probability elicitation: (a) pie chart; (b) histogram.
of lottery tickets required to reach indifference):
(9.2)
Hence,
. Lotteries can be used analogously to elicit unclear utili-
ties for an outcome state by manipulating the probability of reaching that state until
the expert is indifferent between the proposed gamble and some lottery ticket with
known value and probability of winning.
Our VE software tool provides a number of useful automated functions that facili-
tate probability elicitation. One function normalizes CPTs, allowing users to specify
ratios in place of probabilities
. For example, if the expert thinks that someone
has three times the chance of getting cancer as not getting cancer (say if they are a
smoker), they can specify
as 3:1, which the tool translates into the probabilities 0.75 and 0.25, respectively.
VE can also perform a maximum entropy fill of CPTs, where the remaining prob-
abilities are filled in uniformly with the probability remaining after subtracting sup-
plied probabilities from 1. This means the expert need only provide probabilities
for combinations about which s/he is confident. For example, if the variable
has
states
, and , and the probability for given some combination of
values for its parent variables,
is set to 0.95, then
and will both be set to
0.025 automatically.
Note that some other software packages have this feature — see B.4.
© 2004 by Chapman & Hall/CRC Press LLC
interaction: prevention
interaction: XOR
interaction: synergy
non−interaction: addition
CC
PP
Flu
Cough
Smallpox Vaccine
Acid Smoking
TB
Death
Pollution
Cancer
Alkali
Death
FIGURE 9.11
Different qualitative causal relationships.
9.3.4 Local structure
When parameterizing the relation between parents and a child node, the possibility of
there being “local structure” was discussed in Chapter 7 in the context of automated
parameter learning. It is also of interest in the elicitation process, of course. There
are various kinds of causal interaction, such as those displayed in Figure 9.11. A
classic example of interaction between causes is XOR, where each cause cancels the
other out. The alkali/acid case (
7.4.1) is an example of this: one might ingest alkali,
and die; one might instead ingest acid, and die; but if one ingests both alkali and
acid together, then one may well not die.
Other causal interactions include prevention, where one causal factor intervenes
to stop another, such as a Vaccine preventing Smallpox leading to Death. And again
there is the possibility of synergy, where the effects are reinforced by the occurrence
of both causes beyond the mere addition of the effects independently. All of these
relationships can be looked for explicitly during an elicitation process. For example,
Q: “Given that Acid and Alkali are independently causes of Death, when taken
jointly what happens to the risk?”
A: “It is decreased.”
Modeling: in this case, the causal interaction is clearly an XOR type.
These kinds of interaction imply that the probabilities associated with one or more
of the possible instantiations of the parents are independent of the probabilities as-
sociated with the other parent instantiations. For example, knowing what happens
when you ingest Acid but not Alkali tells you little or nothing about what happens
when you ingest both.
Local structure is the opposite situation: there is some structure across the different
parent instantiations that allows you to infer some probabilities from the others. We
© 2004 by Chapman & Hall/CRC Press LLC