Jenkins N., Strbac G., Ekanayake J. Distributed Generation
Подождите немного. Документ загружается.

From (3.36), it may be seen that each component voltage drop only depends on
that component current and the reactance.
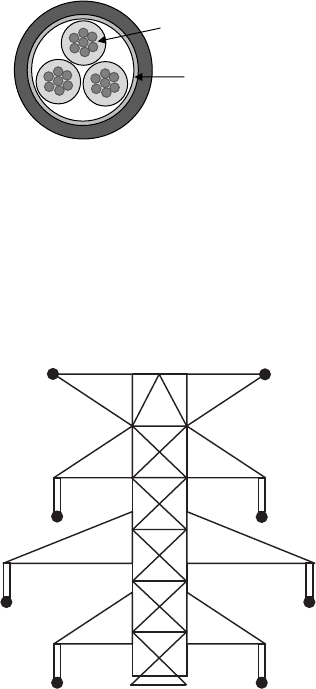
Figure 3.25 shows the cross section of a cable. As the three conductors are
equally spaced, the cable may be considered a symmetrical element with similar
distribution of magnetic flux around each conductor. For such a symmetrical non-
rotating element, the positive and negative sequence inductances are equal.
Conductor
Sheath
Figure 3.25 Cross section of a three-phase cable
The flux that links with the sheath (which is earthed) determines the zero
sequence inductance, with a different value to the other two sequence components.
A section of an overhead line is shown in Figure 3.26. In this case flux linkages
between different phases are not equal and therefore the positive and negative
sequence inductances are different [5].
The internal impedance of a generator, expressed in sequence values, depends
on its construction. The magnetic field produced by the positive sequence currents
rotates in the same direction as the rotor; thus with respect to the rotor it is sta-
tionary. The field produced by the negative sequence currents rotates in the
Conductor
A-phase
Shield wire
Conductor
B-phase
Conductor
C-phase
Figure 3.26 A section of an overhead line
Distributed generators and their connection to the system 77
opposite direction to the rotor. Therefore with respect to the rotor that magnetic
field rotates at twice the rotor speed. These differences lead to different positive
and negative sequence impedances.
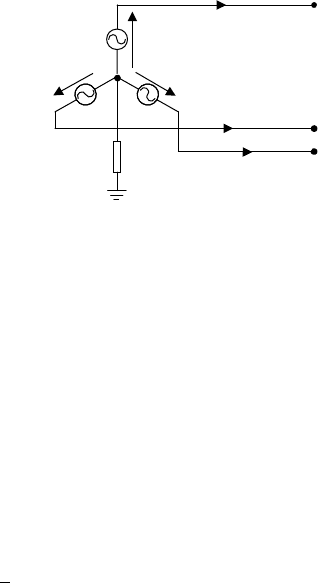
Consider an ideal, balanced three-phase source shown in Figure 3.27 where
neutral point, N, is earthed through an impedance Z
n
.
A
B
C
I
C
I
B
I
A
N
V
B
V
A
V
C
Z
n
Figure 3.27 Three-phase source
The internal generated voltages of each phase are given by the following three
equations where E is the rms value of the internal voltage and:
E
A
¼ Eff0
¼ E
E
B
¼ Eff120
¼ Eff240
¼ l
2
E
E
C
¼ Eff240
¼ Eff120
¼ lE
9
=
;
ð3:37Þ
From (3.32) and (3.37) (note that from Figure IV.8 of the Tutorial Chapter IV
ð1 þ l þ l
2
Þ¼0, ð1 þ 2l
3
Þ¼3 and ð1 þ l
2
þ l
4
Þ¼0):
V
A0
V
A1
V
A2
2
4
3
5
¼
1
3
11 1
1 ll
2
1 l
2
l
2
4
3
5
E
l
2
E
lE
2
4
3
5
¼
0
E
0
2
4
3
5
ð3:38Þ
From (3.38), it is clear that the ideal three-phase source does not produce any
negative or zero sequence voltages. Therefore, a three-phase source can be repre-
sented by three sequence networks where the positive sequence network has a voltage
equal to E
A
¼ E and the negative and zero sequence networks have zero voltages.
Three sequence voltages are represented behind the internal impedance of the
source. With positive sequence impedance of Z
1
, the positive sequence network
with respect to the neutral was obtained as:
V
A1
¼ E
A
I
A1
Z
1
ð3:39Þ
78 Distributed generation
With negative sequence impedance of Z
2
the negative sequence network with
respect to the neutral was obtained as:
V
A2
¼I
A2
Z
2
ð3:40Þ
Finally with zero sequence impedance of Z
0
, the zero sequence network with
respect to earth was obtained as:
V
A0
¼ V
N
I
A0
Z
0
ð3:41Þ
Since the impedance between the neutral and earth is Z
n
, then:
V
N
¼I
A
þI
B
þI
C
½
Z
n
ð3:42Þ
From (3.35), I
A
þI
B
þI
C
½¼3I
A0
and therefore from (3.42):
V
N
¼3I
A0
Z
n
ð3:43Þ
By substituting for V
N
from (3.43) into (3.41):
V
A0
¼I
A0
ðZ
0
þ 3Z
n
Þð3:44Þ
Three sequence networks for a three-phase source are shown in Figure 3.28. If
the source is delta connected or star connected without a neutral then Z
0
!1.
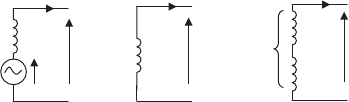
For a transformer, the positive and negative sequence impedances are equal.
Depending on the connection used for the primary and secondary of the transfor-
mer, the zero sequence component current is transferred from the primary to sec-
ondary or is blocked (Table 3.1).
Once the sequence component networks of the power system are known, then
the asymmetrical currents are obtained by connecting the networks in different
arrangements. The connection of three sequence networks depends on the type of
the fault:
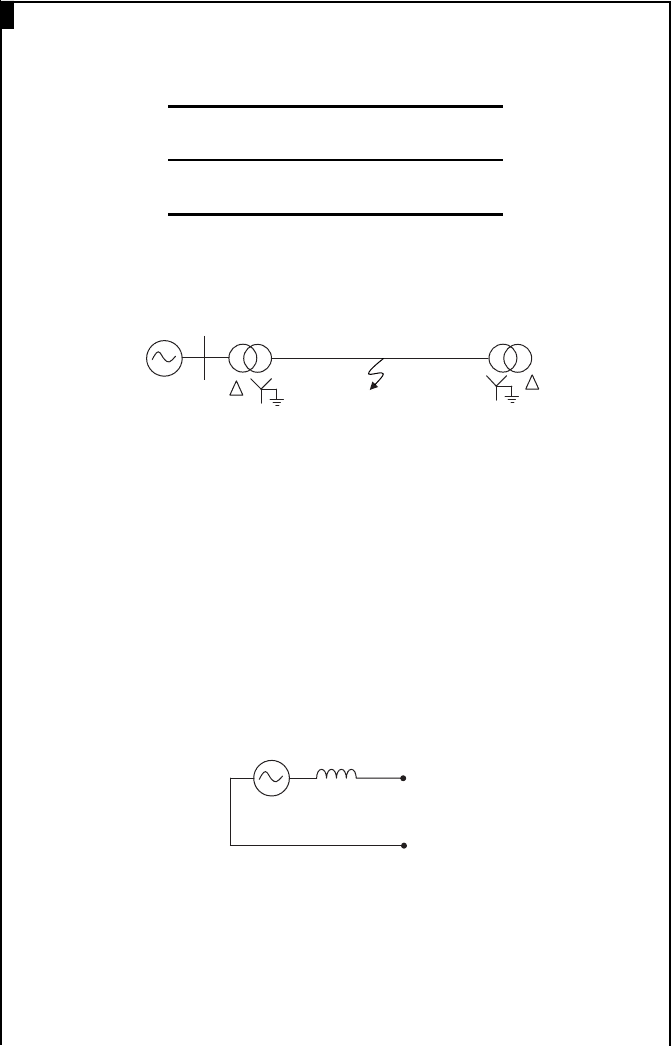
A line-to-earth fault through a fault impedance, Z
f
, is shown in Figure 3.29.
+ve sequence zero sequence
E
A
Z
1
I
A1
V
A1
Z
2
I
A2
V
A2
V
A0
Z
0
3Z
n
I
A0
Z
′
0
ve sequence
Figure 3.28 Sequence networks for a three-phase source
Distributed generators and their connection to the system 79
Table 3.1 Zero sequence component and transformer connection
Transformer connection Sequence networks (see Figure IV.6)
Primary Secondary Positive and negative Zero
X
V
1
V
2
X
V
1
V
2
Zero sequence current flows
from the primary side to the
secondary side.
V
2
X
V
1
Zero sequence current
enters the transformer from
the primary side but will not
flow to the secondary side
as the unearthed star blocks
the zero sequence current.
V
2
X
V
1
Zero sequence current enters
the transformer from the
primary side but will not
flow to the secondary side
as the currents circulate in
the delta loop.
E
A
Z
s
N
I
A
I
B
I
C
Z
n
V
A
Z
f
Figure 3.29 Line-to-earth fault
80 Distributed generation
In this case, the fault current in the B and C phases are zero and fault current
only flows in A phase. From symmetrical components, when I
B
¼ I
C
¼ 0:
I
A0
I
A1
I
A2
2
6
4
3
7
5
¼
1
3
11 1
1 ll
2
1 l
2
l
2
6
4
3
7
5
I
A
0
0
2
6
4
3
7
5
;I
A0
¼ I
A1
¼ I
A2
¼
1
3
I
A
ð3:45Þ
From Figure 3.29:
V
A
¼ I
A
Z
f
ð3:46Þ
Now substituting for V
A
and I
A
with their symmetrical components (see
(IV.26)):
V
A1
þV
A2
þV
A0
¼ I
A1
þI
A2
þI
A0
½Z
f
ð3:47Þ
Substituting from (3.45) into (3.47), the following equation is obtained:
V
A1
þV
A2
þV
A0
¼ 3I
A0
Z
f
ð3:48Þ
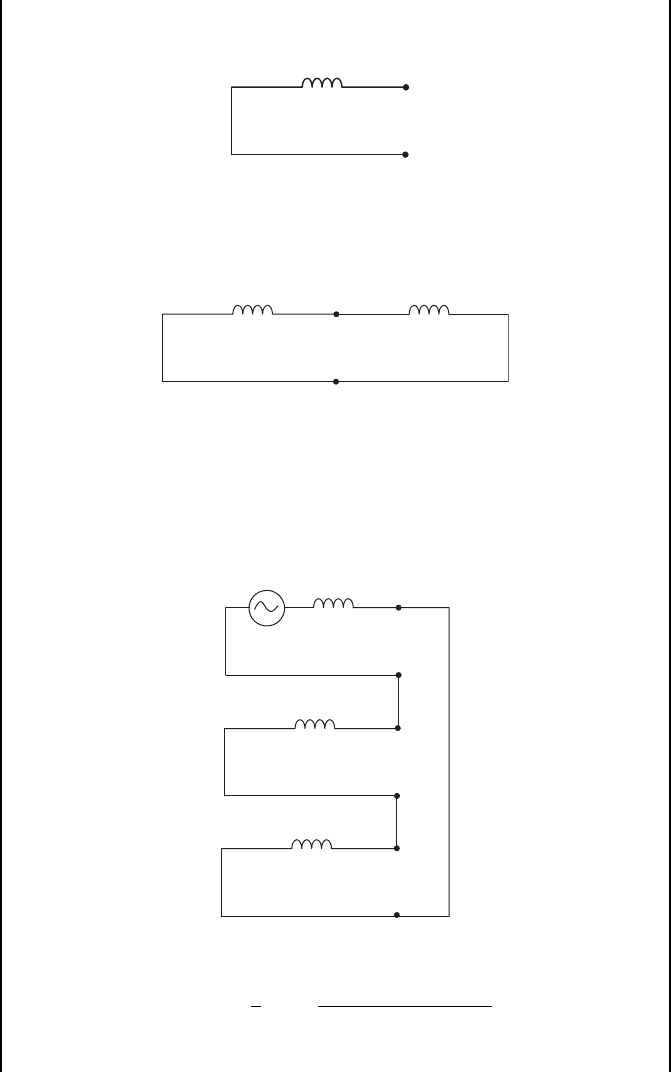
It is clear that if the sequence networks are connected in series, as shown in
Figure 3.30, then both (3.45) and (3.48) are satisfied.
E
A
Z
1
I
A1
V
A1
Z
2
I
A2
V
A2
V
A0
Z
0
3Z
n
I
A0
3Z
f
Z
′
0
Figure 3.30 Connection of sequence networks for a line-to-earth fault
The formation of the sequence networks for other types of faults are given in
Appendix (A3.1).
Distributed generators and their connection to the system 81
EXAMPLE 3.6
For the circuit shown, on 50 MVA base the sequence impedances of the
components are:
Positive
sequence
Negative
sequence
Zero
sequence
Circuit j0.6 j0.6 j1.5
Transformer j0.1 j0.1 j0.1
A single phase to earth fault occurred at the mid point of the line. Find
the fault current.
33 kV Circuit
Grid 400
MVA
Answer:
Positive sequence network:
The fault level at the grid in-feed = 400/50 pu = 8 pu.
Source impedance = 1/8 pu = 0.125 pu.
Transformer impedance = 0.1 pu.
Line impedance = 0.6/2 = 0.3 pu.
Therefore, the total positive sequence impedance to the fault:
Z
1
¼ jð0:125 þ 0:1 þ 0:3Þ¼j0:525 pu
The positive sequence network is given by:
j 0.525 pu
1 pu
Fault
point
Negative sequence network:
Transformer impedance = 0.1 pu
Line impedance = 0.6/2 = 0.3 pu
The total negative sequence impedance to the fault:
Z
2
¼ jð0:1 þ 0:3Þ¼j 0: 4pu
82 Distributed generation
The negative sequence network is given by:
j0.4 pu
Fault
point
Zero sequence network:
For zero sequences, it is considered that the line is connected to the earth
from both ends (due to star earth on the transformers). Therefore, the zero
sequence network is given by:
j0.75 pu
Fault
point
j0.75 pu
Therefore, the total negative sequence impedance to the fault:
Z
0
¼ j0:75=2 ¼ j0:375 pu
For a single phase to earth fault, three sequence networks are connected in
series. Assuming that the fault impedance Z
f
= 0, the equivalent circuit for a
line-to-earth fault is given by:
j0.4 pu
j0.375 pu
j0.525 pu
1 pu
Fault
point
From the above figure and from (3.45):
I
A0
¼ I
A1
¼ I
A2
¼
1
3
I
A
¼
1
0:525 þ 0:4 þ 0:375
¼ 0 :77 pu
Distributed generators and their connection to the system 83
Therefore, the fault current = 3 0.77 = 2.31 pu.
On 50 MVA, 33 kV (line) base, the current base is given by:
I
b
¼
S
b
3V
b
¼
50 10
6
3 ð33 10
3
=
ffiffiffi
3
p
Þ
¼ 874: 78 A
Therefore, the fault current = 874.78 2.31 = 2020.7 A.
3.4 Case studies
3.4.1 Steady-state voltages under peak and minimum loading
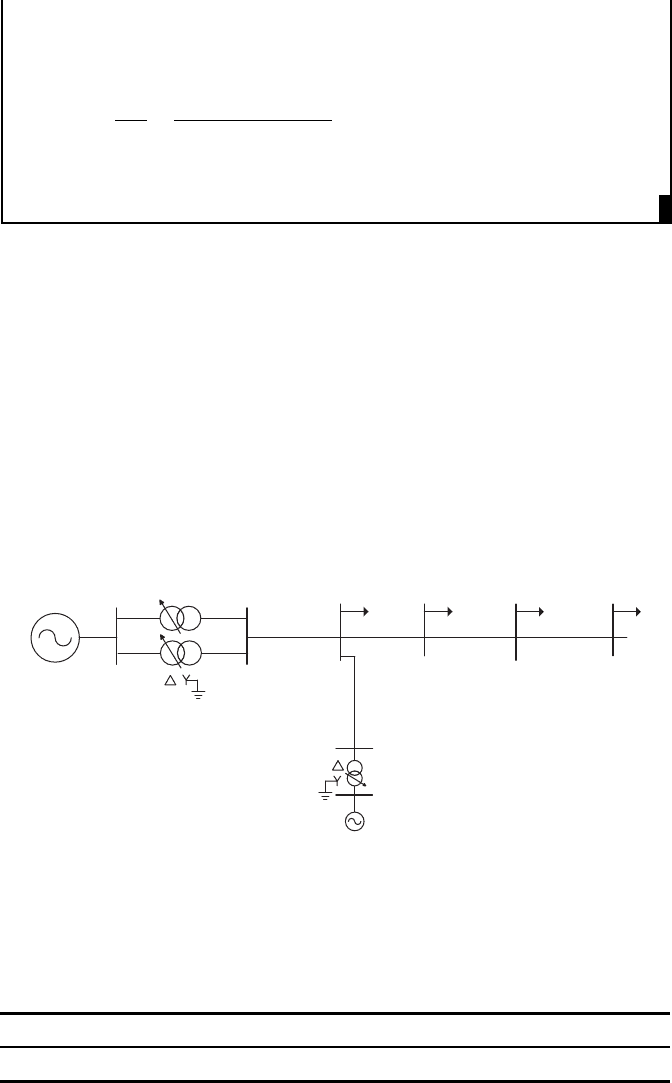
A section of a weak 33 kV network is shown in Figure 3.31. The generator con-
nected to Bus 1 represen ts the grid in-feed, which supplies power from the 132 kV
transmission system to the 33 kV distribution network. The fault level at the grid in-
feed is 1850 MVA. The generator, transformer, line and load data are given in
Tables 3.2–3.5. The 132/33 kV transformer has an on-load tap changer which
maintains Bus 2 at a voltage at 1.005 pu. The tap changer at the distributed gen-
erator (DG) is off-load and set to 0%.
Bus 1 Bus 2 Bus 3 Bus 4 Bus 5 Bus 6
Bus 7
Distributed generator
Figure 3.31 33 kV distribution system with a distributed generator
Table 3.2 Distributed generator data
Name MVA rating X
d
(pu) X
d
0
(pu) X
q
(pu) T
d
(s)
DG 8 0.29 0.16 0.29 4.5
84 Distributed generation
1. Steady-state voltages, power flows and losses
A load flow study was carried out using the IPSA package and voltages; power
flows and losses were obtained for peak and minimum loading conditions. Figure
3.32 shows the load flow under peak and minimum loading conditions when DG is
importing VArs (0.95 leading power factor). It is clear from the diagram that during
the peak loading condition power flows from upstream to downstream via the line
between Buses 2 and 3. However, during the minimum loading condition excess
power in the distribution network is fed back to the grid.
Table 3.6 shows the voltage on busbars 3, 4, 5 and 6 and losses when a dis-
tributed generator is not connected, when it is operating at unity, 0.95 lagging
(exporting VArs
7
) and 0.95 leading (importing VArs) power factors. As the network
is weak (with a high impedance), under peak loading condition the voltage at some
busbars are below the limit (6%) when the distributed generator is not connected.
The distributed generator reduced the power flow in the line between Bus 2 and 3,
thus reducing the losses. When the distributed generator operates at unity power
Table 3.4 Circuit data
From bus To bus Length (km) R (pu/km) X (pu/km)
Bus 2 Bus 3 17.2
Bus 3 Bus 4 12.0
Bus 3 Bus 7 0.5 0.016250 0.034435
Bus 4 Bus 5 0.8
Bus 5 Bus 6 1.4
Table 3.5 Load data (all loads have a lagging power factor)
Busbar Peak Minimum
P (MW) Q (MVAr) P (MW) Q (MVAr)
3 2.0 0.48 0.25 0.06
4 2.0 0.48 0.25 0.06
5 2.4 0.56 0.30 0.07
6 3.2 0.80 0.40 0.10
Table 3.3 Transformer data
From bus To bus MVA rating Winding Reactance (%)
Bus 1 Bus 2 31.50 Yd1 10.5
Bus 7 DG 11.00 Yd1 8.8
7
Note that for a load, lagging power factor means it absorbs reactive power.
Distributed generators and their connection to the system 85
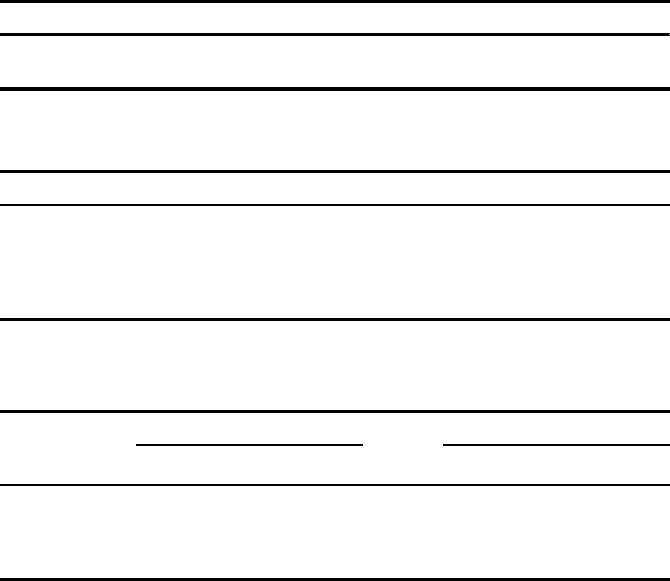
For peak loading condition
Bus 7
Bus 7
Bus 1 Bus 2 Bus 3 Bus 4 Bus 5 Bus 6
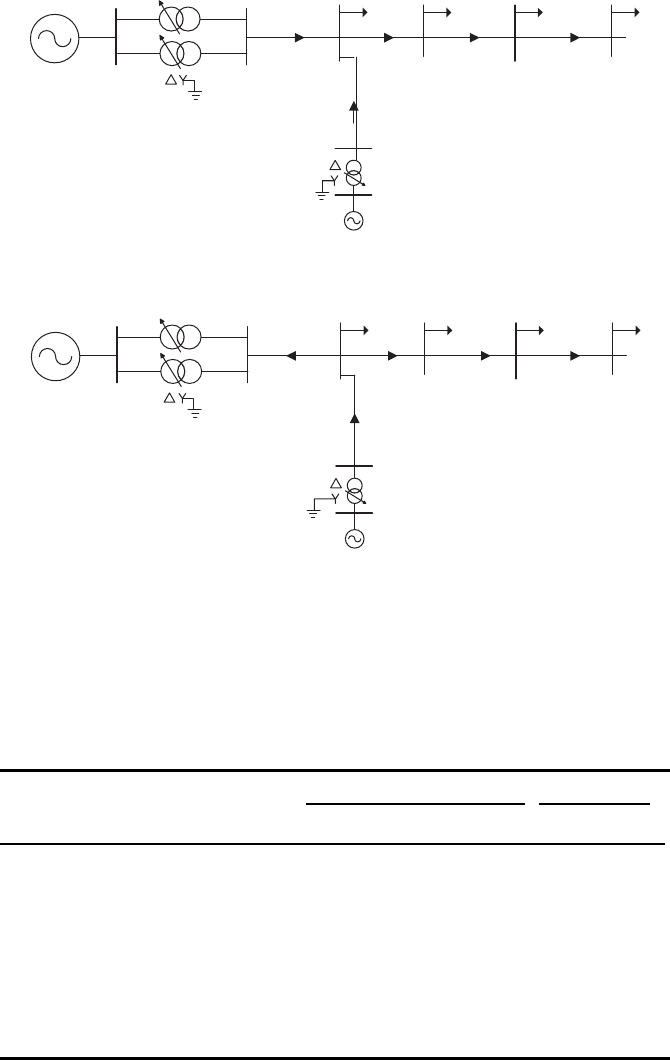
Bus 1 Bus 2 Bus 3 Bus 4 Bus 5 Bus 6
DG
For minimum loadin
g
condition
DG
P = 1.87
Q = 6.01
P = 7.75
Q = 2.16
P = 5.61
Q = 1.38
P = 3.21
Q = 0.81
P = 8.0
Q = −2.5
P = 6.79
Q = −3.73
P = 0.95
Q = 0.23
P = 0.70
Q = 0.17
P = 0.4
Q = 0.1
P = 7.99
Q = −2.5
Figure 3.32 Power flows in peak and minimum loading conditions (P in MW and
Q in MVAr)
Table 3.6 8 MVA distributed generator is connected to Bus 3
Voltage (pu) Losses
Bus 3 Bus 4 Bus 5 Bus 6 MW MVAr*
Peak loading
No distributed generator 0.959 0.934 0.933 0.932 0.46 1.15
Distributed generator at unity pf 0.981 0.957 0.956 0.955 0.18 0.94
Distributed generator at 0.95 pf leading 0.964 0.940 0.939 0.938 0.26 1.25
Distributed generator at 0.95 pf lagging 0.996 0.973 0.972 0.970 0.15 0.88
Minimum loading
No distributed generator 1.000 0.997 0.997 0.997 0.01 0.02
Distributed generator at unity pf 1.018 1.015 1.015 1.015 0.13 0.85
Distributed generator at 0.95 pf leading 1.003 1.000 1.000 1.000 0.17 1.04
Distributed generator at 0.95 pf lagging 1.032 1.030 1.030 1.030 0.14 0.87
*Reactive power losses are the reactive power absorbed by the circuits.
86 Distributed generation