Jacques I. Mathematics for Economics and Business
Подождите немного. Документ загружается.


Non-linear Equations
120
Practice Problem
3 Write down the solutions to the following quadratic equations. (There is no need to multiply out the
brackets.)
(a)
(x − 4)(x + 3) = 0
(b) x(10 − 2x) = 0
(c) (2x − 6)
2
= 0
Example
Write down the solutions to the following quadratic equations:
(a) x(3x − 4) = 0 (b) (x − 7)
2
= 0
Solution
(a) If x(3x − 4) = 0 then either x = 0 or 3x − 4 = 0
The first gives the solution x = 0 and the second gives x = 4/3.
(b) If (x − 7)(x − 7) = 0 then either x − 7 = 0 or x − 7 = 0
Both options lead to the same solution, x = 7.
are the same as those of
(x + 1)(x + 2) = 0
Now the only way that two numbers can be multiplied together to produce a value of zero is
when (at least) one of the numbers is zero.
if ab
==
0 then either a
==
0 or b
==
0 (or both)
It follows that either
x + 1 = 0 with solution x =−1
or
x + 2 = 0 with solution x =−2
The quadratic equation
x
2
+ 3x + 2 = 0
therefore has two solutions, x =−1 and x =−2.
The difficulty with this approach is that it is impossible, except in very simple cases, to work
out the factorization from any given quadratic, so the preferred method is to use the formula.
However, if you are lucky enough to be given the factorization, or perhaps clever enough to
spot the factorization for yourself, then it does provide a viable alternative.
MFE_C02a.qxd 16/12/2005 10:59 Page 120
One important feature of linear functions is that their graphs are always straight lines.
Obviously the intercept and slope vary from function to function, but the shape is always the
same. It turns out that a similar property holds for quadratic functions. Now, whenever you are
asked to produce a graph of an unfamiliar function, it is often a good idea to tabulate the func-
tion, to plot these points on graph paper and to join them up with a smooth curve. The precise
number of points to be taken depends on the function but, as a general rule, between 5 and
10 points usually produce a good picture.
2.1 • Quadratic functions
121
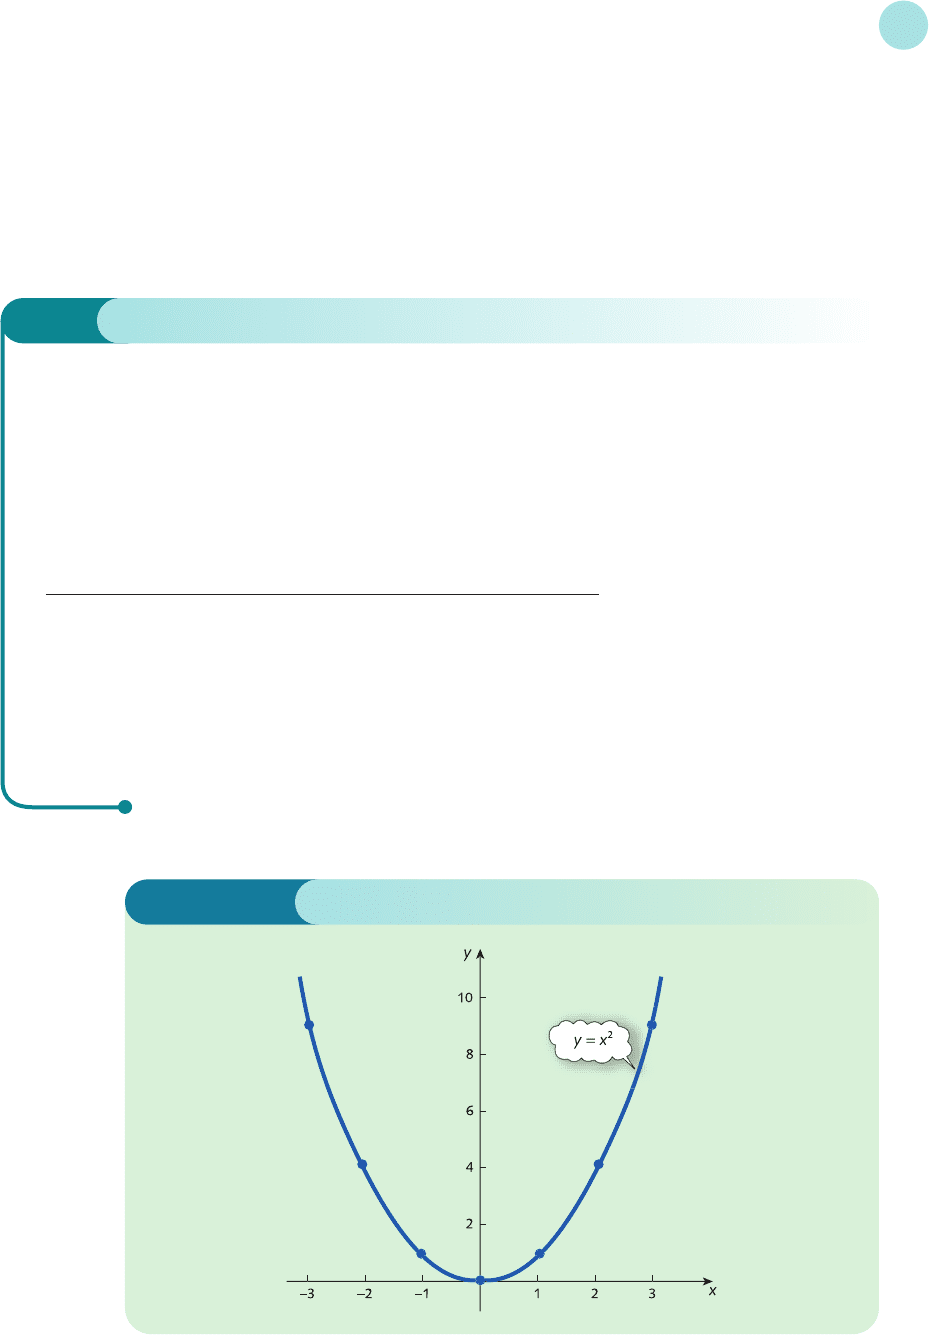
Example
Sketch a graph of the square function, f(x) = x
2
.
Solution
A table of values for the simple square function
f(x) = x
2
is given by
x −3 −2 −10123
f(x) 9 4 10149
The first row of the table gives a selection of ‘incoming’ numbers, x, while the second row shows the cor-
responding ‘outgoing’ numbers, y. Points with coordinates (x, y) are then plotted on graph paper to
produce the curve shown in Figure 2.1. For convenience, different scales are used on the x and y axes.
Mathematicians call this curve a parabola, whereas economists refer to it as U-shaped. Notice that
the graph is symmetric about the y axis with a minimum point at the origin; if a mirror is placed along the
y axis then the left-hand part is the image of the right-hand part.
Figure 2.1
MFE_C02a.qxd 16/12/2005 10:59 Page 121

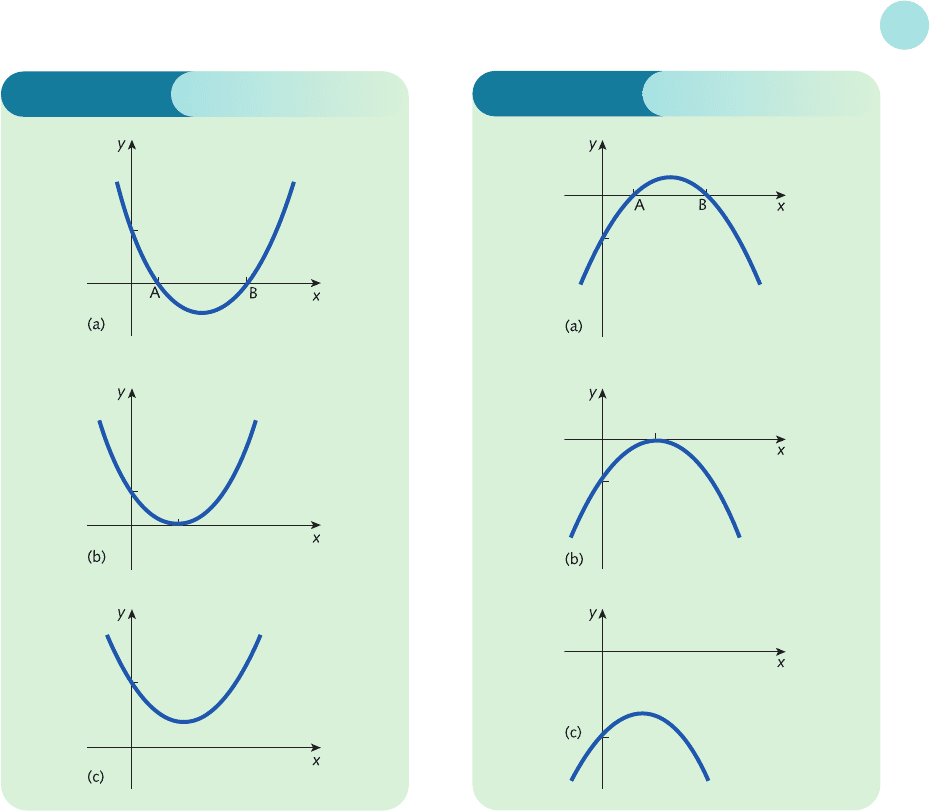
The results of Practice Problem 4 suggest that the graph of a quadratic is always parabolic.
Furthermore, whenever the coefficient of x
2
is positive, the graph bends upwards and is a ‘happy’
parabola (U shape). A selection of U-shaped curves is shown in Figure 2.2. Similarly, when the
coefficient of x
2
is negative, the graph bends downwards and is a ‘sad’ parabola (inverted
U shape). A selection of inverted U-shaped curves is shown in Figure 2.3.
The task of sketching graphs from a table of function values is extremely tedious, particu-
larly if only a rough sketch is required. It is usually more convenient just to determine a few
key points on the curve. The obvious points to find are the intercepts with the coordinate
axes, since these enable us to ‘tether’ the parabola down in the various positions shown in
Figures 2.2 and 2.3. The curve crosses the y axis when x = 0. Evaluating the function
f(x) = ax
2
+ bx + c
Non-linear Equations
122
Advice
The following problem is designed to give you an opportunity to tabulate and sketch
graphs of more general quadratic functions. Please remember that when you substitute
numbers into a formula you must use BIDMAS to decide the order of the operations. For
example, in part (a) you need to substitute x =−1 into 4x
2
− 12x + 5. You get
4(−1)
2
− 12(−1) + 5
= 4 + 12 + 5
= 21
Note also that when using a calculator you must use brackets when squaring negative
numbers. In this case a possible sequence of key presses might be
=5+1(−)×12−x
2
)1(−)(4
Practice Problem
4 Complete the following tables of function values and hence sketch a graph of each quadratic function.
(a)
f(x) = 4x
2
− 12x + 5
x −101234
f(x)
(b) f(x) =−x
2
+ 6x − 9
x 0123456
f(x)
(c) f(x) =−2x
2
+ 4x − 6
x −2 −101234
f(x)
MFE_C02a.qxd 16/12/2005 10:59 Page 122
at x = 0 gives
f(0) = a(0)
2
+ b(0) + c = c
so the constant term determines where the curve cuts the vertical axis (as it did for linear func-
tions). The curve crosses the x axis when y = 0 or, equivalently, when f(x) = 0, so we need to
solve the quadratic equation
ax
2
+ bx + c = 0
This can be done using ‘the formula’ and the solutions are the points where the graph cuts the
horizontal axis. In general, a quadratic equation can have two, one or no solutions and these
possibilities are illustrated in cases (a), (b) and (c) in Figures 2.2 and 2.3. In case (a) the curve
crosses the x axis at A, turns round and crosses it again at B, so there are two solutions. In case
(b) the curve turns round just as it touches the x axis, so there is only one solution. Finally,
in case (c) the curve turns round before it has a chance to cross the x axis, so there are no
solutions.
The strategy for sketching the graph of a quadratic function
f(x) = ax
2
+ bx + c
may now be stated.
2.1 • Quadratic functions
123
Figure 2.2
Figure 2.3
MFE_C02a.qxd 16/12/2005 10:59 Page 123

Step 1
Determine the basic shape. The graph has a U shape if a > 0, and an inverted U shape if a < 0.
Step 2
Determine the y intercept. This is obtained by substituting x = 0 into the function, which
gives y = c.
Step 3
Determine the x intercepts (if any). These are obtained by solving the quadratic equation
ax
2
+ bx + c = 0
This three-step strategy is illustrated in the following example.
Non-linear Equations
124
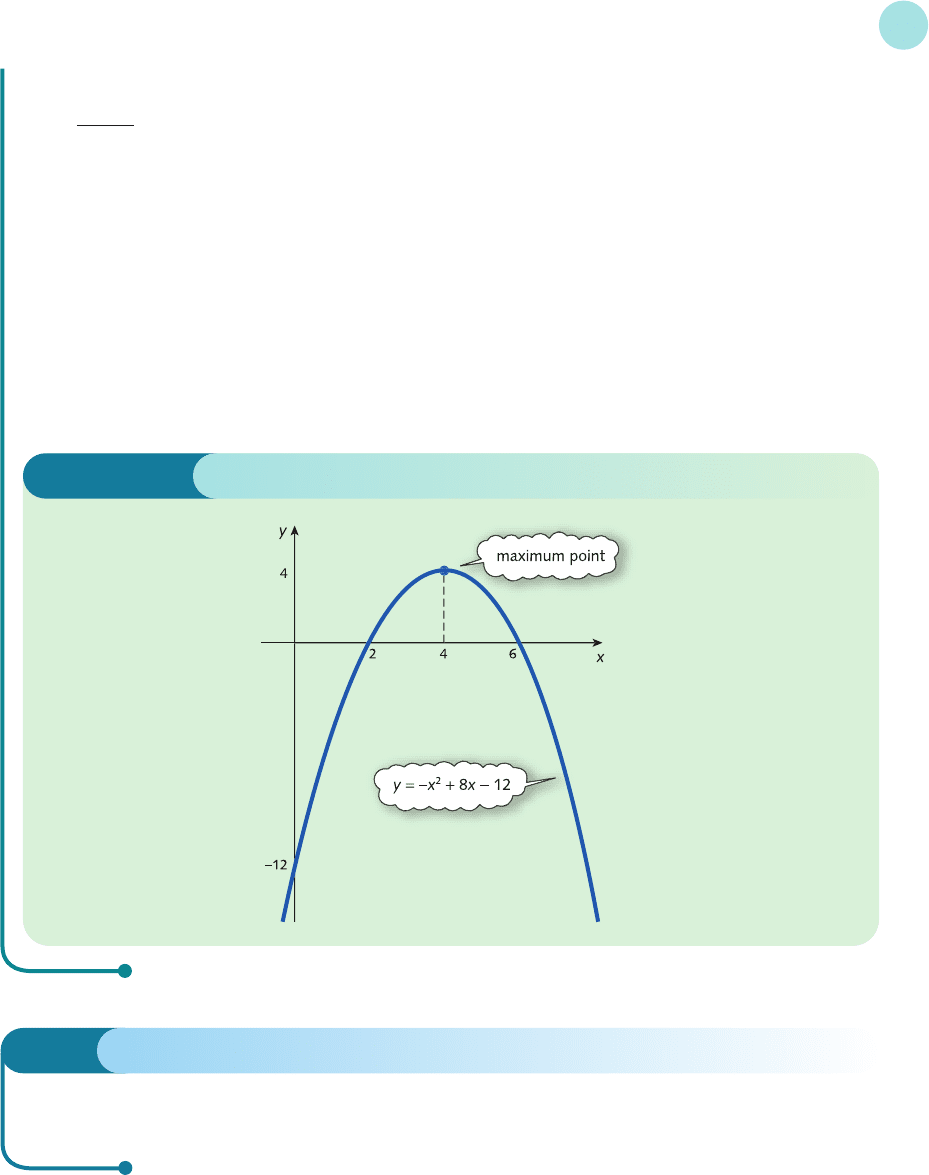
Example
Give a rough sketch of the graph of the following quadratic function:
f(x) =−x
2
+ 8x − 12
Solution
For the function
f(x) =−x
2
+ 8x − 12
the strategy is as follows.
Step 1
The coefficient of x
2
is −1, which is negative, so the graph is a ‘sad’ parabola with an inverted U shape.
Step 2
The constant term is −12, so the graph crosses the vertical axis at y =−12.
Step 3
For the quadratic equation
−x
2
+ 8x − 12 = 0
the formula gives
x ==
==
so the graph crosses the horizontal axis at
x ==2
−+
−
84
2
−±
−
84
2
−±
−
816
2
−± −
−
86448
2
( )
−± − − −
−
884112
21
2
( ()( ))
()
MFE_C02a.qxd 16/12/2005 10:59 Page 124
and
x ==6
The information obtained in steps 1–3 is sufficient to produce the sketch shown in Figure 2.4.
In fact, we can go even further in this case and locate the coordinates of the turning point – that is, the
maximum point – on the curve. By symmetry, the x coordinate of this point occurs exactly halfway between
x = 2 and x = 6: that is, at
x =
1
/2(2 + 6) = 4
The corresponding y coordinate is found by substituting x = 4 into the function to get
f(4) =−(4)
2
+ 8(4) − 12 = 4
The maximum point on the curve therefore has coordinates (4, 4).
−−
−
84
2
2.1 • Quadratic functions
125
Practice Problem
5 Use the three-step strategy to produce rough graphs of the following quadratic functions:
(a)
f(x) = 2x
2
− 11x − 6 (b) f(x) = x
2
− 6x + 9
We conclude this section by seeing how to solve a particular problem in microeconomics.
In Section 1.3 the concept of market equilibrium was introduced and in each of the problems
the supply and demand functions were always given to be linear. The following example shows
this to be an unnecessary restriction and indicates that it is almost as easy to manipulate
quadratic supply and demand functions.
Figure 5.2
MFE_C02a.qxd 16/12/2005 10:59 Page 125

Non-linear Equations
126
Example
Given the supply and demand functions
P = Q
2
S
+ 14Q
S
+ 22
P =−Q
2
D
− 10Q
D
+ 150
calculate the equilibrium price and quantity.
Solution
In equilibrium, Q
S
= Q
D
, so if we denote this equilibrium quantity by Q, the supply and demand functions
become
P = Q
2
+ 14Q + 22
P =−Q
2
− 10Q + 150
Hence
Q
2
+ 14Q + 22 =−Q
2
− 10Q + 150
since both sides are equal to P. Collecting like terms gives
2Q
2
+ 24Q − 128 = 0
which is just a quadratic equation in the variable Q. Before using the formula to solve this it is a good idea
to divide both sides by 2 to avoid large numbers. This gives
Q
2
+ 12Q − 64 = 0
and so
Q =
=
=
The quadratic equation has solutions Q =−16 and Q = 4. Now the solution Q =−16 can obviously
be ignored because a negative quantity does not make sense. The equilibrium quantity is therefore 4. The
equilibrium price can be calculated by substituting this value into either the original supply or demand
equation.
From the supply equation,
P = 4
2
+ 14(4) + 22 = 94
As a check, the demand equation gives
P =−(4)
2
− 10(4) + 150 = 94 ✓
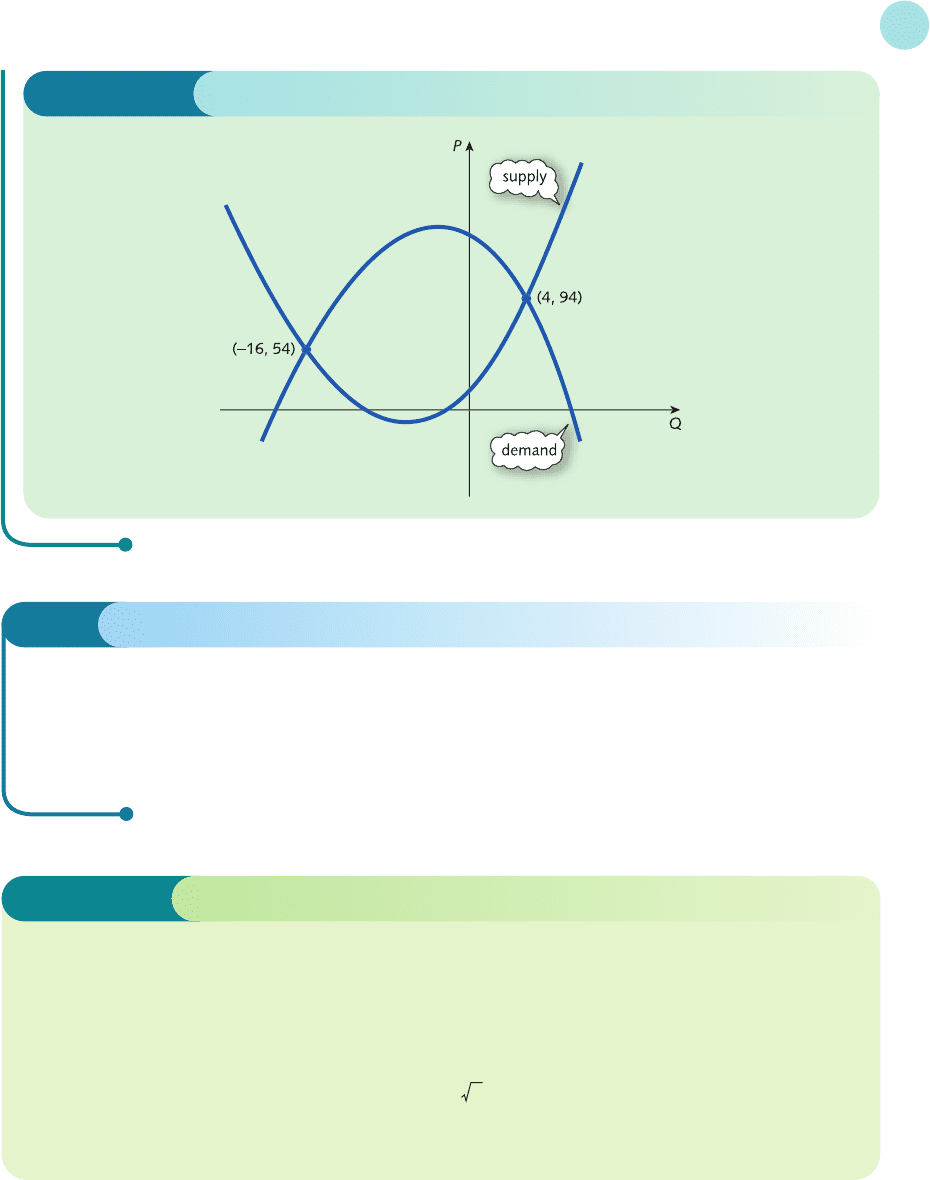
You might be puzzled by the fact that we actually obtain two possible solutions, one of which does not
make economic sense. The supply and demand curves are sketched in Figure 2.5. This shows that there are
indeed two points of intersection confirming the mathematical solution. However, in economics the quan-
tity and price are both positive, so the functions are only defined in the top right-hand (that is, positive)
quadrant. In this region there is just one point of intersection, at (4, 94).
−±12 20
2
−±12 400
2
()
−± − −12 12 4 1 64
21
2
(( ) ( )( ))
()
MFE_C02a.qxd 16/12/2005 10:59 Page 126
2.1 • Quadratic functions
127
Practice Problem
6 Given the supply and demand functions
P = 2Q
2
S
+ 10Q
S
+ 10
P =−Q
2
D
− 5Q
D
+ 52
calculate the equilibrium price and quantity.
Discriminant The number b
2
− 4ac which is used to indicate the number of solutions of
the quadratic equation ax
2
+ bx + c = 0.
Parabola The shape of the graph of a quadratic function.
Quadratic function A function of the form f (x) = ax
2
+ bx + c where a ≠ 0.
Square root A number that when multiplied by itself equals a given number; the solutions
of the equation x
2
= c which are written ± c.
U-shaped curve A term used by economists to describe a curve, such as a parabola, which
bends upwards, like the letter U.
Key Terms
Figure 2.5
MFE_C02a.qxd 16/12/2005 10:59 Page 127

Non-linear Equations
128
Practice Problems
7 Solve the following quadratic equations:
(a)
x
2
= 81 (b) x
2
= 36 (c) 2x
2
= 8
(d) (x − 1)
2
= 9 (e) (x + 5)
2
= 16 (f) (2x − 7)
2
= 121
8 Write down the solutions of the following equations:
(a)
(x − 1)(x + 3) = 0 (b) (2x − 1)(x + 10) = 0 (c) x(x + 5) = 0
(d) (3x + 5)(4x − 9) = 0 (e) (5 − 4x)(x − 5) = 0 (f) (x − 2)(x + 1)(4 − x) = 0
9 Use ‘the formula’ to solve the following quadratic equations. (Round your answers to 2 decimal
places.)
(a)
x
2
− 5x + 2 = 0 (b) 2x
2
+ 5x + 1 = 0 (c) −3x
2
+ 7x + 2 = 0
(d) x
2
= 3x + 1 (e) 2x
2
+ 8x + 8 = 0 (f) x
2
− 6x + 10 = 0
10 Solve the equation f(x) = 0 for each of the following quadratic functions:
(a)
f(x) = x
2
− 16 (b) f(x) = x(100 − x) (c) f(x) =−x
2
+ 22x − 85
(d) f(x) = x
2
− 18x + 81 (e) f(x) = 2x
2
+ 4x + 3
11 Sketch the graphs of the quadratic functions given in Practice Problem 10.
12 One solution of the quadratic equation
x
2
− 8x + c = 0
is known to be x = 2. By substituting this into the equation, find the value of c and hence obtain the
second solution.
13 Given the quadratic supply and demand functions
P = Q
2
S
+ 2Q
S
+ 12
P =−Q
2
D
− 4Q
D
+ 68
determine the equilibrium price and quantity.
14 Given the supply and demand functions
P = Q
2
S
+ 2Q
S
+ 7
P =−Q
D
+ 25
determine the equilibrium price and quantity.
MFE_C02a.qxd 16/12/2005 10:59 Page 128

section 2.2
Revenue, cost and profit
The main aim of this section is to investigate one particular function in economics, namely
profit. By making reasonable simplifying assumptions, the profit function is shown to be
quadratic and so the methods developed in Section 2.1 can be used to analyse its properties. We
describe how to find the levels of output required for a firm to break even and to maximize
profit. The profit function is denoted by the Greek letter π (pi, pronounced ‘pie’) and is defined
to be the difference between total revenue, TR, and total cost, TC: that is,
π=TR − TC
This definition is entirely sensible because TR is the amount of money received by the firm
from the sale of its goods and TC is the amount of money that the firm has to spend to pro-
duce these goods. We begin by considering the total revenue and total cost functions in turn.
The total revenue received from the sale of Q goods at price P is given by
TR = PQ
For example, if the price of each good is $70 and the firm sells 300 then the revenue is
$70 × 300 = $21 000
Given any particular demand function, expressing P in terms of Q, it is a simple matter to
obtain a formula for TR solely in terms of Q. A graph of TR against Q can then be sketched.
Objectives
At the end of this section you should be able to:
Sketch the graphs of the total revenue, total cost, average cost and profit
functions.
Find the level of output that maximizes total revenue.
Find the level of output that maximizes profit.
Find the break-even levels of output.
MFE_C02b.qxd 16/12/2005 10:59 Page 129