Houze Robert A., Jr. Cloud Dynamics
Подождите немного. Документ загружается.

11.4 Clouds and Precipitation in a Frontal Cyclone 489
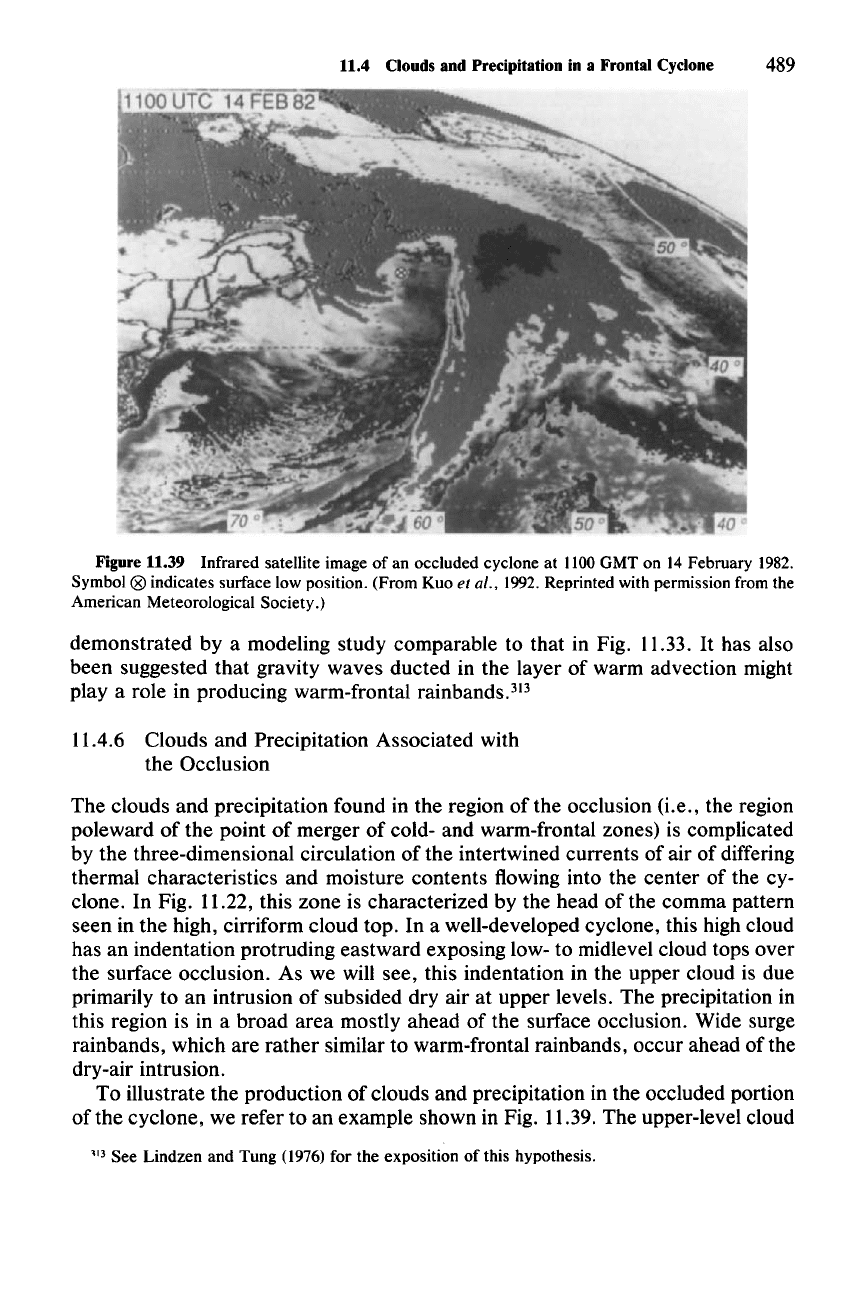
Figure 11.39 Infrared satellite image of an occluded cyclone at 1100GMT on 14 February 1982.
Symbol
® indicates surface low position. (From Kuo et al., 1992. Reprinted with permission from the
American Meteorological Society.)
demonstrated by a modeling study comparable to that in Fig. 11.33.
It
has also
been suggested that gravity waves ducted in the layer of warm advection might
playa
role in producing warm-frontal rainbands."!
11.4.6 Clouds and Precipitation Associated with
the Occlusion
The clouds and precipitation found in the region of the occlusion (i.e., the region
poleward of the point of merger of cold- and warm-frontal zones) is complicated
by the three-dimensional circulation of the intertwined currents of air of differing
thermal characteristics and moisture contents flowing into the center of the cy-
clone. In Fig. 11.22, this zone is characterized by the head of the comma pattern
seen in the high, cirriform cloud top. In a well-developed cyclone, this high cloud
has an indentation protruding eastward exposing low- to midlevel cloud tops over
the surface occlusion. As we will see, this indentation in the upper cloud is due
primarily to an intrusion of subsided dry air at upper levels. The precipitation in
this region is in a broad area mostly ahead of the surface occlusion. Wide surge
rainbands, which are rather similar to warm-frontal rainbands, occur ahead of the
dry-air intrusion.
To illustrate the production of clouds and precipitation in the occluded portion
of the cyclone, we refer to an example shown in Fig. 11.39. The upper-level cloud
"3
See Lindzen and Tung (1976) for the exposition of this hypothesis.
490 11 Precipitating Clouds in Extratropical Cyclones
Figure 11.40
200
""",,,====="""'=======~~c::--1
Figure 11.41
400
:0
.s
ILl
600
0:
::>
Cf)
Cf)
ILl
0:
a.
800
250
500
DISTANCE
(km)
750
956
D
11.4 Clouds and Precipitation in a Frontal Cyclone
491
shield exhibits the characteristic indentation, revealing lower cloud tops over the
surface occlusion. This case has been simulated accurately with a mesoscale
numerical model in a manner similar to the two storms illustrated in Figs. 11.18
and 11.19. Like the case in Fig. 11.18, the storm illustrated here occurred over the
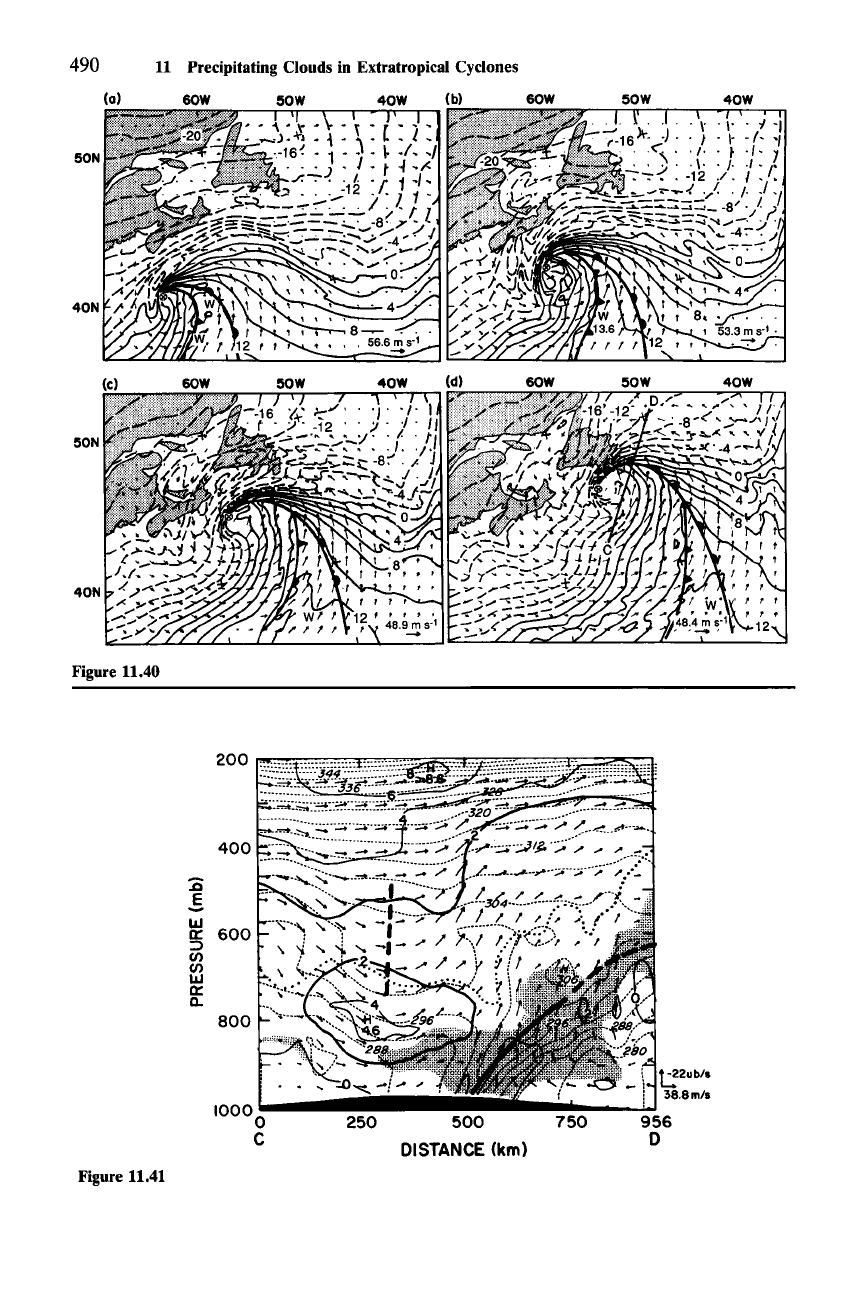
Atlantic Ocean. The evolution of the low-level temperature pattern in Fig. 11.40is
similar to that in Fig. 11.18, except that by the time of the occluded stage (Fig.
11.40d) there is not an intensified zone of strong gradient of temperature just to the
rear of the cold front to the southeast of the surface low center. The occlusion
itself is, however, rather similar to the previous case.
A vertical cross section along line CD in Fig. 11.40d is shown in Fig. 11.41. The
position of the occluded front (i.e., the warm ridge connecting the warm sector
with the surface low center, as seen in Fig. 11.40d) is shown by a heavy solid line.
It has the slope and general appearance of a warm-frontal zone and in fact trans-
forms to a warm front at higher levels (heavy dashed extension of the heavy solid
line). It is not intersected by a cold front aloft.
314 A cold front in the vicinity of the
trough aloft is indicated by a heavy dashed line 250 km upwind of the occlusion;
however, it is unconnected to the occlusion. The dominance of the warm-frontal
structure in the region of the occlusion is consistent with the horizontal tempera-
ture pattern in Fig. 11.40, where the strong temperature gradient is on the warm
side of the occlusion. The cross section cuts through the indentation in the upper
cloud pattern seen in Fig. 11.39 and confirms that the clouds are confined to low
levels. They are found in the general region of upward motion east of the trough of
the upper-level baroclinic wave. They are concentrated roughly in a sloping up-
ward zone straddling the occluded front. The air above the cloud layer has been
advected from the west side of the upper-level trough after having subsided from
high levels. Its potential vorticity, which is conserved (Sec. 2.5), indicates it is of
stratospheric origin (the regions of potential vorticity units
>2
in Fig.
11.41
are
considered to have originated in the stratosphere). Although this air is rising on
the east side of the trough, it is so dry that it cannot reach saturation and form
cloud. Hence the clouds in this region are confined to low and middle levels.
314 See Sec. 3 of Kuo et al. (1992)for a discussion of the criteria used in locating occlusions, warm
fronts, and cold fronts in this analysis.
Figure 11.40 Mesoscale primitive-equation model calculation of the development of the
extratropical cyclone shown in Fig. 11.39.Predicted 900-mb temperature
(OC)
and wind field valid at (a)
0000 GMT, (b) 0430 GMT, (c) 0900 GMT, (d) 1330 GMT on 14 February 1982. Line CD shows the
location of the cross section in Fig.
11041.
(From Kuo et al., 1992.Reprinted with permission from the
American Meteorological Society.)
Figure 11.41 Vertical cross section along line CD in Fig. 11.40d. Equivalent potential temperature
(dashed isopleths, in K), potential vorticity (thin solid isopleths in "potential vorticity units" defined
as 1 x 10-
6
K
kg"!
m
S-I),
40% isohume (dotted line), and cloud area (stippling). Cloud boundary is
defined by the 100% isohume. Air motion relative to the storm is indicated by arrows according to the
attached scale. The potential vorticity contour for two potential vorticity units is emphasized because
air with potential vorticity exceeding this value is probably of stratospheric origin. Heavy dashed line
represents an upper cold front. (From Kuo et al., 1992.Reprinted with permission from the American
Meteorological Society.)
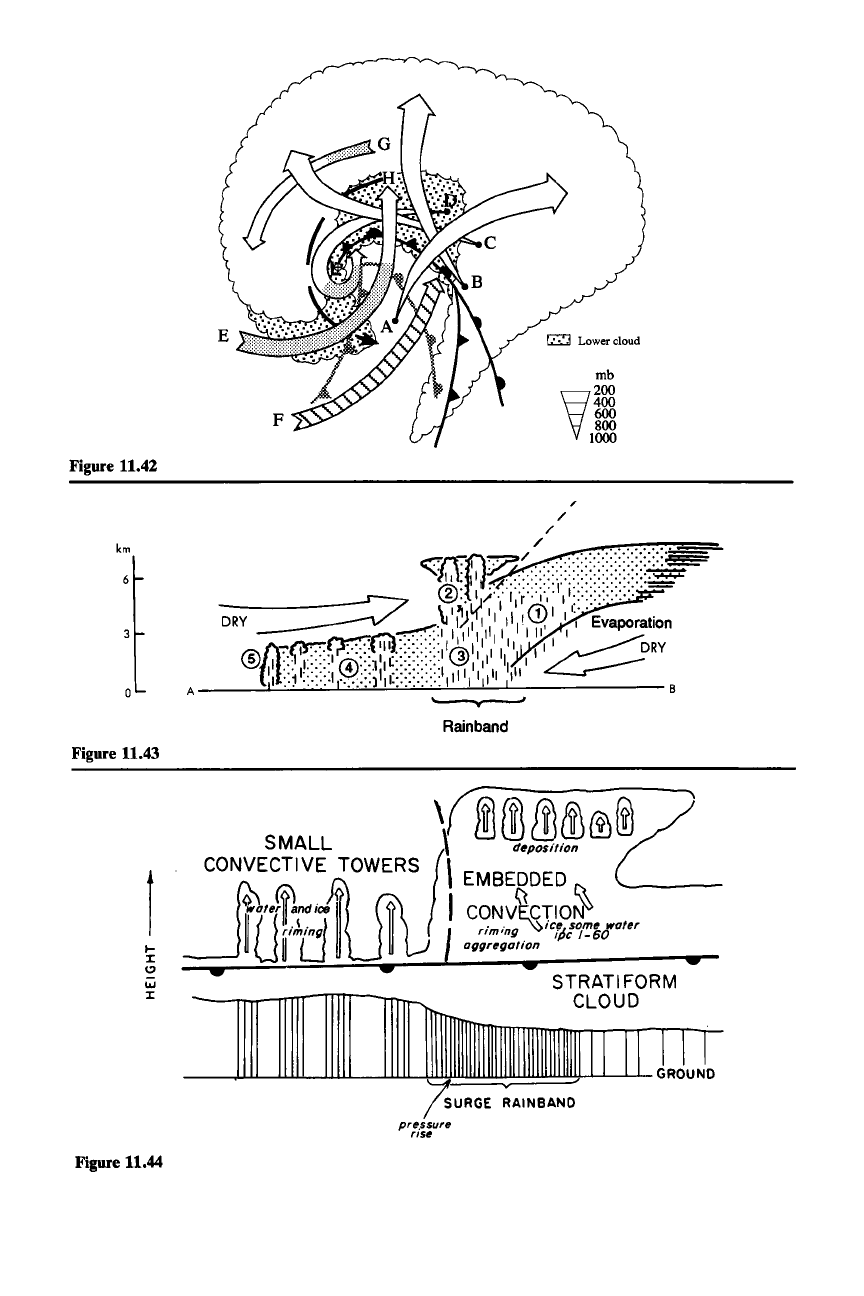
Figure 11.42
km
Figure 11.43
A
[;:Z;l Lower cloud
mb
W
200
Wl
gOO
!OOO
"
Rainband
Figure 11.44
•
STRATIFORM •
CLOUD
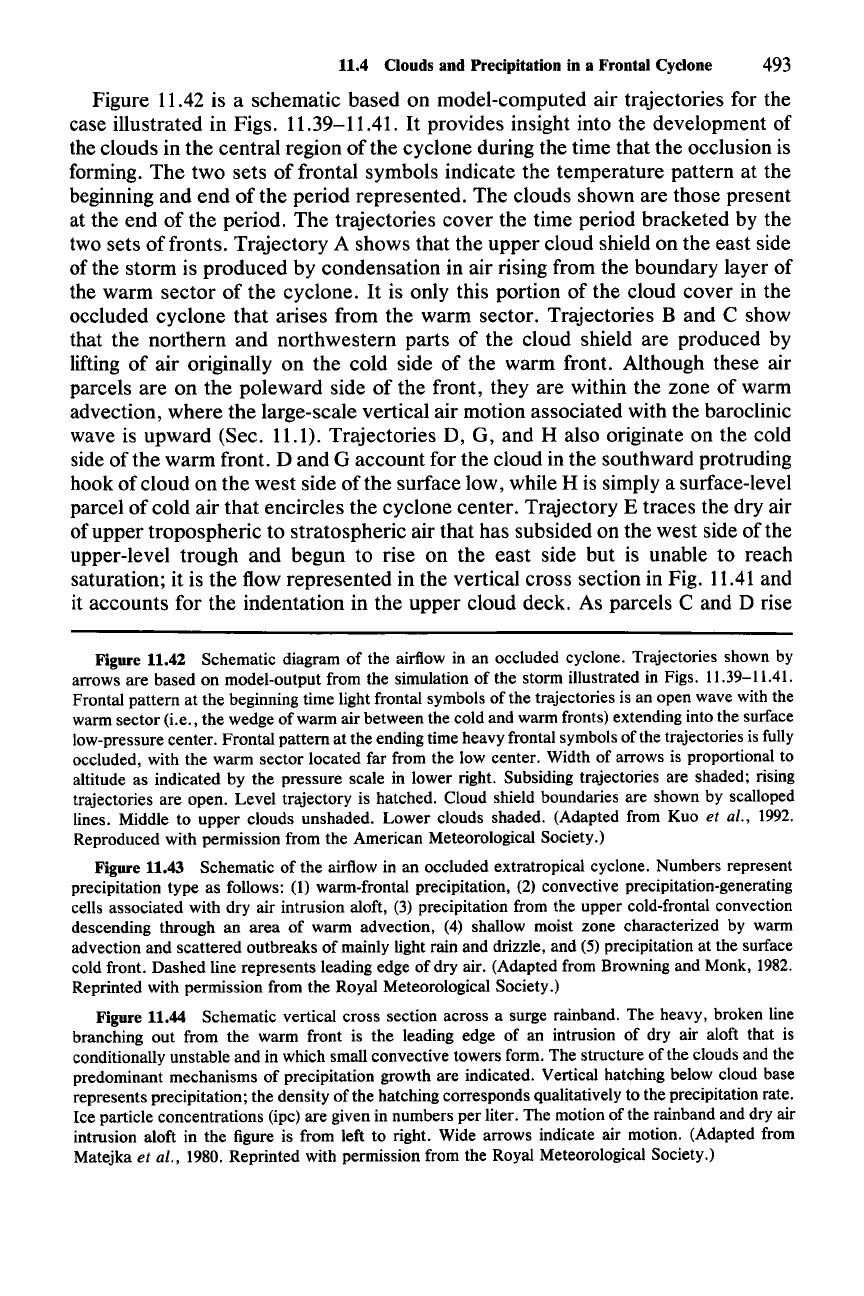
11.4 Clouds and Precipitation in a Frontal Cyclone 493
Figure 11.42 is a schematic
based
on model-computed air trajectories for the
case illustrated in Figs. 11.39-11.41.
It
provides insight into the development of
the clouds in
the
central region
of
the cyclone during the time that the occlusion is
forming.
The
two sets of frontal symbols indicate the temperature pattern at the
beginning
and
end
of the period represented. The clouds shown are those present
at the end of the period.
The
trajectories
cover
the time period bracketed by the
two sets
of
fronts. Trajectory A shows
that
the upper cloud shield on the east side
of the storm is produced by condensation in air rising from the boundary layer of
the warm sector of
the
cyclone.
It
is only this portion of the cloud cover in the
occluded cyclone
that
arises from
the
warm sector. Trajectories
Band
C show
that the northern
and
northwestern parts of the cloud shield are produced by
lifting of air originally on
the
cold side of the warm front. Although these air
parcels are on the poleward side
of
the front, they are within the zone of warm
advection, where
the
large-scale vertical air motion associated with the baroclinic
wave is upward (Sec. 11.1). Trajectories D, G, and H also originate on the cold
side of
the
warm
front. D
and
G account for the cloud in the southward protruding
hook
of
cloud on the
west
side of the surface low, while H is simply a surface-level
parcel of cold air
that
encircles the cyclone center. Trajectory E traces the dry air
of upper tropospheric to stratospheric air that has subsided on the west side of the
upper-level trough
and
begun to rise on the east side but is unable to reach
saturation; it is
the
flow represented in the vertical cross section in Fig. 11.41 and
it accounts for the indentation in the upper cloud deck. As parcels C and D rise
Figure 11.42 Schematic diagram of the airflow in an occluded cyclone. Trajectories shown by
arrows are based on model-output from the simulation of the storm illustrated in Figs. I
I. 39-1 1.4I.
Frontal pattern at the beginning time light frontal symbols of the trajectories is an open wave with the
warm sector (i.e., the wedge of warm air between the cold and warm fronts) extending into the surface
low-pressure center. Frontal pattern at the ending time heavy frontal symbols of the trajectories is fully
occluded, with the warm sector located far from the low center. Width of arrows is proportional to
altitude as indicated by the pressure scale in lower right. Subsiding trajectories are shaded; rising
trajectories are open. Level trajectory is hatched. Cloud shield boundaries are shown by scalloped
lines. Middle to upper clouds unshaded. Lower clouds shaded. (Adapted from Kuo
et al., 1992.
Reproduced with permission from the American Meteorological Society.)
Figure 11.43 Schematic of the airflow in an occluded extratropical cyclone. Numbers represent
precipitation type as follows:
(1) warm-frontal precipitation, (2) convective precipitation-generating
cells associated with dry air intrusion aloft, (3) precipitation from the upper cold-frontal convection
descending through an area of warm advection, (4) shallow moist zone characterized by warm
advection and scattered outbreaks of mainly light rain and drizzle, and (5) precipitation at the surface
cold front. Dashed line represents leading edge of dry air. (Adapted from Browning and Monk,
1982.
Reprinted with permission from the Royal Meteorological Society.)
Figure 11.44 Schematic vertical cross section across a surge rainband. The heavy, broken line
branching out from the warm front is the leading edge of an intrusion of dry air aloft that is
conditionally unstable and in which small convective towers form. The structure of the clouds and the
predominant mechanisms of precipitation growth are indicated. Vertical hatching below cloud base
represents precipitation; the density of the hatching corresponds qualitatively to the precipitation rate.
Ice particle concentrations (ipc) are given in numbers per liter. The motion of the rainband and dry air
intrusion aloft in the figure is from left to right. Wide arrows indicate air motion. (Adapted from
Matejka
et al., 1980. Reprinted with permission from the Royal Meteorological Society.)
4
~
--l
W
>
W
3 --l
<[
W
(f)
W
>
o
m
«
w
o
::J
II--
~
«
cleor
'-------v----~Il'---
r-r-r-r-r-«
600
:0
E
700
w
(a)
gs
(f)
(f)
W
0::
0...
494 11 Precipitating Clouds in Extratropical Cyclones
500,-------------,
FIELD OF
SHOWERS
SURGE
RAINBAND
BEHIND
SURGE
RAINBAND
HORIZONTAL DISTANCE PERPENDICULAR TO SURGE RAINBAND
Q-"i020km
5001--------------;========;~
ctear
E
600
4
~
....J
W
~
>
.Q
W
.§
3
....J
700
w
«
(b)
0::
w
::J
(f)
(f)
W
(f)
W
>
0::
0
0...
tn
«
w
0
::J
I--
~
«
r-
showery rain
~
co'!finuous,
voriob/e~-----'--
spotty rain
up
fa 4 mm h-I I ram 0.5 fa weo« -
~
/6 mm h-I pressure rtse
JOOO6----;,..-------....-------~~-------GROUND
v JLI
----vv--~
FIELD OF SHOWERS
SURGE
RAINBAND
BEHIND SURGE RAINBAND
HORIZONTAL
DISTANCE PERPENDICULAR TO SURGE RAINBAND
~Okm
Figure 11.45
11.4 Clouds and Precipitation in a Frontal Cyclone 495
from the boundary layer to upper levels, they pass under trajectory E in the center
of the region of low- to middle-level cloud
just
ahead of the surface occlusion. The
lower cloud deck is evidently produced by condensation in parcels C and D on
their way westward and upward. Since they are not initially so dry, condensation
can occur at low levels and produce the lower-level frontal cloud, which is ex-
posed in satellite view by the clear indentation left by the higher-level trajectory
E. Trajectory F, south
of
E, also is characterized by dry air from the upper
troposphere or stratosphere.
It
differs from E only in that it follows a nearly
constant-level path during the time period shown.
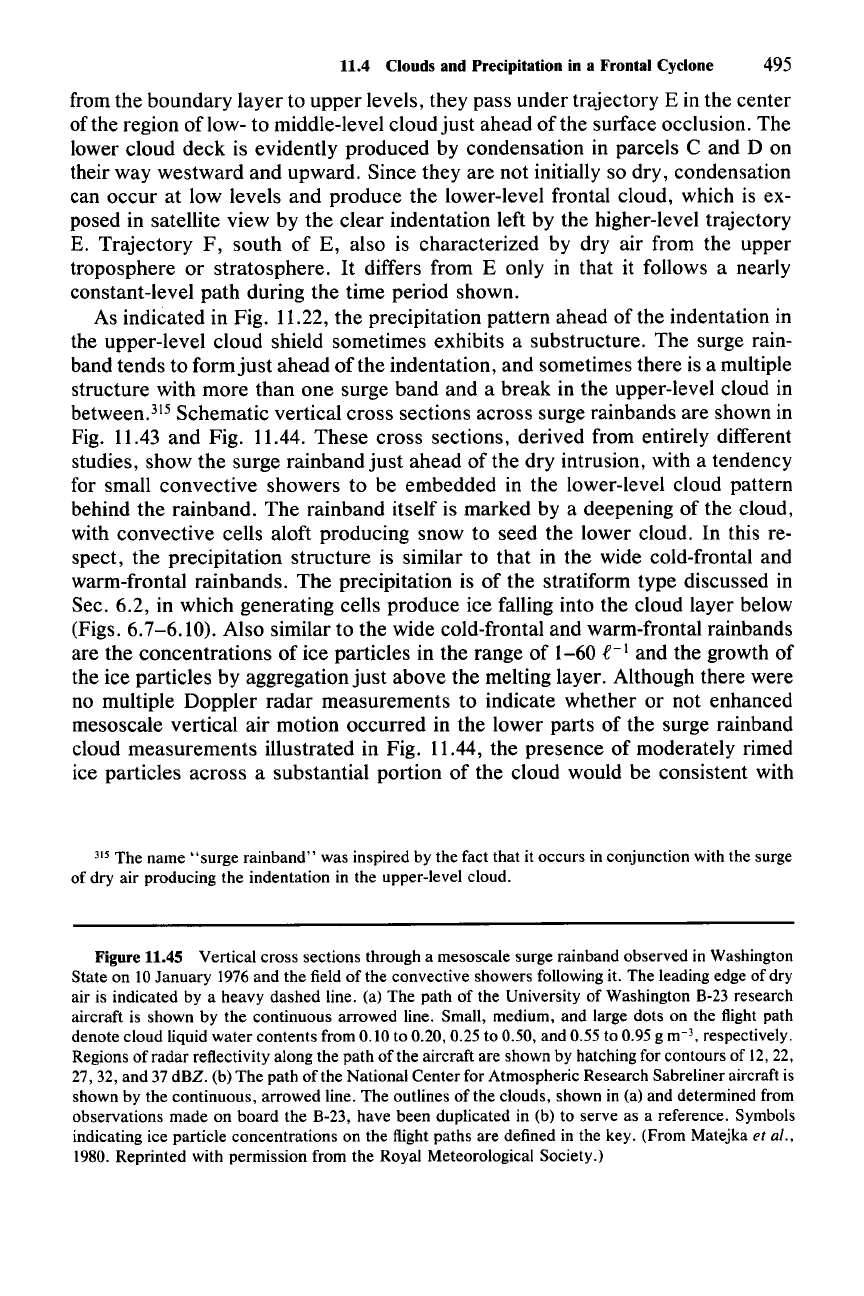
As indicated in Fig. 11.22, the precipitation pattern ahead of the indentation in
the upper-level cloud shield sometimes exhibits a substructure. The surge rain-
band tends to form
just
ahead
of
the indentation, and sometimes there is a multiple
structure with more than one surge band and a break in the upper-level cloud in
between.t" Schematic vertical cross sections across surge rainbands are shown in
Fig. 11.43 and Fig. 11.44. These cross sections, derived from entirely different
studies, show the surge rainband
just
ahead of the dry intrusion, with a tendency
for small convective showers to be embedded in the lower-level cloud pattern
behind the rainband. The rainband itself is marked by a deepening of the cloud,
with convective cells aloft producing snow to seed the lower cloud. In this re-
spect, the precipitation structure is similar to that in the wide cold-frontal and
warm-frontal rainbands. The precipitation is of the stratiform type discussed in
Sec. 6.2, in which generating cells produce ice falling into the cloud layer below
(Figs. 6.7-6.10). Also similar to the wide cold-frontal and warm-frontal rainbands
are the concentrations of ice particles in the range of 1-60
e-
1
and the growth of
the ice particles by aggregation
just
above the melting layer. Although there were
no multiple Doppler radar measurements to indicate whether or not enhanced
mesoscale vertical air motion occurred in the lower parts of the surge rainband
cloud measurements illustrated in Fig. 11.44, the presence of moderately rimed
ice particles across a substantial portion of the cloud would be consistent with
315 The name
"surge
rainband" was inspired by the fact that it occurs in conjunction with the surge
of dry air producing the indentation in the upper-level cloud.
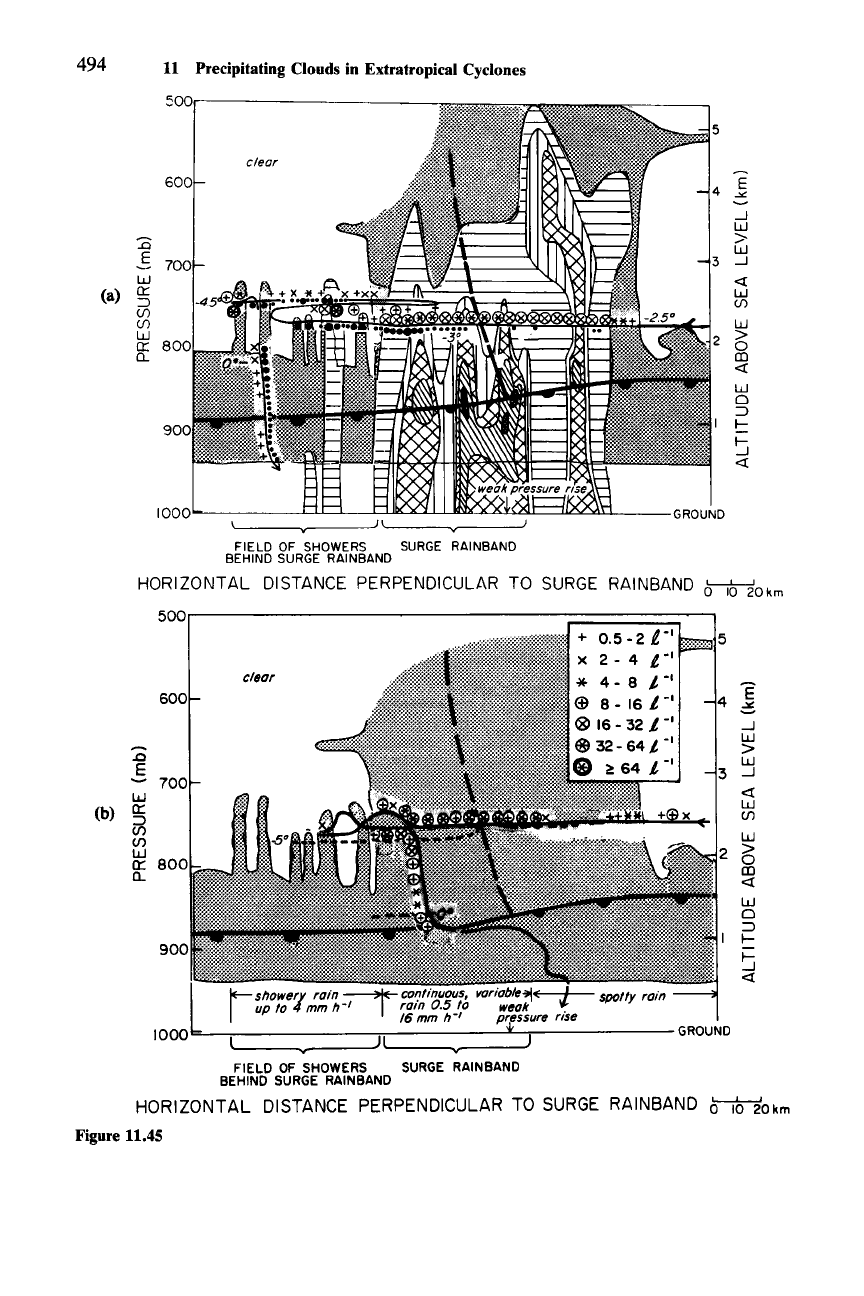
Figure 11.45 Vertical cross sections through a mesoscale surge rainband observed in Washington
State on 10 January 1976 and the field of the convective showers following it. The leading edge of dry
air is indicated by a heavy dashed line. (a) The path of the University of Washington B-23 research
aircraft is shown by the continuous arrowed line. Small, medium, and large dots on the flight path
denote cloud liquid water contents from 0.10 to 0.20,0.25 to 0.50, and 0.55 to 0.95 g m-
3
,
respectively.
Regions of radar reflectivity along the path of the aircraft are shown by hatching for contours of 12, 22,
27,32, and 37 dBZ. (b) The path of the National Center for Atmospheric Research Sabreliner aircraft is
shown by the continuous, arrowed line. The outlines of the clouds, shown in (a) and determined from
observations made on board the B-23, have been duplicated in (b) to serve as a reference. Symbols
indicating ice particle concentrations on the flight paths are defined in the key. (From Matejka
et al.•
1980. Reprinted with permission from the Royal Meteorological Society.)
496 11 Precipitating Clouds in Extratropieal Cyclones
such enhanced upward motion. If it were present, the similarity to the warm-
frontal and wide cold-frontal rainbands would be even more evident.
The schematic model in Fig. 11.44 was based on three
cases.!" An example of
the type of
data
from which it was obtained is in Fig. 11.45. In this case, a surge
rainband occurred
just
ahead
of
the clear, dry intrusion at middle to upper levels.
It
was observed nearly simultaneously by two research aircraft, a single Doppler
radar, and serial rawinsondes. Figure 11.45 is a composite
of
those
data."?
The
reflectivity field from the radar shows a cellular structure, which appears to have
been produced by the fallstreaks from convective cells aloft, since reports from
the aircraft did not indicate particularly strong vertical motions at their flight
levels. The temperature, liquid water content, and ice particle concentration along
the flight paths are shown. Ice particles were present in concentrations of
7-60
£-1, and liquid water contents of 0.1-0.5 g m? were observed continuously across
about the rear two-thirds
of
the band. The leading portion was glaciated. The ice
particles included needles, assemblages of needles, and aggregates as large as 3 to
4 mm in diameter. The cell ahead of the band was a transient feature that was not
included in the band because it did not exhibit mesoscale continuity. At the
position of the dashed line, the radar measured a wind shift and the aircraft
encountered a temperature drop of
-OSC.
The latter was likely the result of
evaporation as the intruding dry air evaporated cloud and precipitating particles.
A slight pressure rise occurred as the band passed over surface stations.
11.5 Clouds
in Polar Lows
11.5.1 Comma-Cloud Systems
In Sec. 1.3.3, two examples of polar lows were shown. The first was a
"comma
cloud," which forms in connection with a short-wavelength baroclinic wave lo-
cated a short distance to the rear of a major frontal system (Fig.
1.29).318
Several
important processes are involved in the development of a comma-cloud distur-
bance. As noted in Sec. 11.1, the region
of
upward air motion in a baroclinic wave,
in accordance with the distribution of the geostrophic Q-vector (Fig. 11.3), is
typically found in a comma-shaped region to the west of the trough. Cloud forma-
tion is favored in this region of ascent. The clouds in the short wave are found
primarily in the envelope of this vertical-motion region. However, comma-cloud
systems form mainly over oceans during the winter half of the year, and additional
factors influence the cloud development. The potential instability of the air is high
316 See Matejka et al. (1980) for details.
317 In earlier studies, Kreitzberg (1963) and Kreitzberg and Brown (1970) inferred the existence of
surge-type rainbands and deduced some qualitative aspects of their structure from experiments em-
ploying special rawinsonde data. The more recent studies generally confirm their findings and add
detail on the microphysical and precipitation structure.
318 Although the major frontal cloud system also exhibits a much larger comma shape in satellite
pictures, the name
"comma
cloud" is commonly used to refer to the smaller comma associated with
the short wave trailing the larger frontal cloud system.
o Deep Cumulus
~
Shallow Cumulus
(-f) Vorticity Maximum
~
Cold Advection
~w
Warm Advection
.....
Jet Stream Axis
(a)
(b)
(c)
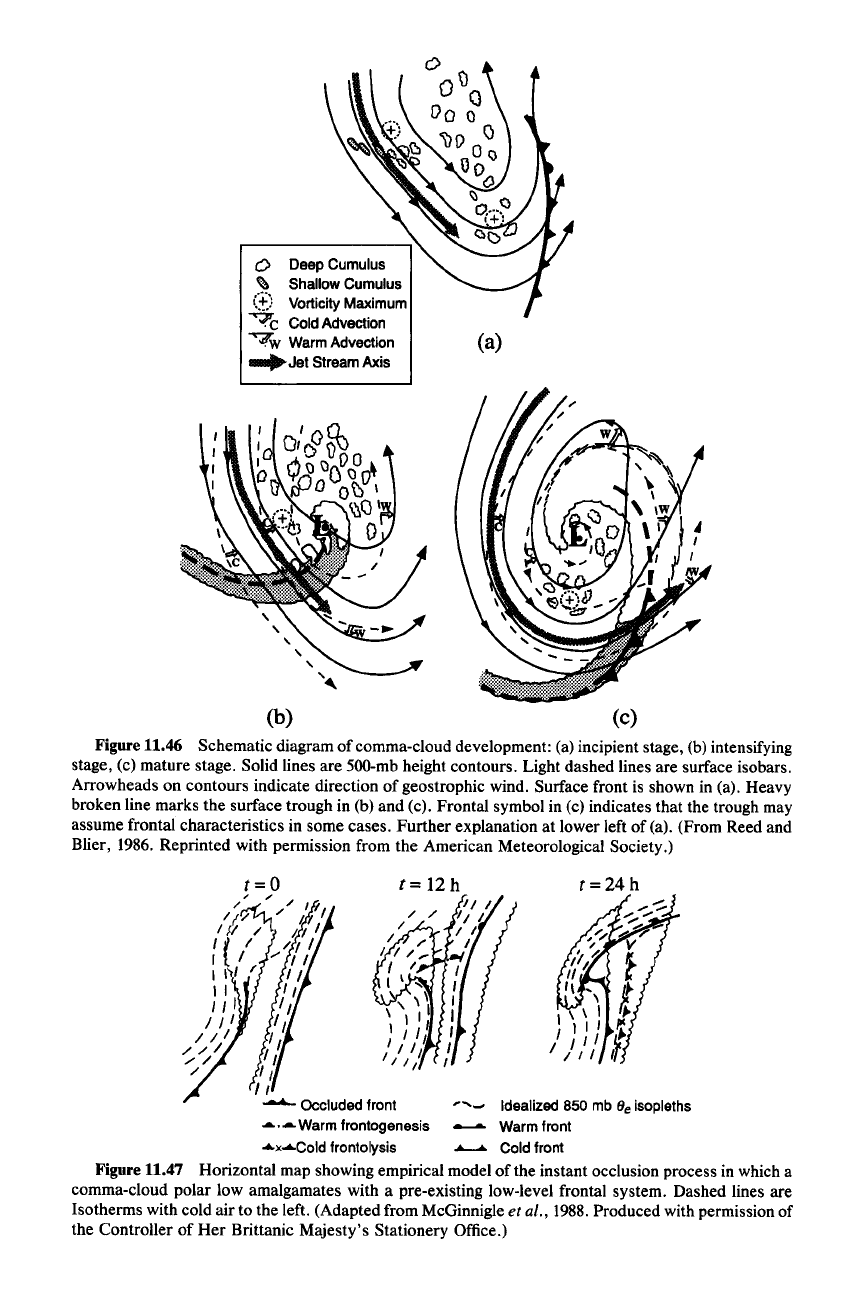
Figure 11.46 Schematic diagram of comma-cloud development: (a) incipient stage, (b) intensifying
stage, (c) mature stage. Solid lines are 500-mb height contours. Light dashed lines are surface isobars.
Arrowheads on contours indicate direction of geostrophic wind. Surface front is shown in (a). Heavy
broken line marks the surface trough in (b) and (c). Frontal symbol in (c) indicates that the trough may
assume frontal characteristics in some cases. Further explanation at lower left of (a). (From Reed and
Blier, 1986. Reprinted with permission from the American Meteorological Society.)
t=O
t=24h
, "
/~
/ I
11.'/
"at
/fl/
at
t t I
/~
/
It'
"1/
I I'll 1 , ,
II
"
/ I I "
/
I'
/,
/
1//
"
~~
I,
/
'I
II
-......
Occluded front
......
- Idealized 850 mb (Je isopleths
.a.
•
.a.
Warm frontogenesis
.-.......-
Warm front
....
x~Cold
frontolysis
-.....
Cold front
Figure 11.47 Horizontal map showing empirical model of the instant occlusion process in which a
comma-cloud polar low amalgamates with a pre-existing low-level frontal system. Dashed lines are
Isotherms with cold air to the left. (Adapted from McGinnigle et al., 1988.Produced with permission of
the Controller of
Her
Brittanic Majesty's Stationery Office.)
498 11 Precipitating Clouds in Extratropical Cyclones
and favors convective rather than stratiform clouds, at least during the initial
phases of cloud formation in the wave. The oceanic regions where the comma
clouds form are also characterized by appreciable surface fluxes of heat and
moisture. These fluxes influence the vertical motion field directly through the
diabatic heating term, which would have been included in the omega equation
(11.14)had we used the nonadiabatic version of the thermodynamic equation (2.9)
instead of (2.11) in the derivation of the equation.
The development of a comma-cloud system is depicted schematically in Fig.
11.46. The incipient comma cloud is associated with the western maximum of
vertical vorticity west of the main front shown in Fig. 11.46a. This vorticity
maximum is associated with a short-wavelength trough on the west side of the
larger-scale trough directly associated with the front. The cold air mass flowing
over the ocean behind the main frontal system to the east is potentially unstable,
and the clouds in the air mass tend to be convective as indicated in Fig. 11.22). A
large group of convective clouds is associated with the larger-scale trough. A
smaller group of convective clouds is indicated to have concentrated into a small
comma-shaped area corresponding to the region of ascent on the east side of the
small-scale trough. Since the air is potentially unstable, the ascent associated with
the wave encourages the formation of the convective clouds rather than the for-
mation of a continuous area of stable upward motion and stratiform cloud. Even-
tually, the cumulonimbus clouds grow larger such that their anvils expand. Some
may group together to form mesoscale convective systems (Chapter 9). By the
time of the intensifying stage of the comma-cloud system (Fig. I 1.46b), the ex-
panded anvils of individual or grouped cumulonimbus have begun to exhibit small
comma shapes, as they are distorted by the wind field, which is characterized by
strong positive vertical vorticity. Also, the effect of the developing baroclinic
wave has begun to be felt at the ocean surface, where a low-pressure system has
begun to form below the region of upward motion at upper levels. This cyclo-
genetic behavior is characteristic of a baroclinic wave, as we have seen in Sec.
11.1 (Fig. 11.3). After this time, the cloud system evolves into a mature stage (Fig.
11.46c), in which the upper-level cloud shield evolves into a more continuous
sheet of cirriform cloud. To some extent, this large comma-shaped cloud shield is
the merger of the earlier cumulonimbus and mesoscale convective systems. How-
ever, the baroclinic wave and its frontogenetic wind field undoubtedly promote
cloud organization in response to the vertical circulations associated with the
wave and its associated frontogenesis (Sec. 11.2). The symbology used in Fig.
11.46c indicates that in its mature phase the comma-cloud system sometimes
exhibits frontal characteristics.
The short wave with which the comma cloud is associated tends to overtake the
larger frontal cloud system typically located to its east. When this happens, there
is a dynamical interaction. We saw in Sec. 11.1 that when an upper-level baro-
clinic wave moves over a pre-existing front, surface cyclogenesis is favored (Fig.
11.5). Thus, when the wave with which the comma-cloud system is associated
catches up with the front to the east, that frontal system begins to be disturbed, as
in the stage of frontal low development (Fig.
ll.4a
and Fig. 11.5b). At the same
time, however, the cyclogenesis and frontogenesis associated with the comma-
