Heard D.E. (editor) Analytical Techniques for Atmospheric Measurement
Подождите немного. Документ загружается.


122 Analytical Techniques for Atmospheric Measurement
Hovde et al. (1993) describe two different FMS systems for airborne measurements of
H
2
O-vapor and a system for CH
4
measurements. Wienhold et al. (1993) describe a
two-channel TTFMS system for the fast (1 Hz rates) detection of CO and other species.
This instrument, which employed mid-IR lead-salt diode lasers and was operated in both
airborne and ground-based studies, achieved A
min
values of ∼10
−5
for 1-second averaging
times. Wienhold et al. (1998) further describe this instrument and its deployment on
three airborne campaigns for measurements of CO, N
2
O, and CH
4
. Werle and Kormann
(2001) exploited the fast response times achievable with FMS techniques to carry out
eddy-correlation flux measurements of CH
4
at 10 Hz from rice paddy fields.
2.5.1.3.5 CONTINUOUS-WAVE CAVITY ABSORPTION
SPECTROSCOPY
Cavity Absorption Spectroscopy (CAS) takes advantage of long path absorption
spectroscopy by coupling tunable laser radiation to a high-finesse cavity. Regardless of
the specific type of coupling of the radiation to the cavity, long, effective path lengths
of several thousand meters can be achieved. Numerous variants of cw-CAS have been
developed and derived from the pulsed cavity ring-down spectroscopy (CRDS) technique,
first demonstrated in 1988 by O’Keefe and Deacon (1988). In CRDS, a laser pulse is
coupled into a high-finesse cavity formed by two highly reflective R > 999% spherical
mirrors and the radiation that leaves the cavity through one mirror is observed as it
exponentially ‘rings’ down the optical cavity. The exponential decay rate is determined
by the mirror losses (scatter, absorption, transmission) and absorption by the sample
gas present in the cavity while traversing between the two mirrors. Comparing the cell
decay rate when the cell is empty and when an absorber is present, directly relates to the
mixing ratio of the absorber. We will only further discuss cavity absorption measurements
based upon cw-laser sources in this chapter, since such measurements yield much higher
sensitivity than pulsed sources in the IR.
Two principal forms of cw-CAS have been derived from the original pulsed CRDS study:
namely, cw-CRDS and Cavity Enhanced Absorption Spectroscopy (CEAS) or Integrated
Cavity Output Spectroscopy (ICOS). While in cw-CRDS one observes individual ring-
down events, in CEAS and ICOS one observes time integrated ring-down events similar
to traditional absorption spectroscopy.
Continuous wave CRDS features a high spectroscopic sensitivity. However, this
approach requires active laser-to-cavity locking with fast electronics. Good laser beam
quality is also important in this approach, as the excitation of higher order modes leads
to multi-order exponential ring-down functions (Hodges et al., 2004). Overall, cw-CRDS
has demonstrated sensitivities in excess of 10
−10
cm
−1
, but at the cost of a complex and
alignment sensitive setup that is difficult to implement for non-laboratory applications.
The CEAS and ICOS techniques and its advanced variant, off-axis ICOS (OA-ICOS,
Paul et al., 2001), have tremendously simplified CAS, as the cavity is passively operated
without the need of locking. The variant OA-ICOS uses essentially the same optical
mirror arrangement as an astigmatic multipass Herriott cell without a coupling hole, and
couples the laser beam to the cavity at a small angle with the added advantage of avoiding
direct back reflections to the laser source. By following a Lissajous figure pattern across
the mirror cross-section, the free spectral range is significantly decreased and forms a
very dense cavity mode spectrum, making the cavity transmission almost independent

Infrared Absorption Spectroscopy 123
of wavelength. This approach also no longer requires dithering the laser wavelength or
the cavity by a piezoelectric transducer, as required by CEAS and ICOS, respectively, to
effectively couple the laser into a large number of transverse cavity modes.
Both OA-ICOS and CEAS have been most successfully applied in the near-IR spectral
region, where Baer et al. (2002) report A
min
values of 3 ×10
−11
cm
−1
Hz
−1/2
. Such high
performance, which is approximately one order of magnitude better than our field
second harmonic measurements in the mid-IR, needs to be further verified by repetitive
measurements. In the near-IR spectral region, these approaches take advantage of the
convenience of commercially available high power (10–50 mW) tunable telecom diode
lasers, low noise detectors D
∗
∼10
12
cm Hz
1/2
W
−1
, and high quality reflective mirror
coatings > 9999%. Translation of this performance to the mid-IR spectral region is
limited by: (1) higher noise detectors D
∗
∼10
11
cm Hz
1/2
W
−1
; (2) adequate tunable
laser sources of sufficient output power (tens of mW) and high beam quality; and
(3) similar-performing highly reflective coated mirrors. However, if one could ultimately
circumvent these issues and translate this spectroscopic performance to the mid-IR
spectral region, one could achieve extremely low mixing ratio detection limits for a
whole series of atmospherically important gases. As discussed previously, the fundamental
vibrational-rotational transitions are several orders of magnitude stronger in the mid-
IR than the near-IR. For example, spectral line intensities for CO
2
in the mid-IR at
43 m are ∼20 000 times stronger than near-IR transitions at 16 m where OA-ICOS
has successfully been employed. In such instances, medium pathlength-normalized A
min
values of 10
−8
cm
−1
A
min
= 10
−4
l= 100m in the mid-IR would require an equivalent
A
min
of 5 ×10
−13
cm
−1
to achieve the same sensitivity in terms of number density in the
near-IR. Despite this disadvantage, near-IR OA-ICOS achieves respectable mixing ratio
detection limits for the more abundant atmospheric gases (Baer et al., 2002).
2.5.1.3.6 BACKGROUND STRUCTURE AND
MEASUREMENT PERFORMANCE
Most, if not all, IR spectrometers employing solid-state laser sources are ultimately limited
by the stability of the background structure on which the absorption resides. This is the
case for direct absorption, WMS and FMS approaches just presented. An example of
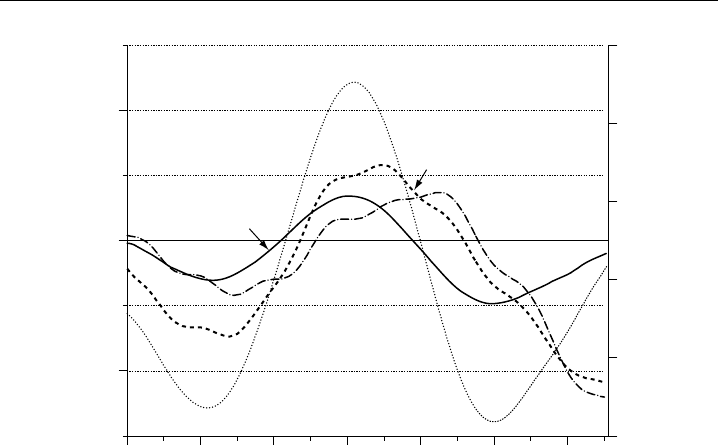
such background structure is displayed in Figure 2.16 along with ambient, calibration,
and fit absorption profiles for CH
2
O. The background structure, which is due to optical
noise, plays a significant role in the determination of the ultimate mixing ratio one
deduces. This is particularly true here where the ambient CH
2
O mixing ratios are near the
detection limit. In this case, our airborne CH
2
O results would be in error by ∼100pptv
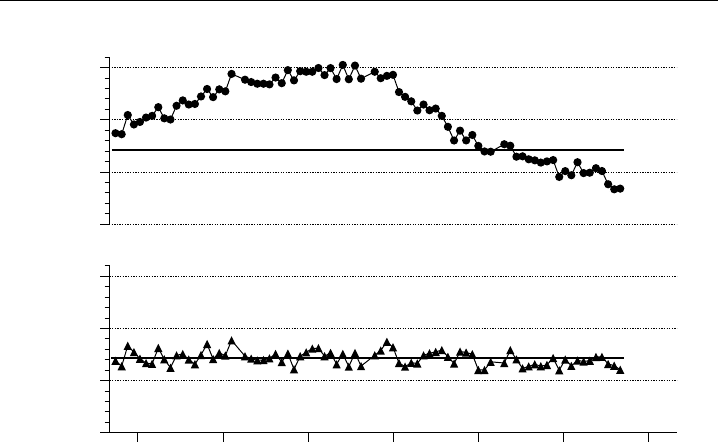
if the background spectrum is not first removed. Figure 2.17 shows this even more
dramatically in the case of our laboratory CH
2
O measurements where an input-mixing
ratio of 3.714 ppbv was sampled. Backgrounds were acquired for 10 seconds before and
after each 20 second sample, and including the sample, background, and intervening
flushing periods, each data point represents a 1 minute acquisition. In the upper panel
the backgrounds were ignored, while the average of the two backgrounds was subtracted
before fitting in the lower panel. In both cases, the sample data were fit to a CH
2
O
standard acquired previously using a real-time multiple linear regression approach (Sewell
et al., 1993). The retrieved CH
2
O mixing ratio averaged 4036 ±0305 ppbv in the case
of the upper panel and 3714 ±0055 ppbv using background subtraction in the lower
124 Analytical Techniques for Atmospheric Measurement
–0.020
0.000
0.020
Second harmonic signal (V)
160140120100806040
Channel number
0.6
0.4
0.2
0.0
–0.2
–0.4
Second harmonic signal for calibration (V)
14.57 ppbv calibration (right axis)
Raw sample (347
pptv)
Background
Fit of (Sample-Bkg)
248
± 5 pptv
Figure 2.16 Second harmonic profiles of ambient CH
2
O, calibration, background and fit spectra
acquired while in flight (4 km altitude) during a recent airborne campaign (Wert et al., 2003b). The raw
ambient and background spectra were acquired for 10 seconds, and these spectra along with the fit of
ambient-background use the left axis. The ambient-background was fit employing the 14.57 ppbv CH
2
O
spectrum (right axis).
panel. Not only does the background structure yield erroneously high CH
2
O results, but
also it degrades the measurement precision by a factor of 5.5 in this case.
Fried et al. (1997, 1998a), Zahniser et al. (1995), and Werle et al. (1993) among
others have presented the merits of such rapid background subtraction for WMS, direct
absorption, and FMS, respectively. If carried out correctly, rapid background subtraction
effectively captures and removes optical noise. As addressed by Werle et al. (1993),
acquisition of sample and background spectra as well as the associated cell/inlet flushing
times needs to be accomplished within a characteristic stability period, t
opt
, in order
for background subtraction to be effective. Werle et al. (1993) popularized the use of
Allan Variance Plots, first introduced by Allan in 1966 for characterization of frequency
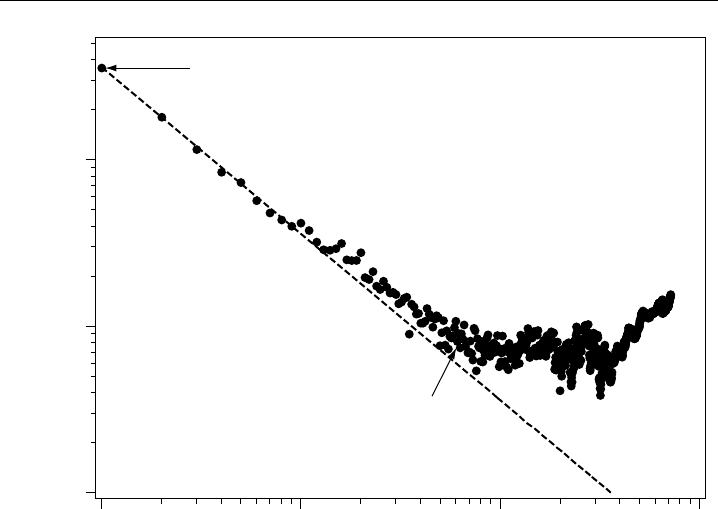
standards, for assessment of the stability of diode laser optical systems. As shown in
Figure 2.18, an Allan Plot is constructed by repetitively sampling a constant input-mixing
ratio in very small time increments (0.5 seconds in this case). The resulting average
measurement variance between adjacent groups of data is displayed on a log–log plot
as the number of elements in each group is successively increased (i.e. increasing the
integration time). As shown, the measurement variance decreases linearly with integration
time (White noise regime) until t
opt
is reached (∼100 seconds in this case), whereupon
instrument drifts start to dominate. In this particular measurement study, which was
carried out in the laboratory employing a temperature-stabilized optical system, the
square root of the Allan Variance yields an estimate of the instrument performance.
Infrared Absorption Spectroscopy 125
4.5
4.0
3.5
3.0
[CH
2
O] ppbv
17:15 17:30 17:45 18:00 18:15 18:30 18:45
Time
4.5
4.0
3.5
3.0
[CH
2
O] ppbv
Input
Fit with background subtraction
Fit without background subtraction
Input
Figure 2.17 The importance of employing rapid background subtraction. In both cases, 20-second
CH
2
O measurements in the laboratory were obtained by sampling a constant 3.714 ppbv CH
2
Oin
zero air mixture at the entrance of our inlet system. The input concentration (solid horizontal line in
both panels) are indicated along with the retrieved CH
2
O mixing ratios without background subtraction
(upper panel) and with the background spectrum subtracted (lower panel). Backgrounds were acquired
for 10 seconds before and after each 20 second sample and the average of the two backgrounds was
subtracted from each intervening sample before fitting in the case of the lower trace.
At 60 seconds, this results in a CH
2
O mixing ratio of 28 pptv, which corresponds to
A
min
= 9×10
−7
employing 2f WMS. This compares to a similar A
min
value of 5 ×10
−7
achieved by Werle et al. (1993) for NO
2
in the laboratory using STFMS in 60 seconds.
2.5.1.3.7 SUMMARY OF THE PERFORMANCE OF
DIFFERENT APPROACHES
In the previous sections, we have described various measurement approaches based upon
sweep integration direct absorption, 2f WMS, STFMS, TTFMS, and CAS, to achieve high
measurement performance using solid-state laser sources coupled with multipass cells. At
the time of writing, there is no clear-cut optimum measurement approach that stands out
when considering real-world atmospheric measurements operating in the mid-IR spectral
region; each technique exhibits unique strengths and weaknesses. The OA-ICOS technique
appears to yield the highest performance of 3 ×10
−11
cm
−1
Hz
−1/2
(Baer et al., 2002)
due to the very long optical pathlengths achievable (4.2 km pathlength). However, these
measurements need to be further confirmed by replicate precision measurements, and at
present such performance was achieved in the near-IR, where one can only take advantage
of this performance for a select group of more abundant atmospheric gases. As discussed,
it would be highly desirable to translate this performance into the mid-IR spectral region.
The present near-IR OA-ICOS performance is limited by residual optical interference
126 Analytical Techniques for Atmospheric Measurement
0.0001
2
3
4
5
6
7
8
0.001
2
3
4
5
6
7
8
0.01
2
3
4
5
CH
2
O Allan variance (ppbv)
2
1
2 3 4 5 6 7 8 92345678923456789
10
100
1000
Integration time (s)
White noise
Time = 1 sec
σ
A
=
190
pptv
Time = 60 sec
σ
A
=
28
pptv
Figure 2.18 Formaldehyde Allan Variance plot carried out in the laboratory using the TDLAS setup
shown in Figure 2.19 and 2f WMS coupled with sweep integration. The square root of the Allan Variance,
A
, yields the limit of detection at the time indicated.
effects in the absorption cell. The literature-reported A
min
values for direct absorption (1×
10
−5
to 3×10
−5
in 1 second) are slightly less sensitive (∼ factor of 2.5) than those achieved
with the various modulation techniques. The magnitude and stability of the background
structure and the effectiveness of capturing and removing such structure during the
measurement ultimately dictate the performance of these various modulation techniques.
The comparative merits of 2f WMS and the various FMS approaches, which are very
nicely summarized by Silver (1992) and Bomse et al. (1992), indicate that comparable
laboratory A
min
values in the 10
−7
–10
−6
Hz
−1/2
range are achievable with all modulation
techniques. These researchers indicate that high frequency WMS (HFWMS) techniques,
employing modulation frequencies around 10 MHz, offer the best compromise between
lower frequency WMS techniques and higher frequency FMS approaches. The FMS
technique has the advantage over WMS in that the laser can be swept much faster
over the absorption features of interest, yielding higher time-response data and fewer
perturbations over each scan ramp. However, the simplicity of 2f WMS has thus far
favored this approach for most field studies. Realistic A
min
values of 4 ×10
−6
to 13×10
−6
for 1-second averaging times have been achieved by our group (Wert et al., 2003a) on
airborne platforms using an absorption pathlength of 100 m. Clearly additional studies,
particularly those in real field environments, are needed to further assess the ultimate
merits of the various approaches. Nevertheless, it is clear that for moderate IR absorbers
like CH
2
OS
integ
= 5 ×10
−20
cm
2
cm
−1
molecule
−1
A
min
values in the 10
−6
–10
−7
range

Infrared Absorption Spectroscopy 127
using 100–200 m sampling pathlengths are required to further improve our understanding
of chemical processes in the background atmosphere. Less stringent detection sensitivities
are needed for stronger IR absorbers and/or higher ambient mixing ratios.
2.5.1.3.8 EXAMPLE OF A SOLID-STATE LASER FIELD
INSTRUMENT
We present in this section one example of an in situ field instrument, using a solid-state
laser source, which has been employed in numerous atmospheric studies. Although the
particulars for each measurement approach described previously may be different, many of
the fundamental concepts are common to all techniques and are illustrated by the following
discussion. Upon completion of this discussion, we present in Table 2.3 typical examples of
each measurement approach, the molecules studied, and the platforms employed.
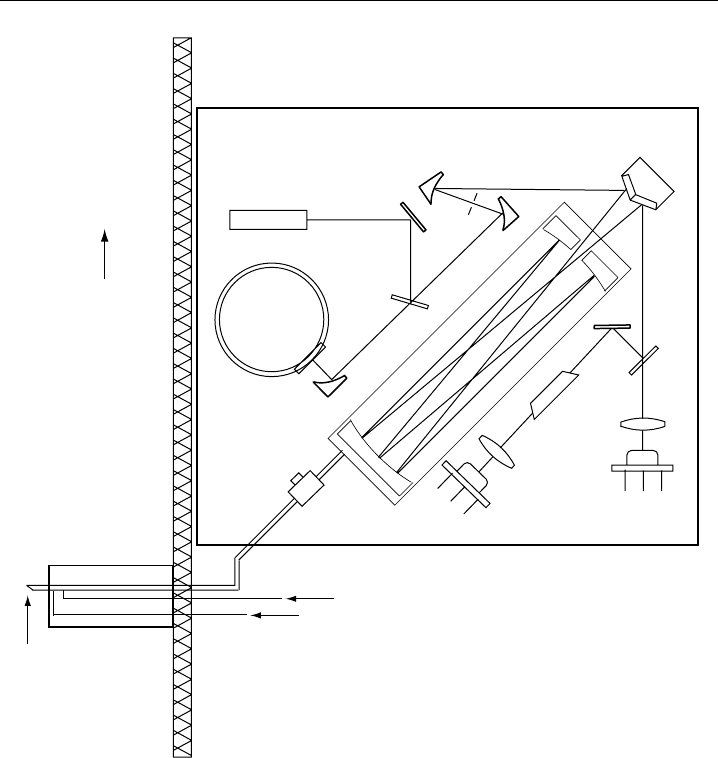
Figure 2.19 depicts an optical schematic of the airborne tunable diode laser system
developed and deployed by our laboratory on numerous airborne campaigns for measure-
ments of CH
2
O (Fried et al., 1998a, 1999a, 2003a,b; Wert et al., 2003a,b). As shown,
Table 2.3 Trace gas measurements using a variety of approaches employing tunable solid-state laser
sources on a wide range of platforms
Gas measured Sampling approach Technique Reference
Ground based measurements
CH
4
In situ extractive MPC STFMS & TT
FMS
Werle and Kormann
(2001)
H
2
O CH
4
In situ extractive MPC HFWMS Hovde et al. (1993)
NO
2
HNO
3
CH
2
O In situ extractive MPC SH Sauer et al. (2003)
H
2
O
2
NO In situ extractive MPC DA Nelson et al. (2002)
CH
2
O H
2
O
2
In situ extractive MPC SH Mackay et al. (1996)
NO
2
HNO
3
In situ extractive MPC DA Hori et al. (1999)
NO, NO
2
O
3
NH
3
In situ extractive MPC DA Nelson (2004)
CH
2
O
CH
2
O In situ extractive MPC SH Fried et al. (1997)
Ship based measurements
NO
2
,CH
2
O, H
2
O
2
In situ extractive MPC SH Harris et al. (1992)
CH
2
O H
2
O
2
, CO In situ extractive MPC SH Wagner et al. (2001)
Low-to-mid-altitude airborne measurements in the troposphere
NO
2
HNO
3
In situ extractive MPC SH Schiff et al. (1990)
CO, N
2
O CH
4
In situ extractive MPC SH line locking Sachse et al. (1987)
Vay et al. (1998)
CO, H
2
O
2
CH
2
O In situ extractive MPC SH Roths et al. (1996)
NO
2
CH
2
O In situ extractive MPC SH Fried et al. (1998a, 1999a,
2003a,b) Wert et al.
(2003a,b)
H
2
O In situ extractive MPC DA Silver and Stanton (1987)
H
2
O In situ open path SH line locking Diskin et al. (2002)

128 Analytical Techniques for Atmospheric Measurement
Table 2.3 (Continued)
Gas measured Sampling approach Technique Reference
High-altitude airborne measurements in the upper troposphere and lower stratosphere
CH
4
In situ extractive MPC DA Richard et al. (2002)
CO, N
2
O In situ extractive MPC SH and SH line
locking
Loewenstein (1988)
N
2
O CH
4
In situ extractive MPC SH Loewenstein et al. (2002)
CO, N
2
O CH
4
In situ extractive MPC TTFMS Wienhold et al. (1998)
HCl, NO
2
HNO
3
In situ extractive MPC SH Webster et al. (1994b)
CH
4
N
2
O
CH
4
In situ extractive MPC TTFMS Amato et al. (2002)
H
2
O CH
4
CO
2
Open path MPC DA Durry et al. (2004)
Balloon-borne measurements
NO, NO
2
HNO
3
O
3
, Remote open path SH, slow Webster et al. (1990,
HCl, H
2
O scanning 1994a) May and Webster
CH
4
N
2
O (1993)
TTFMS and STFMS: Two-tone and single-tone frequency modulation spectroscopy, respectively.
MPC: Multipass absorption cell.
SH: 2f Second harmonic measurements using sweep integration unless otherwise indicated.
DA: Direct absorption.
HFWMS: High frequency wavelength modulation spectroscopy.
the IR radiation from a lead-salt diode laser, operating at 35 m, is directed through a
multipass astigmatic Herriott cell (Aerodyne Research Inc.). For this purpose, the beam is
collimated, focused, and refocused using two parabolic and one ellipsoidal mirror. After
182 passes through the cell (optical pathlength of 100 m), the output IR beam is directed
onto sample and reference indium-antimonide photovoltaic detectors. The optical system
employs a minimum number of components, only two of which are adjustable. The
entire optical system, including the optical bench, is mounted in a thermally controlled
enclosure maintained at 30
C. Both of these aspects are critical for high performance
aircraft measurements and are essential for extending the system stability period out to
1 minute and longer (see Figure 2.18).
Absorption data are acquired using second harmonic WMS (2f WMS) coupled with
sweep integration. In this approach the diode laser is repetitively swept over an isolated
CH
2
O absorption feature 28316417 cm
−1
using a sawtooth ramp applied to the laser-
tuning current at a frequency of 50 Hz. A 50 kHz quasi-square wave modulation waveform
is simultaneously applied to the laser-tuning current and the 2f signal at 100 kHz is
detected in both the sample and the reference arms using lock-in amplifiers. The lock-in
amplifier outputs are then digitized and co-averaged by computer. The reference arm,
which contains a low-pressure cell of pure CH
2
O, serves as a wavelength reference. In this
process, the line centre of the reference arm is determined on every scan, and each scan
is then appropriately shifted in memory to align the peak centers before co-averaging.
This fast spectral shifting is very important for high measurement performance.
During airborne operation, ambient air is continuously drawn through the inlet shown
in Figure 2.19 and through the Herriott cell at controlled pressures of around 50 torr
using typically flow rates of 8–10 standard liters per minute. Background spectra are
Infrared Absorption Spectroscopy 129
Multipass Cell L
=
100
m
He-Ne
Laser
OAE
OAP
OAP
Pellicle
AP
BS
M
M
Ref.Cell
CH2O
Dewar
Reference
detector
Sample
detector
M
L
L
Thermally controlled enclosure
PC
Std
ZA
Aircraft fuselage
Direction of flight
Sample inlet
Heated winglet
Figure 2.19 Schematic of airborne tunable diode laser system for measurements of CH
2
O. The compo-
nents are as follows: PC (pressure controller); OAP (off axis parabolic mirror); OAE (off axis ellipsoidal
mirror); M (flat mirror); AP (aperture); L (lens); BS (beam splitter); Std (CH
2
O gas-phase calibration standard
injection line); and ZA (zero air addition line). Cell flow is maintained using a vacuum pump (not shown)
attached to the cell outlet port located beneath the input/output beam on the right-hand side of the figure.
acquired by passing ambient air from a second inlet through a heated scrubber system
(not shown) and this flow stream is re-routed back into the inlet line a few centimeters
from the tip at flow rates higher than the inlet flow using the zero-air addition line (see
ZA flow in Figure 2.19). Typically, twelve 5 second ambient spectra are acquired during a
1 minute acquisition block, and this is preceded and followed by 10 second background
acquisitions. The background pairs are then averaged (time weighted) and subtracted
point by point from each of the ambient spectra. This rapid background subtraction
not only removes optical noise, as discussed previously, but also reduces the effects
of sample line outgassing (see Wert et al., 2002). Since two backgrounds are acquired

130 Analytical Techniques for Atmospheric Measurement
with every 1 minute ambient sample, it is essential to employ sampling cells with low
sampling volumes (3 liters in our case) in order to stay within the stability period and
to avoid low ambient duty cycles. Calibration spectra are typically acquired every 30–60
minutes by adding a CH
2
O calibration standard to the scrubbed background air, and this
generates calibration-mixing ratios in the 12–14 ppbv range at the Herriott cell entrance.
As discussed previously, each background-subtracted ambient spectrum is fit in real time
to a background-subtracted calibration spectrum employing a multiple linear regression
approach. Many other additional details regarding the instrument and its operation, data
acquisition, and fitting procedures can be found in the references given above.
Table 2.3 lists some examples of other trace gases measured by other groups using a
variety of the approaches employing tunable solid-state laser sources discussed previously
on a wide range of platforms. Some instruments employ multiple diode laser sources with
multiple liquid nitrogen dewars, collection optics, and multiple detectors for simultaneous
measurements of trace gases that absorb in different spectral regions. The three- and four-
channel airborne TRISTAR and FLAIR instruments respectively described by Wienhold
et al. (1998) and Roths et al. (1996) are examples of this type of instrument. However, the
basic detection and performance principles are similar to the single channel system just
described. Table 2.3, which is not all-inclusive, shows a representative set of instruments
using solid-state IR laser sources employed: (1) on ground and shipboard platforms;
(2) on low- to mid-altitude airplanes such as NASA’s DC-8, NCAR’s C-130, and NCAR’s
and NASA’s Electra aircraft for tropospheric measurements; (3) on high altitude airplanes,
such as NASA’s ER-2 and WB-57 and Russia’s Geophysica aircraft for measurements in the
upper troposphere and lower stratosphere (UT/LS); and (4) on balloon-borne platforms
for stratospheric measurements. The latter two platforms are the most demanding since
they require autonomously operated instruments without an onboard operator. We only
include in this table those instruments actually employed in atmospheric studies.
2.5.1.4 In situ measurements employing FTIR
The technique of Fourier Transform Infrared (FTIR) spectroscopy is an extremely versatile
technique for measuring atmospheric constituents. As indicated in Section 2.5, FTIR
instruments can be operated to acquire in situ measurements from aircraft platforms
using an extractive sampling cell or to acquire remote measurements on ground-based
and aircraft platforms. Comprehensive treatises on FTIR spectroscopy can be found in
the textbooks by Griffiths (1975) and Beer (1992), and the review article by Persky
(1995), and only a brief overview of the technique will be presented here. Although
this discussion is somewhat abbreviated compared to the discussion of tunable laser
sources, this by no means is meant to convey any reduced importance such measurements
have on atmospheric studies. In fact, as will be shown, both in situ and remote FTIR
measurements provide unique atmospheric measurements that are not available from
studies employing tunable laser sources.
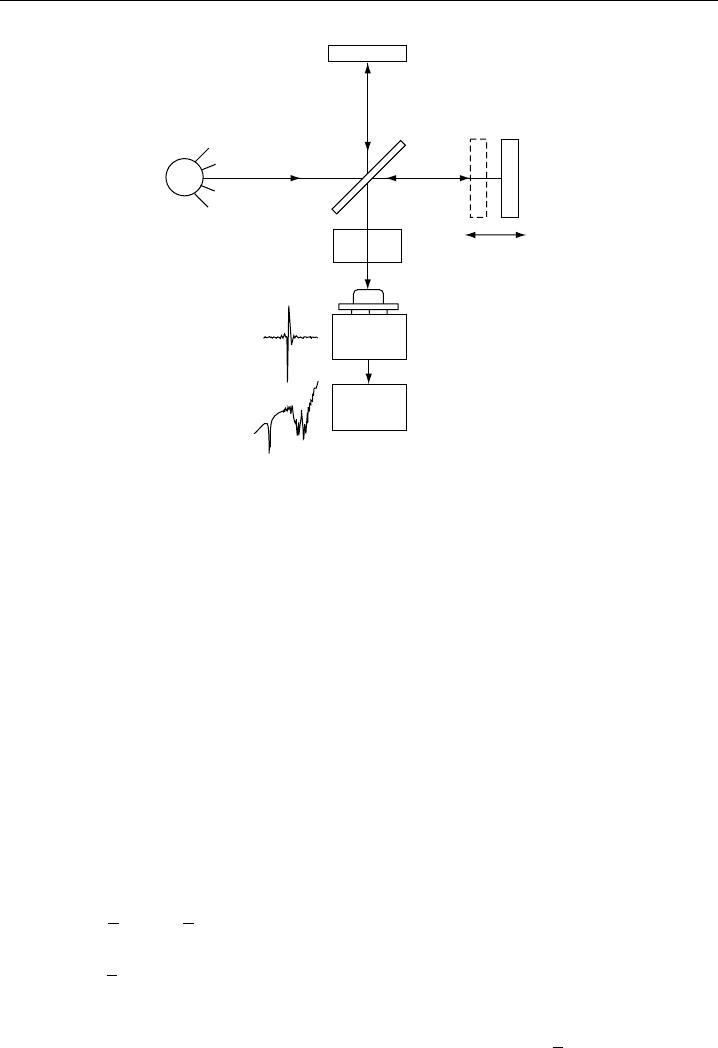
Figure 2.20 illustrates the basic concept of the FTIR approach, which has its roots in
the work of Michelson in 1880. A broadband light source, from either an incandescent
light source mounted with the instrument or the sun or some other source of radiation,
enters the instrument and is split into two optical paths, one of which contains a moving
mirror. The combined beams are directed onto a detector and the intensity variation due
Infrared Absorption Spectroscopy 131
Fixed
mirror
Moving
mirror
Beam
splitter
Incident
beam
Exit
beams
Broadband
source
Detector
DAQ
Δd
Sample
cell
FFT
Interferogram
Processed
spectra
Data
reduction
Figure 2.20 Schematic of the basic optical concept employed in FTIR instruments. The DAQ represents
a data acquisition system and FFT stands for the process of carrying out a fast Fourier Transform.
to optical interference is measured as a function of the path difference or retardation. For
in situ measurements, the source IR beam passes through a multipass absorption cell,
which samples ambient air, and this is shown in Figure 2.21. In modern FTIR instruments,
the recorded intensity variation, which is known as an interferogram, is recorded as the
moving mirror is continuously scanned in a linear manner. In the case of a perfectly
collimated, infinitely narrow bandwidth, monochromatic, light source, impinging on a
perfect 50/50 beam splitter, the detected signal is a maximum when the two paths are
exactly equal. At this zero retardation, the two beams perfectly constructively interfere.
Conversely, the two beams perfectly destructively interfere when the retardation of the
moving mirror is at /2, and this produces zero light at the detector. The signal at the
detector will thus vary sinusoidally for a constant velocity–moving mirror, producing
a maximum each time the retardation is an integral multiple of . One can write the
following simple expression that relates the time variation of the detected intensity I to
the retardation ( in cm):
I = B
cos2 (2.32)
The term B
gives the detected intensity of the light source in frequency units of
wavenumbers modified by various instrumental factors. This term thus represents a
recorded spectrum similar to that acquired by a scanning solid-state laser source. Mathe-
matically, I can be thought of as the cosine Fourier transform of B
, and the spectrum
is determined by taking the Fourier transform of the interferogram I. In the case of an
infinitely narrow bandwidth, monochromatic light source, the interferogram is a perfect
cosine wave. Continuous radiation will produce an interferogram that is the composite