Hawkes P.W., Spence J.C.H. (Eds.) Science of Microscopy. V.1 and 2
Подождите немного. Документ загружается.


Chapter 3 Scanning Electron Microscopy 245
5 Ultrahigh Vacuum Scanning Electron Microscopy in
Surface Science
Ultrahigh vacuum (UHV) scanning electron microscopy is from the
point of view of the pressure inside the specimen chamber the opposite
of SEM at elevated pressure. Since the conventional SEMs typically
work at high vacuum with a pressure of about 10
−4
Pa inside the speci-
men chamber, the elevated pressure SEMs are operated at pressures
six to seven orders of magnitude higher and the UHV SEMs about
three to four orders of magnitude lower than 10
−4
Pa. UHV is required
for most surface science experiments for two principal reasons:
1. To obtain atomically clean surfaces for studies and to maintain such
clean surfaces in a contamination-free state for the duration of the
experiment.
2. To permit the use of a low-energy electron technique and, in addition
to that, ion-based and scanning probe techniques without undue
interference from gas phase scattering.
One crucial factor in determining how long it takes to build up a
certain surface concentration of adsorbed species is the incident molec-
ular fl ux F of gas molecules on surfaces given by the Hertz–Knudsen
equation
Fp mkT
g
= /( )2π
(5.1)
where m is the molecular mass, k is the Boltzmann constant, and T is the
temperature (K). To obtain the minimum estimate of time it will take
for a clean surface to become covered with a complete monolayer of
adsorbate, a sticking probability S = 1 and a monolayer coverage typi-
cally in the order of 10
15
–10
19
molecules/m
2
are assumed. Then the
minimum time per monolayer simply equals
10 2
19
⋅ ()/πmkT p
g
, i.e.,
the lower the pressure the longer the time for coverage. At a pressure of
about 10
−4
Pa forming a monolayer takes about 1 s.
Clean surfaces and UHV are required to apply very surface-sensitive
methods such as Auger electron spectroscopy (AES) and spectromi-
croscopy, X-ray- and UV-induced photoelectron spectroscopies, and
LVSEM a nd VLVSEM. SEM in UHV can be done with customized
FESEMs equipped with an energy analyzer for AES, chemical state
analysis, or trace element detection, respectively. These UHV-SEMs
enable highly sensitive surface area observation using high-resolution
SE imaging and are very well suited for EBSD observation (see Section
7) of electron chan neling patterns without contamination as well as
low accelerating voltage EDX analysis (see Section 6). An attached
neutralizing ion gun allows analysis of insulating bulk materials and
thin fi lms without electrical charge ups.
SEM in UHV can also be performed with commercial surface science
UHV chamber systems and a UHV SEM column attached to it. Such
chamber systems offer an in situ combination of several imaging
methods (e.g., LVSEM, SAM, AFM, and STM), methods for chemical
analysis such as AES, and diffraction methods such as low-energy
246 R. Reichelt
electron diffraction (LEED). Dual-chamber systems have a large
chamber for the imaging and analysis techniques mentioned above
and a second chamber for specimen preparation such as ion sputtering,
heating, and thin fi lm growth.
SEM in UHV combined with other imaging, spectroscopic, and dif-
fraction methods enables the true surface structure and chemistry to
be studied. In particular, LVSEM and VLVSEM are most powerful in
UHV because of their high surface sensitivity, which is not noticeably
degraded by irradiation-induced contamination.
6 Microanalysis in Scanning Electron Microscopy
The generation of X-rays due to electron–specimen interactions was
discussed in Section 2.2.5. The characteristic X-rays emitted from the
specimen carry information about its local element composition, which
is utilized as a powerful microanalytical tool combining SEM with
EDX and WDX spectrometers. X-Ray microanalysis is by far the most
widely used method combined with SEM, which enables in various
modes qualitative and quantitative element analysis from a point or
area of interest as well as mapping of the distribution of various ele-
ments simultaneously with SE and BSE imaging. The size of the inter-
action volume emitting X-rays is signifi cantly larger than the ones for
AE, SE, and BSE because of the weaker absorption of X-rays inside the
specimen (cf. Figure 3–14) and the secondary emission by X-ray fl uo-
rescence outside the electron interaction volume. The secondary X-ray
emission volume is much larger than that for primary X-ray emission
since X-rays are more penetrating than electrons having the same
energy. For electron-excited X-ray spectrometry performed on thick
specimens in the SEM, the range R for X-ray excitation is given accord-
ing to Kanaya and Kayama (1972) by
R [µm] = (0.0276 A/ρZ
0.89
) · (E
0
1.67
− E
x
1.67
) (6.1)
where A is the atomic weight (g/mol), ρ is the density (g/cm
3
), Z is the
atomic number, E
0
is the incident electron energy (keV), and E
X
is the
X-ray energy (keV).
For reliable quantitative X-ray microanalytical studies, X-ray absorp-
tion, X-ray fl uorescence, and the fraction of backscattered electrons, all
of which depend on the composition of the specimen, have to be taken
into account and are performed by the so-called ZAF correction. Z
stands for atomic number, which affects the penetration of incident
electrons into the material, A for absorption of X-rays in the specimen
on the path to the detector, and F for fl uorescence caused by other X-
rays generated in the specimen.
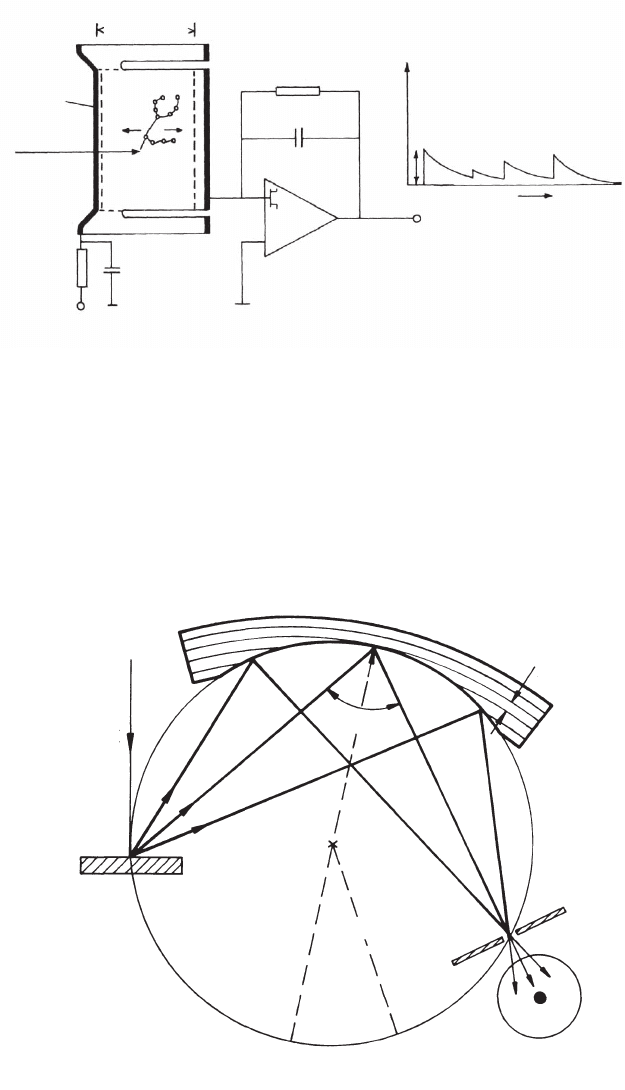
Two different types of detectors are used to measure the emitted X-
ray intensity as a function of the energy or wavelength. In an EDX
system (Figure 3–64) the X-rays enter the solid-state semiconductor
detector and create electron hole pairs that cause a pulse of current to
fl ow through the detector circuit. The number of pairs produced by
each X-ray photon is proportional to its energy (see Section 2.1.3.1). In
a WDX spectrometer (Figure 3–65) the X-rays fall on a bent crystal and

Chapter 3 Scanning Electron Microscopy 247
Figure 3–64. Scheme of Si(Li) X-ray diode coupled to a fi eld effect transistor
(FET) with a resistive feed back loop (R
F
, C
F
). The shape of the output signal is
shown in the output voltage vs. time diagram. Typically, this principle is used
in energy-dispersive X-ray (EDX) detectors. (From Reimer, 1985; with kind
permission of Springer-Verlag GmbH, Heidelberg, Germany.)
Si (Li) diode
p
i
p
n
Preamplifier
Time
Output
U
o
U
R
F
C
F
FET
20 nm Au
X-ray
Bias voltage
–1000 V
3 – 5 mm
+–
Figure 3–65. Principle of a wavelength-dispersive X-ray (WDX) spectrometer.
Generated X-rays that hit the analyzing crystal are focused and due to Bragg
refl ection directed to a slit in front of the proportional counter lying on a
Rowland circle with radius r
f
. The lattice planes of the crystal are bent to a
radius of 2r
f
. (From Reimer, 1985; with kind permission of Springer-Verlag
GmbH, Heidelberg, Germany.)
Analysing crystal with lattice planes of radius r
d
PE
Specimen
Rowland circle
of radius r
f
Proportional
counter
Slit
d
B
X
π – 2Θ
r
f
r
d
= 2r
f
248 R. Reichelt
are refl ected only if they satisfy Bragg’s law. The crystal bending is such
that it focuses X-rays of one specifi c wavelength onto a proportional
counter and rotates to scan the wavelength detected. Some important
features of both types of X-ray spectrometer are listed in Table 3–9.
However, since instrumentation and analysis of data in X-ray micro-
analysis are usually considered a separate discipline, no further details
are discussed in this section [see, e.g., Heinrich (1982), Heinrich and
Newbury (1991), Reimer (1998), Goldstein et al. (1984, 2003), and
Newbury and Bright (2005)].
A selected application of the very powerful combination of SEM
imaging, X-ray micro analysis, and element mapping—the latter was
invented almost exactly 50 years ago by Cosslett and Duncumb (1956)—
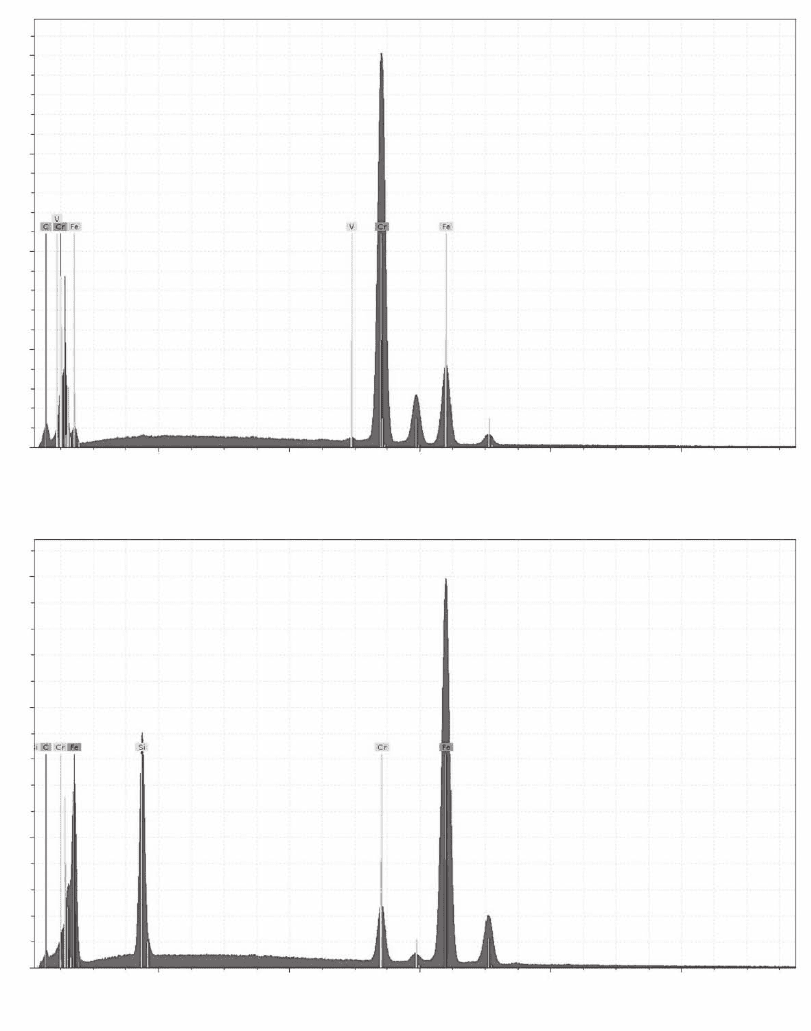
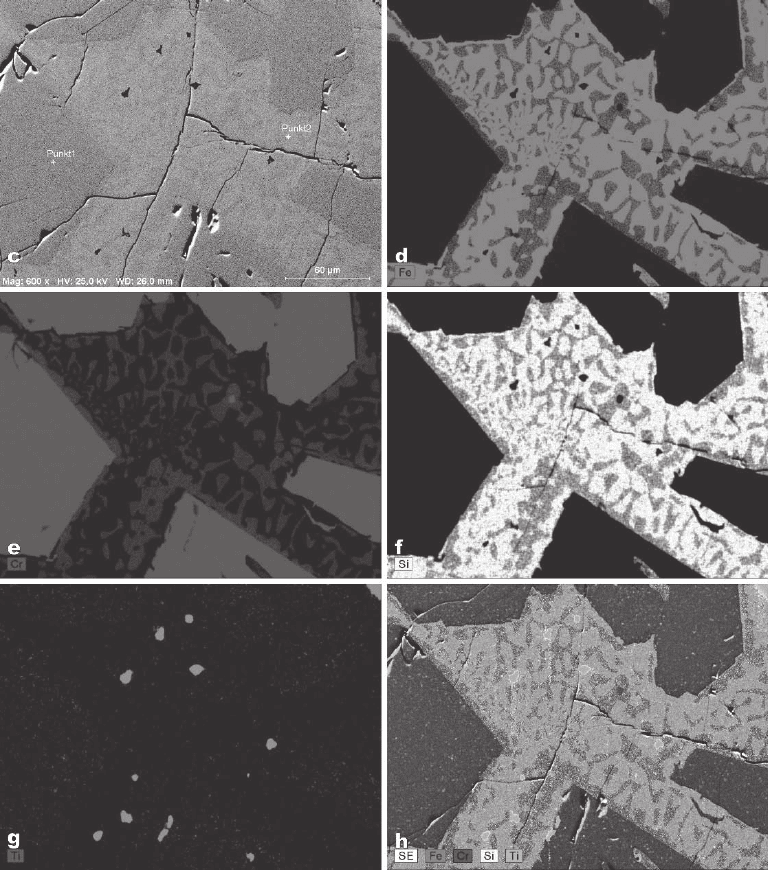
is illustrated in Figure 3–66. The selected specimen is a Cr–Fe alloy
with an Si phase, which has a locally varying composition as clearly
indicated by the energy-dispersive spectra in Figure 3–66a and b
recorded at different locations (Figure 3–66c).
The area under each characteristic peak represents the amount of
X-ray counts, which is—after subtraction of the unspecifi c background
below the peak and ZAF correction—a direct quantitative measure of
the number of atoms of the specifi c element belonging to that peak.
However, a simple visual inspection of the spectra shows, e.g., that the
location “Punkt1” (see Figure 3–66a) contains signifi cantly more chro-
mium and less iron than location “Punkt2” (see the spectrum in Figure
3–66b). In addition, a strong silicon peak emerges in the spectrum of
location “Punkt2” not present in the spectrum of “Punkt1” (see the
spectrum in Figure 3–66a). The element distribution maps of four
important chemical elements in the specimen, namely iron, chromium,
silicon, and titanium, are shown in Figure 3–66d–g. Comparing the
information given by the four element distribution maps on the one
hand and the two spectra on the other hand immediately makes clear
why the titanium peak does not emerge in the spectra and the chro-
means of simple image processing procedures the SE micrograph
(Figure 3–66c) and the element distribution maps (Figure 3–66d–g) can
be superimposed in one image (Figure 3–66h) presenting information
for fi ve individual images.
The most powerful tool in electron beam microanalysis is the ability
to depict the elemental compositional heterogeneity of matter with
micrometer to nanometer lateral resolution. Many developments have
occurred since the intervening years to advance this critical method.
We are now on the leading edge of extraordinary new X-ray mapping
performance: the emergence of the silicon drift detector (SDD) that
permits recording of X-ray spectrum images (XSI) in an energy-disper-
sive operating mode with output count rates of 600 kHz and even
higher (cf. Table 3–9). Further, computer-controlled SEM in connection
with image processing and EDX spectrometry enables the unattended
and automated determination of both the geometric parameters and
the chemical composition of thousands of individual particles down to
a size of 50–100 nm (see, e.g., Poelt et al., 2002). Consequently, correla-
tions between particle size, chemical composition, the number of
mium peak is dominant at location “Punkt1” but not at “Punkt2”. By

Chapter 3 Scanning Electron Microscopy 249
Table 3 –9. Characteristic features of energy-dispersive X-ray (EDX) and wavelength-dispersive X-ray (WDX) detectors.
a
Detector
Energy dispersive
Energy dispersive Energy dispersive Energy dispersive Si microcalorimeter Wavelength
Features Si(Li) X-ray detector
b
HPGe X-ray detector
b
drift (SD) X-ray X-ray detector
f
dispersive X-ray
detector
c,d,e
detector
b
Geometric collection <2% <2% <2% ª8 ¥ 10
−3
% <0.2%
effi ciency
Quantum effi ciency ª100% ª100% >90% 60–80% £30%
(within 1–2 keV)
Element detection Z ≥ 11 (Be window) Z ≥ 4 Z ≥ 5 Z ≥ 6
g
Z ≥ 4
Z ≥ 4 (windowless)
Energy resolution 150 eV (at 5.9 keV) 133 eV (at 10
4
cps) 150 eV (at 10
5
cps) 12 eV (at 5.9 keV) ª5 eV
115 eV (at 10
3
cps) 230 eV (at 6 ¥ 10
5
cps) 3.1 eV (at 1.49 keV)
Maximum counting rate 3 ¥ 10
3
cps 3 ¥ 10
4
cps ª6 ¥ 10
5
cps 8 ¥ 10
2
cps–10
3
cps 10
5
cps
Spectrum acquisition All energies All energies All energies All energies One wavelength
simultaneously simultaneously simultaneously simultaneously at a time
Probe current (nA) 0.1–20 0.1–10 0.1–10 0.1–10 1–100
a
Si(Li), Lithium drifted silicon; HPGe, high-purity germanium; cps: counts per second.
b
Reichelt (1995).
c
Strüder et al. (1998a).
d
Strüder et al. (1998b).
e
Lechner et al. (2001).
f
Newbury et al. (1999).
g
With BN/Moxtek window, thermal isolation, and Au-absorber.

Figure 3–66. X-Ray microanalysis of a Cr–Fe-alloy with a Si phase. The EDX spectra (a and b) were
recorded with the Röntec XFlah3001 from locations “Punkt1” and “Punkt2” marked in the SE micro-
graph of the specimen (c). The positions of the characteristic X-ray energies for the various elements
emerging in the spectra are indicated by thin colored lines, which are labeled with the chemical
symbol of the corresponding chemical element. The elements iron, chromium, and vanadium occur
with one K
α
peak each in the energy range from 4.95 to 6.40 keV and with one less intense L
α
peak
each in the energy range from 0.51 to 0.71 keV. Elemental distribution maps of Fe (d), Cr (e), Si (f), and
Ti (g) were recorded using the K
α
lines. (h) Mixed micrograph obtained by superimposition of the SE
image and the maps of the distribution of Fe, Cr, Si, and Ti within the fi eld of view. Experimental
conditions: SEM, LEO 438VP. For recording spectra: E
0
= 20 keV; count rate, ≈ 3 × 10
3
cps; acquisition
time, 300 s. For recording maps: E
0
= 25 keV; count rate ≈ 1.5 × 10
5
cps; acquisition time 600 s. (EDX
spectra, SE micro graph, and elemental distribution maps were kindly provided by Röntec GmbH,
Berlin, Germany.) (See color plate.)
x 1E3 Pulses/eV
4.0
3.0
2.0
1.0
0.0
2
a
b
46
- keV -
810
x 1E3 Pulses/eV
3.0
2.0
1.0
0.0
246
- keV -
810

Chapter 3 Scanning Electron Microscopy 251
Figure 3–66. Continued
252 R. Reichelt
different compounds, and their contribution to the overall concentra-
tion can be established. Problems may arise in connection with speci-
men preparation, optimization of the image contrast, the sometimes
nonhomogeneous composition of particles, shadowing of the X-rays in
case of large particles, and the lack of a rigorous ZAF correction pro-
cedure for particles of arbitrary shape.
Another increasingly important application is multilayer analysis,
i.e., the nondestructive measurement of the thickness and composition
of thin fi lms both unsupported and on substrates, which can be per-
formed with high accuracy down to a thickness of 2 nm by a combina-
tion SEM and EDX (see, e.g., Hu and Pan, 2001; Rickerby and Thiot,
1994; Rickerby et al., 1998; Smith et al., 1995). For this purpose the ratio
between the X-ray intensity of the fi lm and the intensity of the same
element of a bulk standard is used.
Low-voltage scanning electron microscopy (E
0
< 5 keV) offers both
high spatial resolution and a signifi cantly reduced X-ray generation
depth. This enables the composition of thin layers on substrates to be
determined without the need to use a dedicated thin fi lm analysis
program. The analysis of small phases down to a size of 50 nm is also
possible (see, e.g., Poelt, 2000; Wurster, 1997). However, the disadvan-
tages are that the X-ray intensity produced is small because of low fl uo-
rescence yield ω (cf. Figure 3–22) and not all elements can be analyzed.
In principle elements of higher atomic number can be identifi ed using
L- and M-shell X-rays, but these are much more complicated than the
rather simple K-shell X-ray emissions. Although the enhanced
surface sensitivity may be useful sometimes, in many cases it is more
likely to be a problem. If thin fi lm coating is required this fi lm
may be a signifi cant fraction of the electron range, and without it the
specimen may charge up. Working at E
0
= E
2
, where incoming
and emitted electrons are balanced, is usually not suffi cient. Further-
more, having the electron beam stationary on the specimen for a long
time to integrate the weak signals is exactly the way to produce con-
tamination, which can stop the electrons before they reach the real
specimen surface. Then X-ray microanalysis does not relate to the
specimen at all.
7 Crystal Structure Analysis by Electron Backscatter
Diffraction
In crystalline specimens electrons are diffracted at lattice planes
according to Bragg’s law given as
2d sin ϑ = nλ (7.1)
where d is the lattice-plane spacing, ϑ is Bragg’s angle, and λ is the
electron wavelength. Bragg’s law requires that the incident and emer-
gent angles should be equal ϑ. As previously mentioned, the backscat-
tering coeffi cient sensitively depends on the tilt of the incident electron
beam relative to the lattice and Bragg position. Changing the tilt of the

Chapter 3 Scanning Electron Microscopy 253
incident beam relative to the lattice, e.g., by rocking the electron beam
or tilting the specimen, affects the backscattering coeffi cient, which
results in an electron channeling pattern (ECP). To obtain from an ECP
information about the crystal structure, e.g., the crystal orientation and
the lattice plane spacings, a so-called panorama diagram recorded by
successively tilting the specimen over a large angular range is required
(Joy et al., 1982; van Essen et al., 1971; Reimer, 1998). However, establish-
ing a panorama diagram is a somewhat diffi cult task.
Another way of obtaining information about the crystal structure of
the specimen is the use of electron diffraction effects associated with
the scattered electrons. As described in Section 2.2, the beam electrons
are scattered elastically and inelastically due to the electron–specimen
interaction, thus scattered beam electrons travel within the excitation
volume in all directions (cf. Figure 3–13). This scattering process can
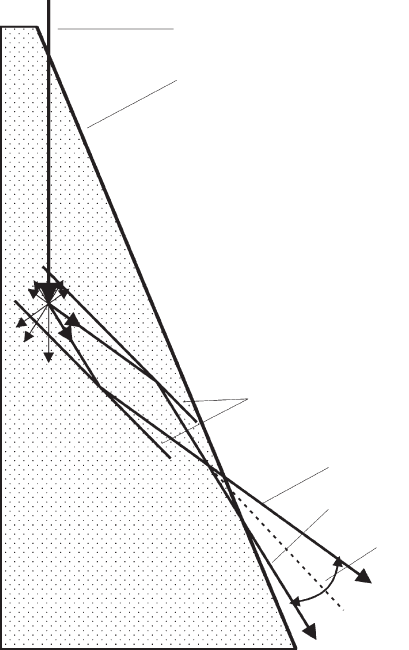
be considered as a small electron source inside the crystalline speci-
men emitting electrons in all directions as shown in Figure 3–67. These
electrons may be diffracted at sets of parallel lattice planes according
Electron beam
Crystal surface
Lattice planes
Cone 1
Cone 2
2ϑ
Figure 3–67. Scheme of the formation of one pair of cones from diffraction of
scattered electrons at one set of parallel lattice planes.
254 R. Reichelt
to Bragg’s law [(Eq. (7.1)] as fi rst observed by Venables and Harland
(1973). Figure 3–67 illustrates that the electrons emitted from one point
and diffracted at lattice planes will form pairs of cones centered with
respect to the normal vector of these lattice planes. The opening angle
of the cones is 180° −2ϑ and the angle between them is 2ϑ. Since the
Bragg angle is in the order of 1° for 15–30 keV electrons and lattice-
plane spacings of 0.2–0.3 nm, the intersections of the cones with a fl at
observation screen positioned at a distance much large than d (usually
2–4 cm from the point of beam–specimen intersection) and tangential
to the propagation sphere of the scattered electrons are almost straight
and parallel pairs of lines. The are called Kikuchi lines. The angle
between parallel pairs of Kikuchi lines is 2ϑ. The whole EBSD pattern
with the Kikuchi lines reveals local information about the crystalline
structure within the individual excitation volume. A detailed treat-
ment of EBSD, which is beyond the scope of this section, is given by
Wilkinson and Hirsch (1997). Nevertheless, it is worth mentioning that
the relationship between EBSD and the previously introduced ECP is
characterized by the reciprocity of their ray diagrams (Reimer, 1985).
The recording of the EBSD pattern, which originally was performed
by exposure of a photographic fi lm, is now done by position-
sensitive detectors such as a phosphorous screen coupled to a TV
camera or a scintillation window with a CCD camera attached. To
allow the diffracted electrons to escape from the specimen its surface
is usually tilted approximately 60° or 70° toward the screen. The EBSD
patterns are digitally acquired by computer, which also controls the
positioning of the beam. In case of automated crystal orientation
mapping, the computer scans the electron beam stepwise across the
specimen and controls the dynamic focusing of the beam (cf. Figure
3–9e and Section 2.1.5.2). Since special software algorithms for the
automated detection and indexing of Kikuchi lines in EBSD pattern
were introduced by Krieger-Lassen et al. (1992), Adams et al. (1993)
developed a new scanning technique called “orientation imaging micro-
scopy” (OIM). In OIM, which is also called automated crystal orienta-
tion mapping, the EBSD pattern from each individual point at the
specimen surface radiated by the electron beam is recorded and ana-
lyzed. The current state of the art of OIM is reviewed by Schwarzer
(1997) and Schwartz et al. (2000).
In the past decade EBSD has become a powerful tool for crystallo-
graphic analysis such as the determination of the orientation of indi-
vidual crystallites of polycrystalline materials in the SEM, phase
identifi cation, and characterization of grain boundaries, which is illus-
trated by the following examples. Figure 3–68 shows two different
EBSD patterns from an as-cast niobium sample recorded with high
(Figure 3–68a) and low resolution (Figure 3–68b), respectively (Zaef-
ferer, 2004), at a stationary beam position. Figure 3–68c shows the
colored pairs of Kikuchi lines generated by automatic indexing and
overlayed to the EBSD monitored in Figure 3–68a.
Figure 3–69a shows an SE micrograph of polycrystalline austenite
with the related color-coded orientation map of polycrystalline austen-
ite monitored in Figure 3–69b (Zaefferer et al., 2004). The spatial resolu-
