Hawkes P.W., Spence J.C.H. (Eds.) Science of Microscopy. V.1 and 2
Подождите немного. Документ загружается.

Chapter 2 Scanning Transmission Electron Microscopy 95
trast, and it is obvious to an operator when the image is correctly
focused, unlike phase contrast CTEM for which focus changes do not
reduce the contrast so quickly, and just lead to contrast reversals.
There are now many examples in the literature of structure determi-
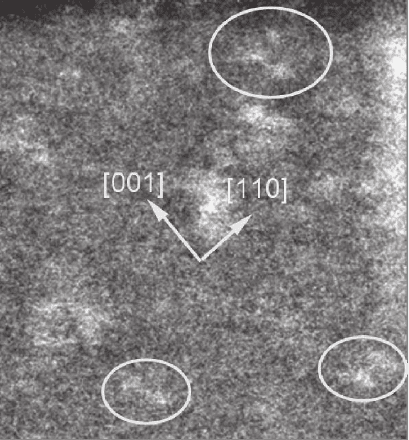
nation by atomic resolution ADF STEM. An excellent recent example
is the three-dimensional structural determination of a NiS
2
/Si(001)
interface (Falke et al., 2004) (Figure 2–14). The ability to immediately
interpret intensity peaks in the image as atomic columns allowed this
structure to be determined, and to correct an earlier erroneous struc-
ture determination from HRTEM data.
A disadvantage of scanned images such as an ADF image compared
to a conventional TEM image that can be recorded in one shot is that
instabilities such as specimen drift manifest themselves as apparent
lattice distortions. There have been various attempts to correct for this
by using the known structure of the surrounding matrix to correct for
the image distortions before analyzing the lattice defect of interest (see,
for example, Nakanishi et al., 2002).
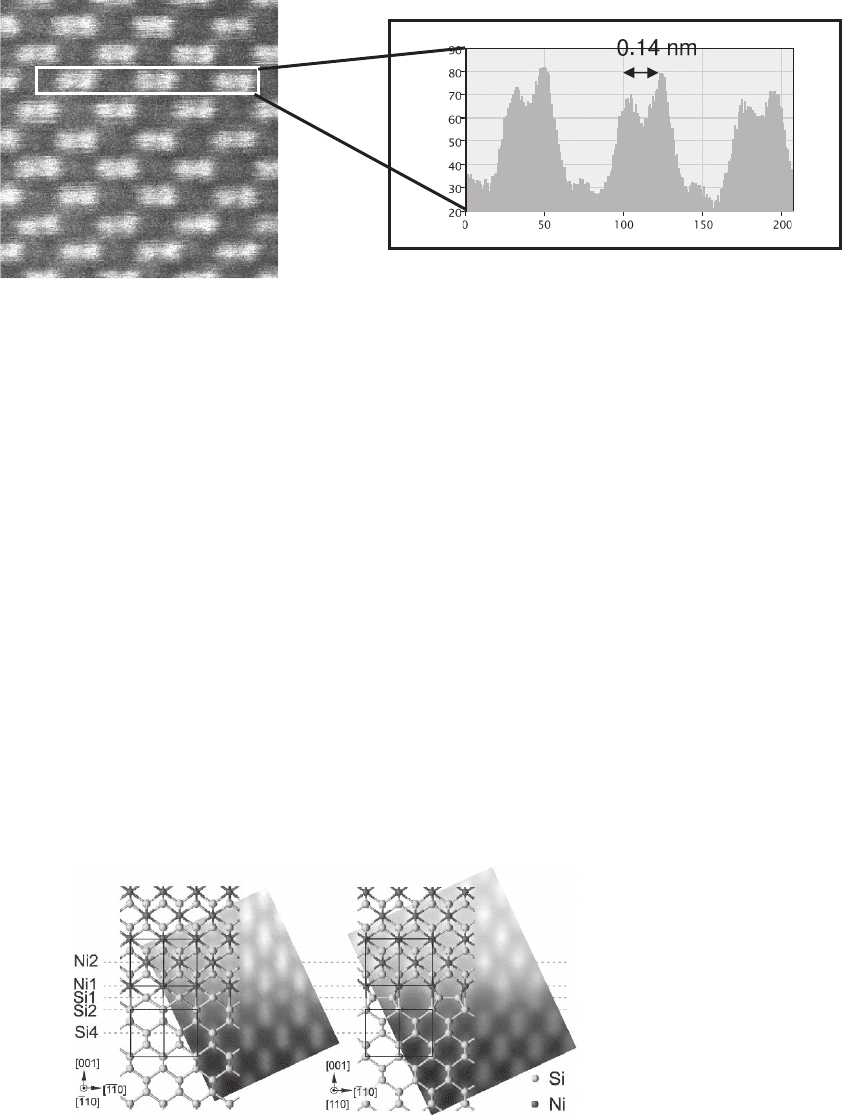
Figure 2–13. An ADF image of GaAs<110> taken using a VG Microscopes HB603U instrument (300 kV,
C
S
= 1 mm). The 1.4-Å spacing between the “dumbbell” pairs of atomic columns is well resolved. An
intensity profi le shows the polarity of the lattice with the As columns giving greater intensity. The
weak subsidiary maxima of the probe can be seen between the columns.
Figure 2–14. An ADF image of an NiS
2
/Si(001) interface with the structure deter-
mined from the image overlaid. [Reprinted with permission from Falke et al.
(2004). Copyright (2004) by the American Physical Society.] (See color plate.)
96
5.4 Examples of Compositionally Sensitive Imaging
The ability of ADF STEM to provide images with high composition
sensitivity enabled the very fi rst STEM, operating at 30 kV, to image
individual atoms of Th on a carbon support (Crewe et al., 1970). In such
a system, the heavy supported atoms are obvious in the image, and
little is required in the way of image interpretation. A useful applica-
tion of this kind of imaging is in the study of ultradispersed supported
heterogeneous catalysts (Nellist and Pennycook, 1996). Figure 2–15
shows individual Pt atoms on the surface of a grain of a powered γ-
alumina support. Dimers and trimers of Pt may be seen, and their
interatomic distances measured. The simultaneously recorded BF
image shows fringes from the alumina lattice, from which its orienta-
tion can be determined. By relating the BF and ADF images, informa-
tion on the confi guration of the Pt relative to the alumina support may
be determined. The exact locations of the Pt atoms were later confi rmed
from calculations (Sohlberg et al., 2004).
When imaging larger nanoparticles, it is found that the intensity of
the particles in the image increases dramatically when one of the par-
ticle’s low-order crystallographic axes is aligned with the beam. In such
a situation, quantitative analysis of the image intensity becomes more
diffi cult.
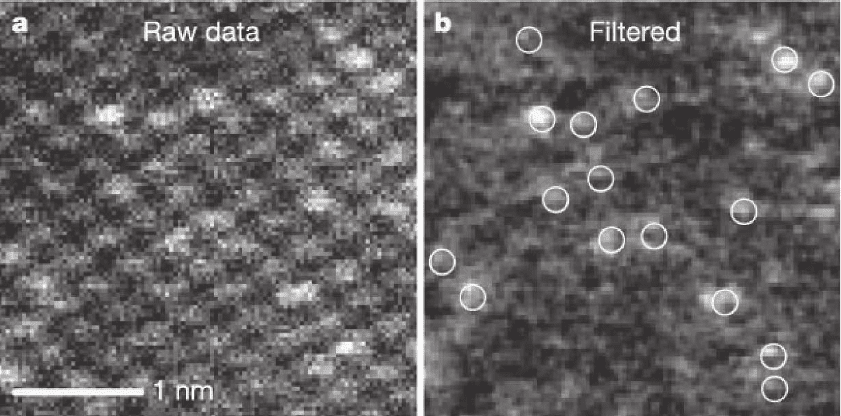
A more complex situation occurs for atoms substitutional in a lattice,
such as dopant atoms. Modern machines have shown themselves to be
capable of detecting both Bi (Lupini and Pennycook, 2003) and even Sb
dopants (Voyles et al., 2002) in an Si lattice (Figure 2–16). In Voyles
Figure 2–15. An ADF image of individual atoms of Pt on a γ-Al
2
O
3
support
material. The BF image collected simultaneously showed fringes that allowed
the orientation of the γ-Al
2
O
3
to be determined. Subsequent theory calculations
(see text) confi rmed the likely locations of the Pt atoms.
Peter D. Nellist
Chapter 2 Scanning Transmission Electron Microscopy 97
et al. (2004) it was noted that the probe channeling then dechanneling
effects can change the intensity contribution of the dopant atom depen-
ding on its depth in the crystal. Indeed there is some overlap in the
range of possible intensities for either one or two dopant atoms in a
single column. Another similar example is the observation of As seg-
regation at a grain boundary in Si (Chisholm et al., 1998).
Naturally, ADF STEM is powerful when applied to multilayer struc-
tures in which composition sensitivity is desirable. There have been
several examples of the application to AlGaAs quantum well structures
(see, for example, Anderson et al., 1997). Simulations have been used
to enable the image intensity to be interpreted in terms of the fractional
content of Al, where it has been assumed that the Al is uniformly dis-
tributed throughout the sample.
6. Electron Energy Loss Spectroscopy
So far we have considered the imaging modes of STEM, which pre-
dominantly detect elastic or quasielastic scattering of the incident elec-
trons. An equally important aspect of STEM, however, is that it is an
extremely powerful analytical instrument. Signals arising from inelas-
tic scattering processes within the sample contain much information
about the chemistry and electronic structure of the sample. The small,
bright illuminating probe combined with the use of a thin sample
means that the interaction volume is small and that analytical informa-
tion can be gained from a spatially highly localized region of the
sample.
Figure 2–16. An ADF image (left) of Si<110> with visible Sb dopant atoms. On the right, the lattice
image has been removed by Fourier fi ltering leaving the intensity changes due to the dopant atoms
visible. (From Voyles et al. (2002), reprinted with permission of Nature Publishing Group.)

98
Electron energy-loss spectroscopy (EELS) involves dispersing in
energy the transmitted electrons through the sample and forming a
spectrum of the number of electrons inelastically scattered by a given
energy loss versus the energy loss itself. Typically, inelastic scattering
events with energy losses up to around 2 keV are intense enough to be
useful experimentally.
The energy resolution of EELS spectra can be dictated by both the
aberrations of the spectrometer and the energy spread of the incident
electron beam. By using a small enough entrance aperture to the spec-
trometer the effect of spectrometer aberrations will be minimized,
albeit with loss of signal. In such a case, the incident beam spread will
dominate, and energy resolutions of 0.3 eV with a CFEG source and of
about 1 eV with a Schottky source are possible. Inelastic scattering
tends be low angled compared to elastic scattering, with the character-
istic scattering angle for EELS being (for example, Brydson, 2001)
θ
E
=
∆E
E2
0
(6.1)
For 100-keV incident electrons, θ
E
has a value of 1 mrad for a 200 eV
energy loss ranging up to 10 mrad for a 2 keV energy loss. The EELS
spectrometer should therefore have a collection aperture that accepts
the forward scattered electrons, and should be arranged axially about
the optic axis. Such a detector arrangement still allows the use of an
ADF detector simultaneously with an EELS spectrometer (see Figure
2–1), and this is one of the important strengths of STEM: an ADF image
of a region of the sample can be taken, and spectra can be taken from
sites of interest without any change in the detector confi guration of the
microscope.
There are reviews and books on the EELS technique in both TEM
and STEM (see Egerton, 1996; Brydson, 2001; Botton, this volume). In
the context of this chapter on STEM, we will mostly focus on aspects
of the spatial localization of EELS.
6.1 The EELS Spectrometer
A number of spectrometer designs have emerged over the years, but
the most commonly found today, especially with STEM instruments,
is the magnetic sector prism, such as the Gatan Enfi na system. An
important reason for their popularity is that they are not designed to
be in-column, but can be added as a peripheral to an existing column.
Here we will limit our discussion to the magnetic sector prism.
A typical prism consists of a region of homogeneous magnetic fi eld
perpendicular to the electron beam (see, for example, Egerton, 1996). In
the fi eld region, the electron trajectories follow arcs of circles (Figure
2–1) whose radii depend on the energy of the electrons. Slower electrons
are defl ected into smaller radii circles. The electrons are therefore dis-
persed in energy. An additional property of the prism is that it has a
focusing action, and will therefore focus the beam to form a line spec-
trum in the so-called dispersion plane. In this plane, the electrons are
typically dispersed by around 2 µm/eV. Some spectrometers are fi tted
with a mechanical slit at this plane that can be used to select part of the
Peter D. Nellist
Chapter 2 Scanning Transmission Electron Microscopy 99
spectrum. A scintillator–photomultiplier combination allows detection
of the intensity of the selected part of the spectrum. Using this arrange-
ment, a spectrum can be recorded by varying the strength of the mag-
netic fi eld, thus sweeping the spectrum over the slit and recording the
spectrum serially. Alternatively, the magnetic fi eld can be held con-
stant, selecting just a single energy window, and the probe scanned to
form an energy-fi ltered image.
If there is no slit, or the slit is maximally widened, the spectrum may
be recorded in parallel, a technique known as parallel EELS (PEELS).
The dispersion plane then needs to be magnifi ed in order that the
detector channels allow suitable sampling of the spectrum. This is
normally achieved by a series of quadrupoles (normally four) that
allows both the dispersion and the width of the spectrum to be con-
trolled at the detector. Detection is usually performed either by a paral-
lel photodiode array, or more commonly now using a scintillator–CCD
combination.
Like all electron-optical elements, magnetic prisms suffer from aber-
rations, and these aberrations can limit the energy resolution of the
spectrometer. In general, a prism is designed such that the second-
order aberrations are corrected for a given object distance before the
prism. Prisms are often labeled with their nominal object distances,
which is typically around 70 cm. Small adjustments can be made using
sextupoles near the prism and by adjusting the mechanical tilt of the
prism. It is important, though, that care is taken to arrange that the
sample plane is optically coupled to the prism at the correct working
distance to ensure correction of the second-order spectrometer aberra-
tions. More recently, spectrometers with higher order correction (Brink
et al., 2003) have been developed. Alternatively, it has been shown to
be possible to correct spectrometer aberrations with a specially
designed coupling module that can be fi tted immediately prior to the
spectrometer (see Section 8.1).
Aberrations worsen the ability of the prism to focus the spectrum as
the width of the beam entering the prism increases. Collector apertures
are therefore used at the entrance of the prism to limit the beam width,
but they also limit the number of electrons entering the prism and
therefore the effi ciency of the spectrum detection. The trade-off
between signal strength and energy resolution can be adjusted to the
particular experiment being performed by changing the collector aper-
ture size. Aperture sizes in the range of 0.5–5 mm are typically
provided.
6.2 Inelastic Scattering of Electrons
The different types of inelastic scattering event that can lead to an EELS
signal have been discussed many times in the literature (for example,
Egerton, 1996; Brydson, 2001; Botton, this volume), so we will restrict
ourselves to a brief description here. A schematic diagram of a typical
EEL spectrum is shown in Figure 2–17.
The samples typically used for high-resolution STEM are usually
thinner than the mean free path for inelastic scattering (around 100 nm
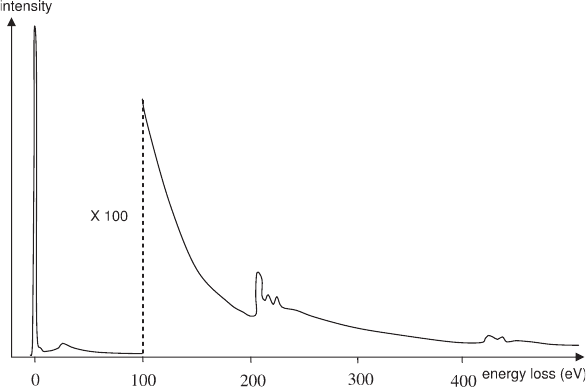
100
at 100 keV), so the dominant feature in the spectrum is the zero-loss
(ZL) peak. When using a spectrometer for high energy resolution,
the width of the ZL is usually limited by the energy width of the
incident beam. Because STEM instruments require a fi eld-emission
gun, this spread is usually small. In a Schottky gun this spread is
around 0.8 eV, whereas a CFEG can achieve 0.3 eV or better. The lowest
energy losses in the sample will arise from the creation and destruction
of phonons, which have energies in the range of 10–100 meV. This range
is smaller than the width of the ZL, so such losses will not be
resolvable.
The low-loss region extends from 0 to 50 eV and corresponds to excita-
tions of electrons in the outermost atomic orbitals. These orbitals can
often extend over several atomic sites, and so are delocalized. Both
collective and single electron excitations are possible. Collective excita-
tions result in the formation of a plasmon or resonant oscillation of the
electron gas. Plasmon excitations have the largest cross section of all
the inelastic excitations, so the plasmon peak dominates an EEL spec-
trum, and can complicate the interpretation of other inelastic signals
due to multiple scattering effects. Single electron excitations from states
in the valence band to empty states in the conduction band can also
give rise to low-loss features allowing measurements similar to those
in optical spectroscopy, such as band-gap measurements. Further
information, for example, distinguishing a direct gap from an indirect
gap is available (Rafferty and Brown, 1998). Detailed interpretation of
low-loss features involves careful removal of the ZL, however. More
commonly, the low-loss region is used as a measure of specimen thick-
ness by comparing the inelastically scattered intensity with the inten-
sity in the ZL. The frequency of inelastic scattering events follows a
Poisson distribution, and it can be shown that the sample thickness can
be estimated from
Figure 2–17. A schematic EEL spectrum.
Peter D. Nellist
Chapter 2 Scanning Transmission Electron Microscopy 101
t = Λ ln(I
T
/I
ZL
) (6.2)
where I
T
and I
ZL
are the intensities in the spectrum and zero loss,
respectively, and Λ is the inelastic mean-free path, which has been
tabulated for some common materials (Egerton, 1996).
From 50 eV up to several thousand eV of energy loss, the inelastic
excitations involve electrons in the localized core orbitals on atom sites.
Superimposed on a monatonically decreasing background in this high-
loss region are a series of steps or core-loss edges arising from excita-
tions from the core orbitals to just above the Fermi level of the material.
The energy loss at which the edge occurs is given by the binding
energy of the core orbital, which is characteristic of the atomic species.
Measurement of the edge energies therefore allows chemical identifi ca-
tion of the material under study. The intensity under the edge is pro-
portional to the number of atoms present of that particular species, so
that quantitative chemical analysis can be performed. In a solid sample
the bonding in the sample can lead to a signifi cant modifi cation to the
density of unoccupied states near the Fermi level, which manifests
itself as a fi ne structure (energy loss near-edge structure, ELNES) in
the EEL spectrum in the fi rst 30–40 eV beyond the edge threshold.
Although the interpretation of the ELNES can be somewhat compli-
cated, it does contain a wealth of information about the local bonding
and structure associated with a particular atomic species. For example,
Batson (2000) has used STEM EELS to observe gap states in Si L-edges
that are associated with defects observed by ADF. Beyond the near
edge region can be seen weaker, extended oscillations (extended energy
loss far-edge structure, EXELFS) superimposed on the decaying back-
ground. Being further from the edge onset, these excitations corre-
spond to the ejection of a higher kinetic energy electron from the core
shell. This higher energy electron generally suffers single scattering
from neighboring atoms leading to the observed oscillations and
thereby information on the local structural confi guration of the atoms
such as nearest-neighbor distances.
Clearly EELS has much in common with X-ray absorption studies,
with the advantage for EELS being that spectra can be recorded from
highly spatially localized regions of the sample. The X-ray counterpart
of ELNES is XANES (X-ray absorption near-edge structure), and
EXELFS corresponds to EXAFS (extended X-ray absorption fi ne struc-
ture). There are many examples in the literature (for a recent example
see Ziegler et al., 2004) in which STEM has been used to record spectra
at a defect and the core-loss fi ne structure used to understand the
bonding at the defect.
6.3 The Spatial Localization of EELS Signals and
Inelastic Imaging
The strength of EELS in a STEM is that the spectra can be recorded
with a high spatial resolution, so the question of the spatial resolution
of an EELS signal is an important one. The literature contains several
papers demonstrating atomic resolution EELS (Batson, 1993; Browning
et al., 1993) and even showing sensitivity to a single impurity atom

102
(Varela et al., 2004). The lower the energy loss, however, the more the
EELS excitation will be delocalized, and an important question is for
what excitations is atomic resolution possible.
In addition to the inherent size of the excitation, we must also con-
sider the beam spreading as the probe propagates through the sample.
A simple approximation for the beam spreading is given by (Reed,
1982),
b = 0.198(ρ/A)
1/2
(Z/E
0
)t
3/2
(6.3)
where b is in nanometers, ρ is the density (g cm
−3
), A is the atomic
weight, Z is the atomic number, E
0
is the incident beam energy in keV,
and t is the thickness. At the highest spatial resolutions, especially for
a zone-axis oriented sample, a detailed analysis of diffraction and
channeling effects (Allen et al., 2003a) is required to model the propa-
gation of the probe through the sample. The calculations are similar to
those outlined in Section 5.
Having computed the wavefunction of the illuminating beam within
the sample, we now need to consider the spatial extent of the inelastic
excitation. This subject has been covered extensively in the literature.
Initial studies fi rst considered an isolated atom using a semiclassical
model (Ritchie and Howie, 1988). A more detailed study requires a
wave optical approach. For a given energy-loss excitation, there will be
multiple fi nal states for the excited core electron. The excitations to
these various states will be mutually incoherent, leading to a degree of
incoherence in the overall inelastic scattering, unlike elastic scattering,
which can be regarded as coherent. Inelastic scattering can therefore
not be described by a simple multiplicative scattering function, rather
we must use a mixed dynamic form factor (MDFF), as described by
Kohl and Rose (1985). The formulation used for ADF imaging in Section
5.1 can be adapted for inelastic imaging. Combining the notation of
Kohl and Rose (1985) with (5.7) allows us to replace the product of
transmission functions with the MDFF,
IDAA
S
dd
inel spect
QKKKQ
kk Q
kkQ
KK
() ()
′
()
′
+
()
+
()
+
′
∫∫
∝
*
,
22
(6.4)
where some prefactors have been neglected for clarity and D now
refers to the spectrometer entrance aperture. The inelastic scattering
vector, k, can be written as the sum of the transverse scattering vector
coupling the incoming wave to the outgoing wave, and the change in
wavevector due to the energy loss,
k
e
KK=+−
′
θ
λ
Ez
(6.5)
where e
z
is a unit vector parallel to the beam central axis.
Equations (6.4) and (6.5) show that for a given spatial frequency Q
in the image, the inelastic image can be thought of arising from
the sum over pairs of incoming plane waves in the convergent
beam separated by Q. Each pair is combined through the MDFF
into a fi nal wavevector that is collected by the detector. This is analo-
Peter D. Nellist

Chapter 2 Scanning Transmission Electron Microscopy 103
gous to the model for ADF imaging (see Figure 2–10), except that the
product of elastic scattering functions has been replaced with the more
general MDFF allowing intrinsic incoherence of the scattering
process.
In Section 5.1 we found that under certain conditions, (5.7) could be
split into the product of two integrals. This allowed the image to be
written as the convolution of the probe intensity and an object function,
a type of imaging known as incoherent imaging. Let us examine whether
(6.4) can be similarly separated. In a similar fashion to the ADF inco-
herent imaging derivation, if the spectrometer entrance aperture is
much larger than the probe convergence angle, then the domain of the
integral over K is much larger than that over K′, and the latter can be
performed fi rst. The integral can be then separated thus,
IAAdD
S
d
inel spect
QKKQKK
kk Q
kkQ
K
()
′
()
′
−
()
′
()
+
()
+
∫∫
∝
*
,
22
(6.6)
where the K′ term in k is now neglected. Since this is a product in
reciprocal space, it can be written as a convolution in real space,
I
inel
(R
0
) ∝ |P(R
0
)| 䊟 O(R
0
) (6.7)
where the object function O(R) is the Fourier transform of the integral
over K in (6.5). For spectrometer geometries, D
spect
(K), that collect only
high angles of scatter, it has been shown that this can lead to narrower
objects for inelastic imaging (Muller and Silcox, 1995; Rafferty and
Pennycook, 1999). Such an effect has not been demonstrated because
at such a high angle the scattering is likely to be dominated by combi-
nation elastic–inelastic scattering events, and any apparent localization
is likely to be due to the elastic contrast.
For inelastic imaging, however, there is another condition for which
the integrals can be separated. If the MDFF, S, is slowly varying in k,
then the integral in K′ over the disc overlaps will have a negligible
effect on S, and the integrals can be separated. Physically, this is equiv-
alent to asserting that the inelastic scattering real-space extent is much
smaller than the probe, and therefore the phase variation over the
probe sampled by the inelastic scattering event is negligible and the
image can be written as a convolution with the probe intensity.
We have described the transition from coherent to incoherent imaging
for inelastic scattering events in STEM. Note that these terms simply refer
to whether the probe can be separated in the manner described above,
and does not refer to the scattering process itself. Incoherent imaging
can arise with coherent elastic scattering, as described in Section 5.1. The
inelastic scattering process is not coherent, hence the need for the MDFF.
However, certain conditions still need to be satisfi ed for the imaging
process to be described as incoherent, as described above. An interesting
effect occurs for small collector apertures. Because dipole excitations
will dominate (Egerton, 1996), a probe located exactly over an atom will
not be able to excite transverse excitations because it will not apply a
transverse dipole. A slight displacement of the probe is required for such

104
an excitation. Consequently a dip in the inelastic image is shown to be
possible, leading to a donut type of image, demonstrated by Kohl and
Rose (1985) and more recently by Cosgriff et al. (2005). This can be
thought of as arising from an antisymmetric inelastic object function for
a transverse dipole interaction. With a larger collector aperture, the
transition to incoherent imaging renders the object function symmetric,
removing the dip on the axis.
The width of an inelastic excitation as observed by STEM is therefore
a complicated function of the probe, the energy, and the initial wave-
function of the core electron and the spectrometer collector aperture
geometry. Various calculations have been published exploring this
parameter-space. See, for example, Rafferty and Pennycook (1999) and
Cosgriff et al. (2005) for some recent examples.
6.4 Spectrum Imaging in the STEM
Historically, the majority of EELS studies in the STEM have been per-
formed in spot mode, in which the probe is stopped over the region of
interest in the sample and a spectrum is collected. Of course, the STEM
is a scanning instrument, and it is possible to collect a spectrum from
every pixel of a scanned image, to form a spectrum image. The image
may be a one-dimensional line scan, or a two-dimensional image. In
the latter case, the data set will be a three-dimensional data cube: two
of the dimensions being real-space imaging dimensions and one being
the energy loss in the spectra (Figure 2–18).
The spectrum-image data cube naturally contains a wealth of infor-
mation. Individual spectra can be viewed from any real-space location,
or energy-fi ltered images formed by extracting slices at a given energy
loss (Figure 2–18). Selecting energy losses corresponding to the char-
acteristic core edges of the atomic species present in the sample allows
Figure 2–18. A schematic diagram showing how collecting a spectrum at
every probe position leads to a data cube from which can be extracted indi-
vidual spectra or images fi ltered for a specifi c energy.
Peter D. Nellist