Gupta D. (Ed.). Diffusion Processes in Advanced Technological Materials
Подождите немного. Документ загружается.

discussed above are listed in Table 9.1, which shows reasonably good
agreement among the fitting methods. The table also shows that the
median lifetime t
1
in the first group is about one-third to one-fourth of
those in the second group. The first group of voids grew at the bottom of
the Cu via only and thus required less Cu to be removed compared to the
second group of line/via voids.
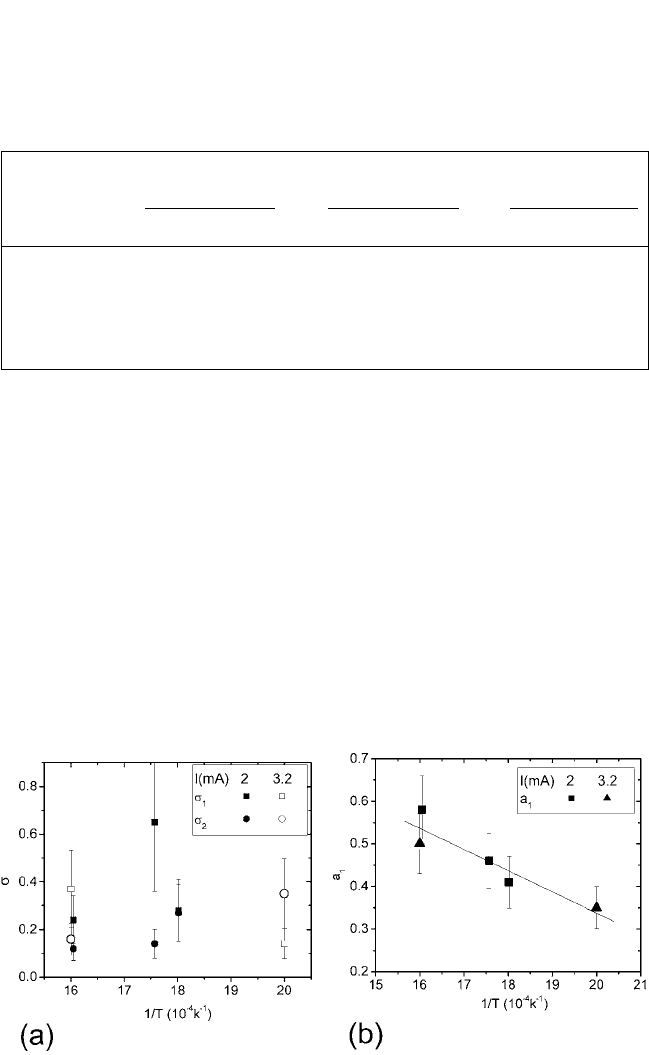
The extracted best fitting parameter values from a least-squares fit are
shown in Fig. 9.24. The first group has a tighter distribution than the sec-
ond group, and a
1
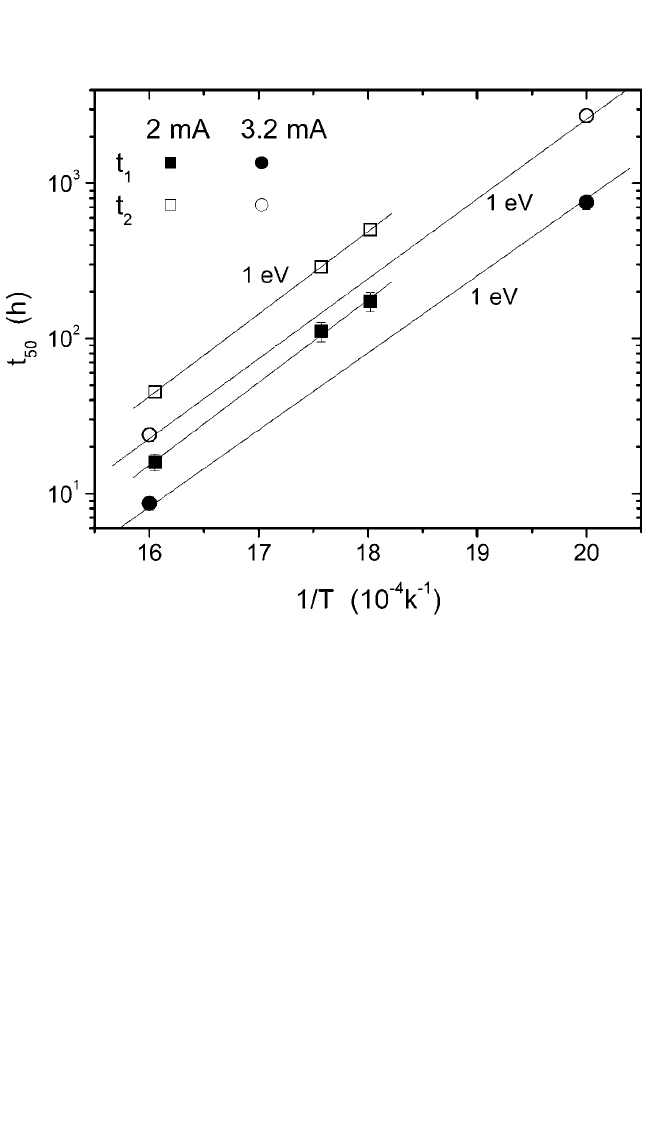
is found to be weakly dependent on T. A similar elec-
tromigration activation energy of 1.0 eV was obtained for both t
1
and t
2
from the data in Fig. 9.25. This indicates a common diffusion mechanism
for both t
1
and t
2
, and diffusion along the Cu/SiN
x
interface, even though
the void location varied for the two populations.
442 DIFFUSION PROCESSES IN ADVANCED TECHNOLOGICAL MATERIALS
Table 9.1. Fitting Parameter Values from the Various Methods
Double
Function
Bimodal (F) Gaussian (f)Two-Probit
Temp (°C) 350 296 350 296 350 296
t
1
(h) 16 111 16 72 17 89
s
1
0.24 0.65 0.34 0.26 0.36 0.47
t
2
(h) 45 289 46 290 45 277
s
2
0.12 0.14 0.16 0.37 0.19 0.19
a
1
0.58 0.46 0.63 0.22 0.63 0.33
Figure 9.24 Values of fitting parameters to log-normal distributions vs. 1/T for (a)
s and (b) a
1
(see also Table 9.1).
Chapter-09 11/29/04 6:50 PM Page 442
ELECTROMIGRATION IN CU THIN FILMS, HUETAL. 443
In summary, the investigation of electromigration in dual-damascene
Cu lines on W has suggested that the dominant diffusion path was the
Cu/SiN
x
interface, not the Cu/Ta interface, in the samples presented in this
section. This was concluded from the similar void growth rate and activa-
tion energy, independent of void location. Furthermore, if the Cu/Ta inter-
face diffusion was the dominant path, the lifetime distribution would have
been more closely represented by a log-normal distribution, not a bimodal
function, since the mass drifted away along the Cu/Ta interface and
caused void formation at the via bottom to be the dominant failure mode.
9.8.2.3 Dual-Damascene Cu Line on Cu Line
Figure 9.26 shows the plot of some normalized line resistance as a
function of time for 0.27-mm-wide lines with a Fig. 9.3(b) test structure
stressed with a current density of 22 mAmm
2
at a sample temperature of
350°C. The dotted curves represent the samples measured with the
Figure 9.25 Plots of median lifetimes vs. 1/T (see also Table 9.1).
Chapter-09 11/29/04 6:50 PM Page 443
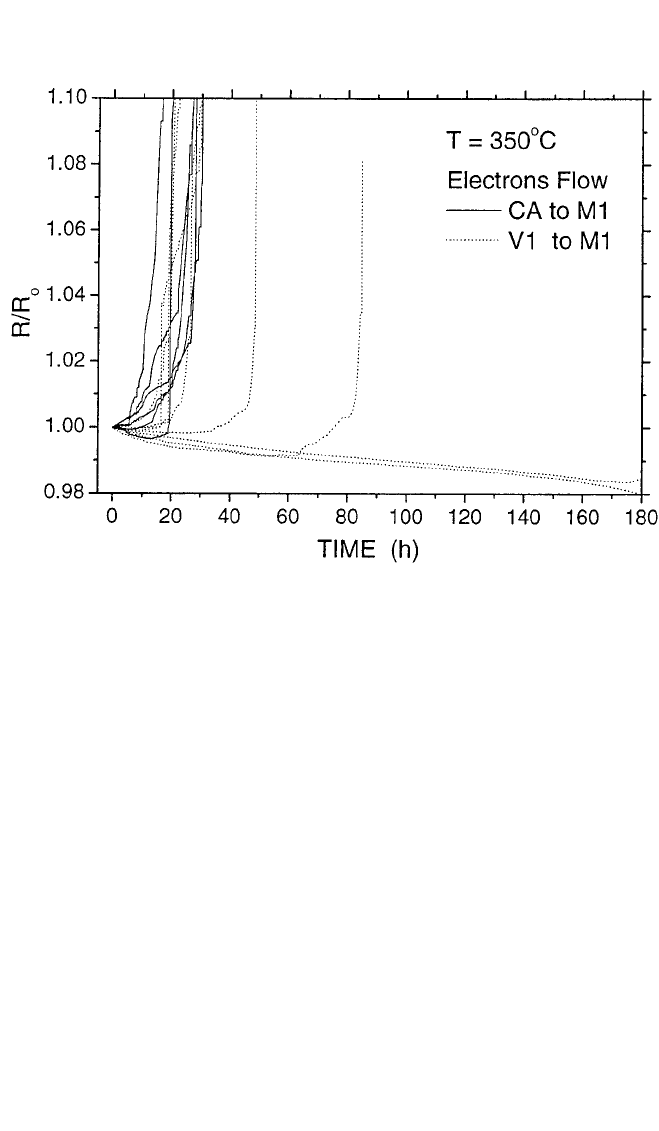
electron flow from dual-damascene Cu M2-V1 to Cu M1 embedded in
SiO
2
. For comparison, the samples tested with electron flow from W CA
to a single-damascene Cu M1 are also plotted (solid curves). There was a
marked difference in failure lifetime between electron flow from CA to
M1 and V1 to M1. However, for both cases, the line resistance initially
decreased slowly, then increased, followed by a period of rapid rise. A
rather tight failure time distribution (t
50
of 26 hours and s of 0.3) was
obtained in the case of CAto M1 electron flow. For the electron flow from
V1 to M1, a wide range of failure times was observed. Only 50% of the
samples in this case had a similar lifetime of around 26 hours, as in the
CA to M1 case. The other 50% of the samples showed a much longer
lifetime, some with no resistance increase even after 180 hours. The
observations of the short- and long-lifetime groups were for all sample
temperatures investigated from 250 to 350°C. The drift velocity or mass
flow of Cu in a Cu M1 line should be identical regardless of the direction
of electron flow. If either end of the M1 line was contacted to a completely
blocking boundary, mass depletion at the cathode end and mass accumu-
lation at the anode end of the line should occur. Thus for the case of
444 DIFFUSION PROCESSES IN ADVANCED TECHNOLOGICAL MATERIALS
Figure 9.26 Line resistance vs.time for a Fig. 9.3(b) test structure at 350°C. Solid
lines represent electron flow from W to Cu lines; dotted lines represent electron
flow from the Cu V1 via to the Cu M1 line.
Chapter-09 11/29/04 6:50 PM Page 444

ELECTROMIGRATION IN CU THIN FILMS, HUETAL. 445
electron flow from a blocking boundary W CA to M1, the void growth
rate in M1 near the W CA should follow Eq. (1). On the other hand, if the
liner at the M1V1 interface were only a partial blocking boundary for
the case of electron flow from V1 to M1, the migration of Cu M1 beneath
the V1 liner could be replenished from V1M2 Cu. Hence a very long
lifetime would result.
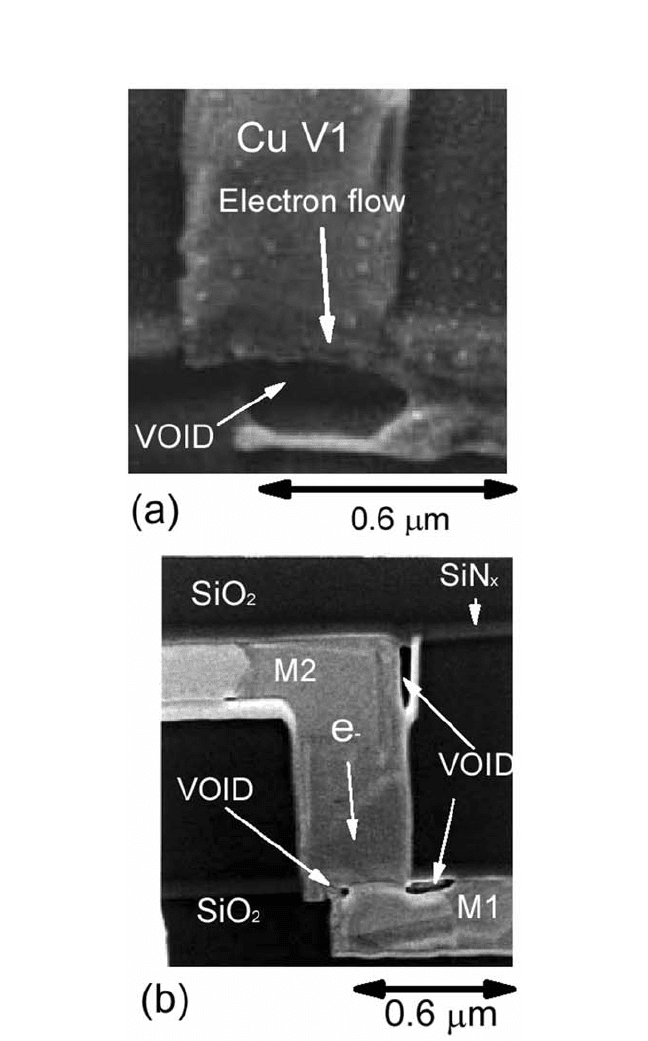
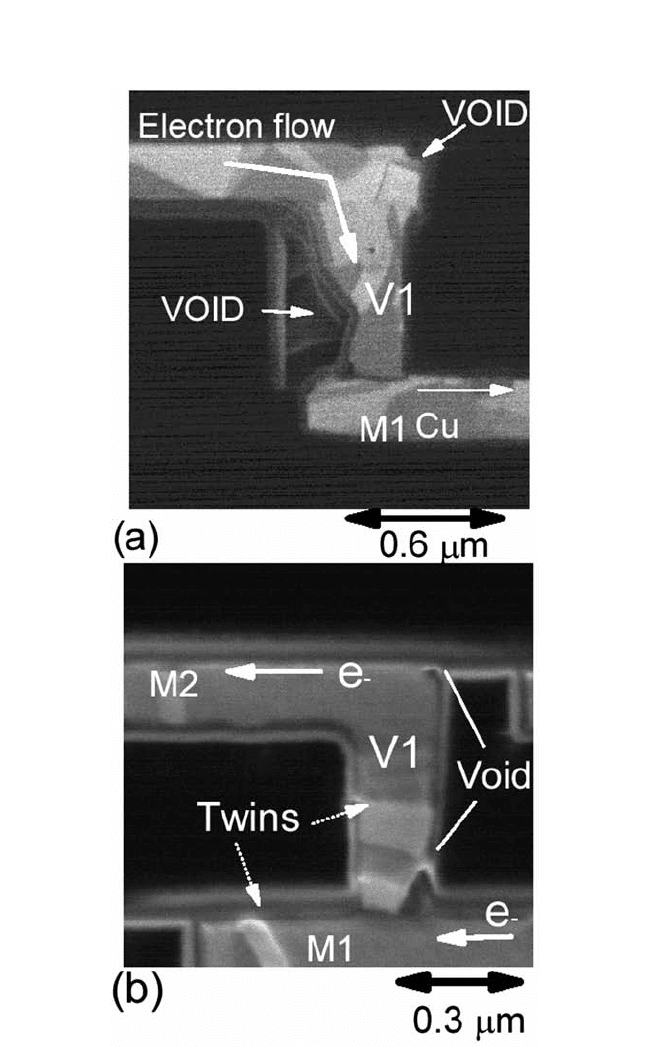
Figure 9.27(a) and (b) shows the SEM images of the two dual-damascene
Cu samples tested at 294°C using a Fig. 9.3(b) test structure and lasting
for 271 and 2200 hours, respectively. The electron flow is from V1 to M1
for both samples. Asharp line resistance increase was observed after test-
ing for 271 hours in the former, but no line resistance increase was
observed in the latter, even though the testing time was about 8 times
longer. Figure 9.27(a) shows that a void grew (edge displacement)
beneath the bottom V1 and beyond the V1 viaM1 line overlapping sec-
tion for the sample tested for 271 hours. This void location resulted in a
sharp resistance increase and caused the line failure, since the current had
to pass through the thin liner to connect the remaining Cu line and via.
The void growth rate obeys Eq. (1) and is consistent with the Cu electro-
migration drift velocity estimated from the samples with a completely
blocking Wboundary. The data suggest that a good diffusion barrier layer
was formed in the sample shown in Fig. 9.27(a). However, two tiny voids
on the surface of a single-crystal M1 near V1 and a void at the end of the
M2 were seen for the sample shown Fig. 9.27(b). This observation sug-
gests that Cu atoms migrating along the Cu M1 top interface were partly
replenished from the M2V1 Cu.
To further explore the electromigration lifetime enhancement due to a
thin liner at the M1V1 interface, the tested samples with long lifetimes
were examined by FIB imaging from cross sections prepared using FIB
milling. Figure 9.28(a) and (b) shows FIB images of the two tested sam-
ples that used the Fig. 9.3(b) and (d) test structures, respectively. The
direction of electron flow is from M2 to V1 to M1 in Fig. 9.28(a) and from
M1 to V1 to M2 in 9.28(b). Both samples were run at 295°C and
j 22 mAmm
2
for more than a thousand hours without an increase in
line resistance. Here M2V1 and M1 under V1 are the anode ends for
Fig. 9.28(a) and (b), respectively. The Cu accumulation and compressive
stress at the anode ends of the lines would occur if the bottom V1 liners
were blocking boundaries. Surprisingly, voids, not hillocks, grew at the
anode end of M2 V1 in Fig. 9.28(a). Moreover, an estimated void size on
the order of 10 mm in M1 under V1 (cathode end at M1) in Fig. 9.28(a)
and in M2 (cathode end at M2) in Fig. 9.28(b) should have been observed
using Eq. (1) and the measured electromigration drift velocity. But no
void was observed at the cathode end of the M1 fine test line in
Fig. 9.28(a), and small voids in V1 and the corner of M2 in Fig. 9.28(b)
Chapter-09 11/29/04 6:50 PM Page 445
446 DIFFUSION PROCESSES IN ADVANCED TECHNOLOGICAL MATERIALS
Figure 9.27 SEM micrographs of the M2/V1/M1 using Fig. 9.3(b) test structures.
The lines were tested for (a) 271 hours and (b) more than 2000 hours without fail-
ing.The arrows show the direction of electron flow.
Chapter-09 11/29/04 6:50 PM Page 446
ELECTROMIGRATION IN CU THIN FILMS, HUETAL. 447
Figure 9.28 FIB images of M2/V1/M1 after electromigration stressing. Test struc-
tures in (a) and (b) are of the type shown in Fig.9.3(b) and (d), respectively.The lines
were tested for more than 1000 hours without failing.The arrows show the direction
of electron flow. Bamboo-like Cu grains with twins in the via and line are shown.
Chapter-09 11/29/04 6:50 PM Page 447

were seen. These results suggest that Cu atoms (or vacancies) actually
moved through the bamboo-like V1 vias, resulting in long t 1000
hours. The voids, shown in the micrographs, were not the cause of the
significant resistance change seen in the electromigration testing, since
the metal line was still connected by high-conductivity Cu. According to
Eq. (2), the drift velocity is mainly determined by the fastest diffusion
path; in this case, Cu atoms drifted along the CuSiN
x
interface (the top
Cu surface) with an electromigration activation energy of about 1 eV. The
depletion of atoms creates voids; thus, voids occurring at the cathode end of
the M1 in Fig. 9.28(b) would be expected. However, the observations
of only small voids in Fig. 9.28(b) for the long test time and the existence
of voids at the anode end of V1 and M2 in Fig. 9.28(a) were surprising.
Here, some voids even grew in regions where there was little electric field
(corners of the M2 lines).
Similar experimental observations of void formation in a metal
section outside of the region carrying current were previously
reported.
[104, 116–118]
This is explained by the following argument. The mass
transport of Cu along the top surfaces of M1 in Fig. 9.28(a) and M2 in
Fig. 9.28(b) generates excess vacancies and tensile stress. The forces
from the large vacancy concentration and stress gradients generate
vacancy flux. The flux moves to vacancy sinks such as interfaces, grain
boundaries, or the ends of the lines, and forms voids. These excess
vacancies migrate easily through the Cu because of their low migration
energy. The failure mechanism is then similar to electromigration in a
single line with large reservoirs at both ends of the line. We can estimate
the time required for vacancies to diffuse through the Cu using the
vacancy diffusivity, D D
o
exp(Q
m
kT), where the pre-factor D
o
0.16
cm
2
/sec and values of the vacancy migration energy Q
m
are reported to be
0.71 eV
[101]
or 0.78 eV.
[84]
The time required for vacancy diffusion at
295°C over a 2-mm diffusion length is estimated to be within one minute.
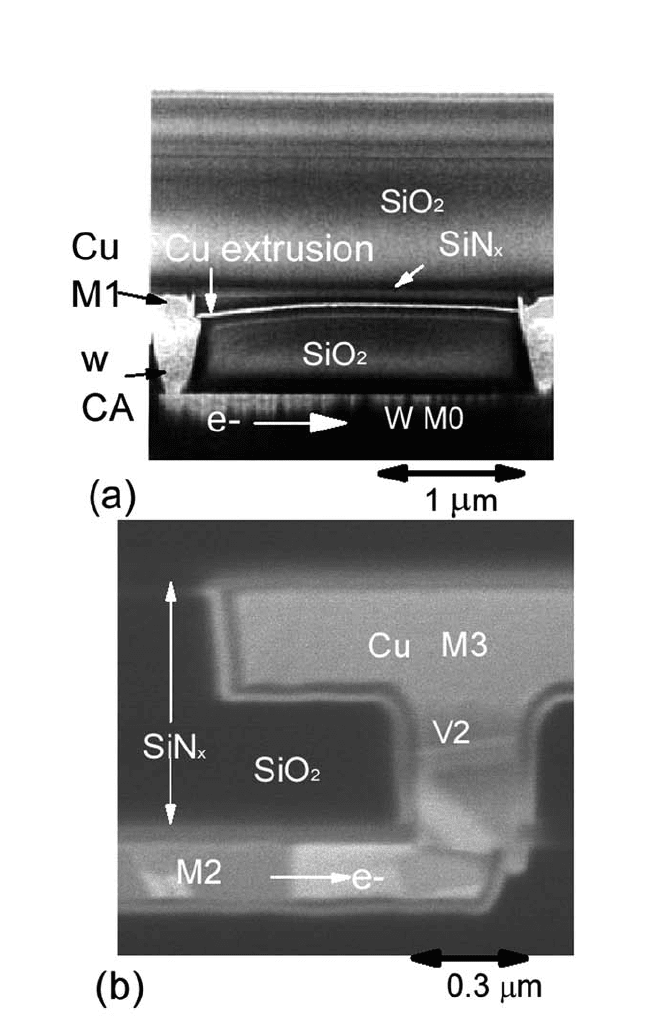
The large Cu mass displacement in the long-lifetime samples can be
clearly seen in Fig. 9.29(a). A huge Cu extrusion occurred at the anode
end of the 0.27-mm-wide M1 line at the blocking WCAwith test structure
Fig. 9.3(b) and electron flow from M1 to W CA. The large compressive
stress (mass accumulation) created by the electromigration driving
force
[50]
cracked the SiO
2
dielectric material and allowed Cu to extrude in
the crack. However, Fig. 9.29(b) shows that no clear extrusion was
observed at the anode end of the M2 line (electrons moving from M2 to
V2) for the samples tested for more than 1000 hours with a Fig. 9.3(c)
test structure. Here, the force from the electromigration-induced
compressive stress appears to be sufficiently large that apparently even
the 10-nm liner could not withstand the constant incoming Cu flux of
j 22 mAmm
2
in a long M2 Cu line.
448 DIFFUSION PROCESSES IN ADVANCED TECHNOLOGICAL MATERIALS
Chapter-09 11/29/04 6:50 PM Page 448
ELECTROMIGRATION IN CU THIN FILMS, HUETAL. 449
Figure 9.29 FIB micrographs of the samples tested for more than 1000 hours
showing the anode ends of (a) M1 and (b) M2. Extrusion caused by a blocking
boundary was observed in (a) but not (b).
Chapter-09 11/29/04 6:50 PM Page 449
As these cases illustrate, the exact condition of the liner at the Cu via
and Cu line interface can strongly influence the lifetime of the tested lines,
even though the electromigration drift velocities are the same in all the
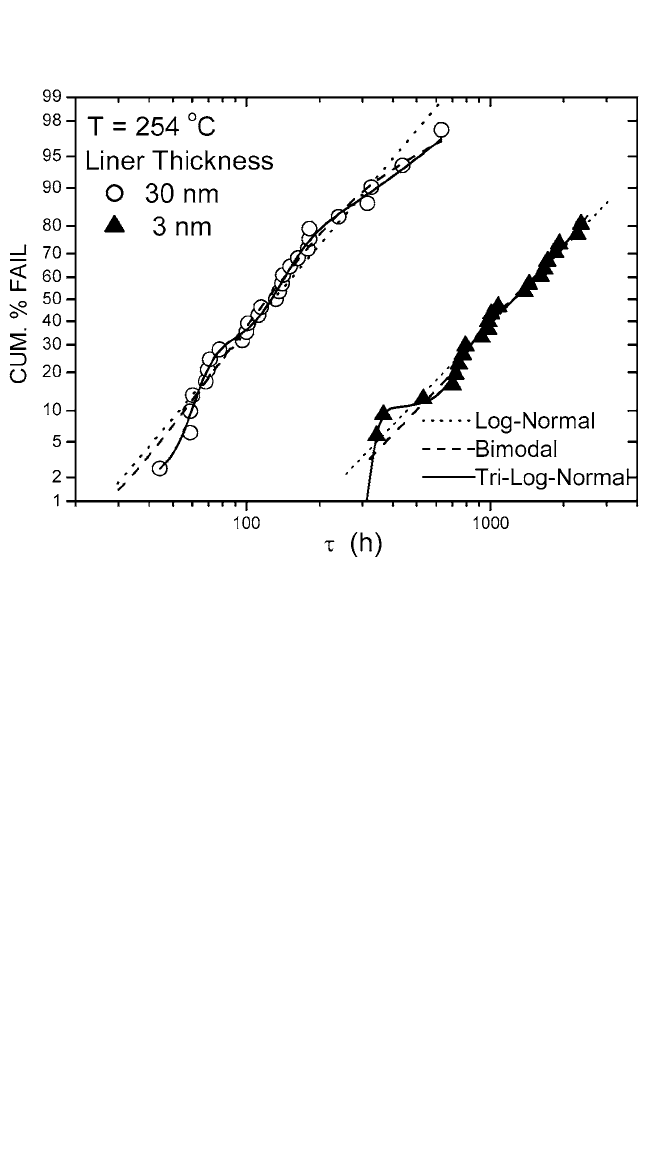
cases. For example, Fig. 9.30 shows a plot of cumulative percent fails as a
function of log (t) using the test structure of Fig. 9.3(c) from two wafers
with two different V1 liner thicknesses: 3 and 30 nm. The electrons flow
from V1 to M2 in both samples. Nonlinear behavior in a log-normal prob-
ability plot was observed. The failure time distributions were analyzed by
log-normal, double-log-normal (bimodal), and triple-log-normal (trimodal)
functions. The cumulative failure distribution for a trimodal, F, is given by
F
e
(ln
2
(
s
t
2
1
t
1
))
2
dlnt e
(ln
2
(
s
t
2
2
t
2
))
2
dlnt
e
(ln
2
(
s
t
3
2
t
3
))
2
dlnt,
(17)
(1 a
1
a
2
)
2ps
3
a
2
2ps
2
a
1
2ps
1
450 DIFFUSION PROCESSES IN ADVANCED TECHNOLOGICAL MATERIALS
Figure 9.30 Plot of cumulative percentage failure vs.log(t ) for the samples using
a test structure shown in Fig. 9.3(c) with 30- and 3-nm-thick liners at the bottom of
V1 with electron flow from V1 to M2. The dotted, dashed, and solid lines are the
least-squares-fitted lines using single log-normal, bimodal, and triple-log-normal
functions, respectively.
Chapter-09 11/29/04 6:50 PM Page 450

ELECTROMIGRATION IN CU THIN FILMS, HUETAL. 451
where t and s are the median times to failure and the deviations, to be
taken with subscripts 1 through 3, for the first, second, and third log-
normal distribution function, respectively. A
1
and A
2
are the amplitude of
the first and second lifetime group, respectively. As discussed in
Sec. 9.8.2.2, the void growth is strongly influenced by partially and com-
pletely blocking boundaries. In addition, voiding in the interconnects
could occur in several ways, such as by interface void, edge displacement
type (vertical void), grain-thinning-type void, and void growth with reser-
voirs. Therefore, data analysis with more than one log-normal distribution
is justified. Anonlinear least-squares method was used to obtain the opti-
mum values of these parameters, by minimizing c
2
. As can be seen in
Fig. 9.30, the data were best fitted using a tri-modal function. The reduced
c
2
n values dropped by a factor of 2 when fitted with a log-normal versus
a tri-modal function, where n is the degrees of freedom. The values for
the best fitting parameters are shown in Table 9.2. The uncertainties in the
median lifetime and s are about 6 to 20% and 30 to 50%, respectively.
The Cu lifetime was enhanced by an order of magnitude when the thinner
liner was used. Table 9.2 shows that the majority of samples fell in the
third lifetime group (longest).
Apparently, the incoming Cu flux from the 5-mm-wide M1 even with
j 1 mAmm
2
generated sufficient electromigration-induced compres-
sive stress under the V1 liner to allow the Cu atoms to punch through the
3-nm-thick V1 liner to M2, but not the 30-nm-thick liner. A completely
blocking boundary at the cathode end of the Cu line seems to be the case
for the 30-nm-thick liner case, and a short lifetime would be expected
when a void forms at the V1M1 interface (bottom of V1). Only a small
void at this interface is required to cause the line to fail [shown in
Fig. 9.31(a)]. In the case of the 3-nm-thick liner, however, the vacancies
in M2 flowing into the V1M1 interface can be filled by Cu atoms from
M1. Hence, Eq. (6) is no longer valid (J
b
is not equal to 0), and Eq. (10)
should be used. Continuous or partial flow at the boundaries will enable a
very long lifetime and eliminate most of the via bottom voids. However,
despite the variation in liner thickness, if vacancies pile up near the end of
the M2 line to reduce stress and vacancy concentration gradients, the
Table 9.2. Best Fitting Parameter Values for a Tri-Log-Normal Function
Obtained from the Data in Fig. 9.30
LinerThickness (nm) t
1
(h) s
1
a
1
t
2
(h) s
2
a
2
t
3
(h) s
3
30 66 0.13 0.23 1237 0.22 0.33 177 0.88
3 339 0.06 0.1 780 0.15 0.19 1679 0.55
Chapter-09 11/29/04 6:50 PM Page 451