Guozhong Cao. Nanostructures & Nanomaterials: Synthesis, Properties & Applications
Подождите немного. Документ загружается.

346
Nanostructures and Nanomaterials
400
500
600 700
Wavelength
nm
2
\,
,
,
,
, , ,
,
, ,
, ,
!a?,l?;OAj
400
500
600
700
800
Wavelength
nm
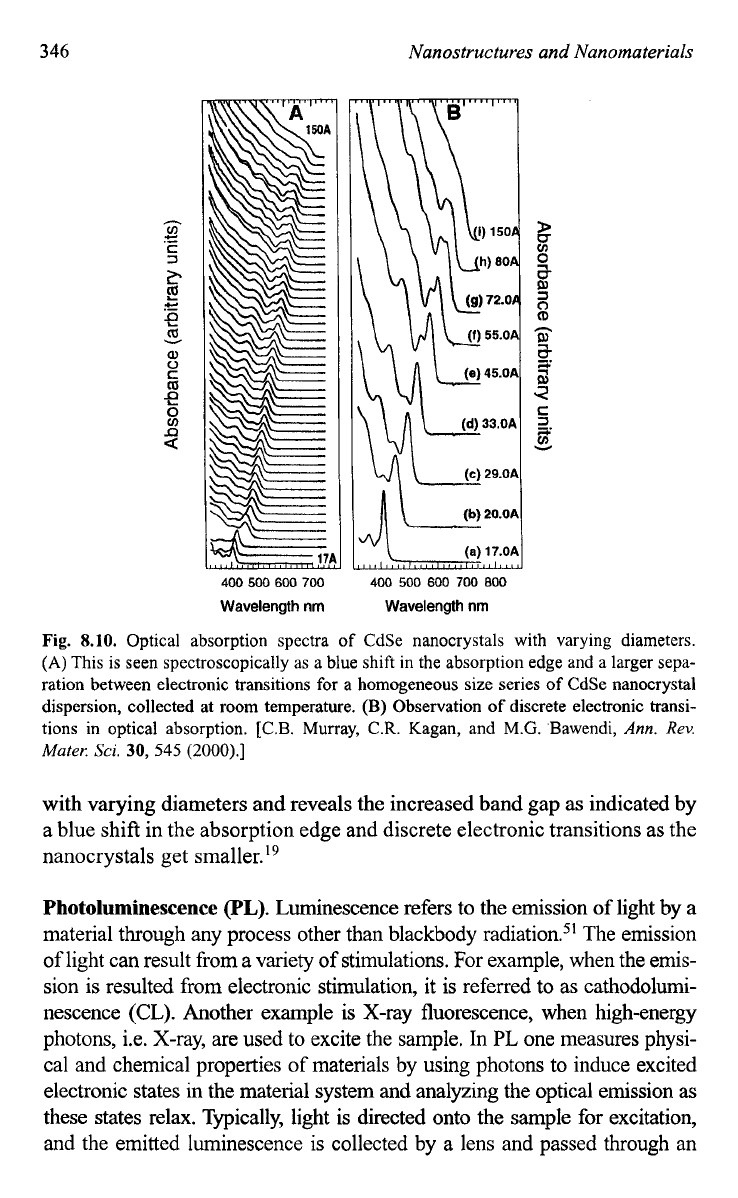
Fig.
8.10.
Optical absorption spectra
of
CdSe nanocrystals with varying diameters.
(A)
This is
seen
spectroscopically as a blue shift in the absorption edge and a larger sepa-
ration between electronic transitions
for
a
homogeneous size series
of
CdSe nanocrystal
dispersion, collected
at
room temperature.
(B)
Observation
of
discrete electronic transi-
tions in optical absorption. [C.B. Murray,
C.R.
Kagan, and M.G. 'Bawendi,
Ann.
Rev.
Muter.
Sci.
30,
545
(2000).]
with varying diameters and reveals the increased band gap as indicated by
a blue shift in the absorption edge and discrete electronic transitions as the
nanocrystals get ~ma1ler.l~
Photoluminescence
(PL).
Luminescence refers to the emission
of
light by a
material through any process other than blackbody radiati~n.~' The emission
of light can result from a variety
of
stimulations. For example, when the emis-
sion
is
resulted from electronic stimulation, it is referred to as cathodolumi-
nescence (CL). Another example is X-ray fluorescence, when high-energy
photons, i.e. X-ray, are used to excite the sample. In
PL
one measures physi-
cal and chemical properties of materials by using photons to induce excited
electronic states in the material system and analyzing the optical emission as
these states relax. Typically, light is directed onto the sample for excitation,
and the emitted luminescence
is
collected by a lens and passed through an
Characterization and Properties
of
Nanomaterials
347
optical spectrometer onto a photon detector. The spectral distribution and time
dependence of the emission are related to electronic transition probabilities
within the sample, and can be used to provide qualitative and, sometimes,
quantitative information about chemical composition, structure, impurities,
kinetic process and energy transfer. Sensitivity is one of the strengths of the
PL technique, allowing very small quantities (nanograms) or low concentra-
tions (parts-per-trillion) of material to be analyzed. Precise quantitative con-
centration determinations are difficult unless conditions can be carefully
controlled, and many applications of PL are primarily qualitative.
In PL, a material gains energy by absorbing photon at some wavelength
by promoting an electron from a low to a higher energy level. This may be
described as making a transition from the ground state to an excited state
of an atom or molecule, or from the valence band to the conduction band
of a semiconductor crystal or polymer (electron-hole creation). The sys-
tem then undergoes a non-radiative internal relaxation involving interac-
tion with crystalline or molecular vibrational and rotational modes, and
the excited electron moves to a more stable excited level, such as the bot-
tom of the conduction band or the lowest vibrational molecular state. After
a characteristic lifetime in the excited state, electron will return to the
ground state. In the luminescent materials some or all of the energy
released during this final transition is in the form of light, in which case
the relaxation is called radiative. The wavelength of the emitted light is
longer than that of the incident light. It should be noted that depending on
the characteristic life-time of emission, fast PL with life-time of submi-
crosecond is also called “fluorescence”, whereas slow ones, lop4 to 10
s,
are referred to as “phosphorescence.”
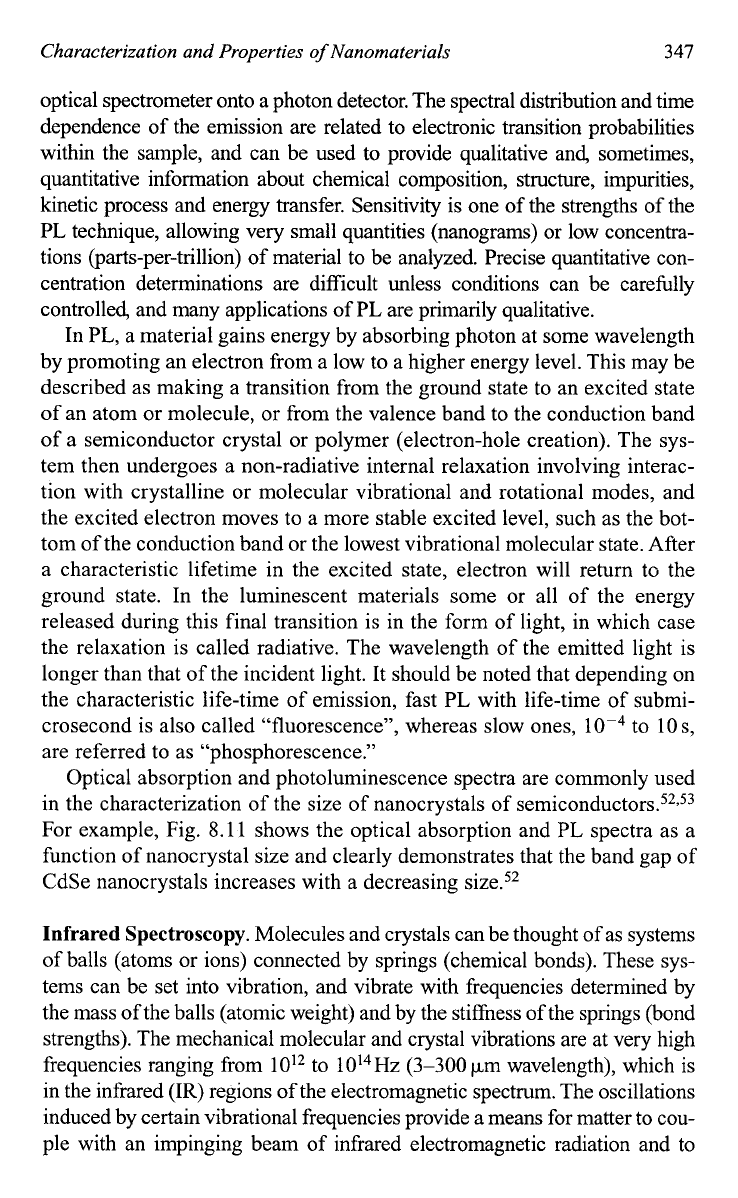
Optical absorption and photoluminescence spectra are commonly used
in the characterization of the size of nanocrystals of
semiconductor^.^^^^^
For example, Fig.
8.11
shows the optical absorption and PL spectra as a
function of nanocrystal size and clearly demonstrates that the band gap of
CdSe nanocrystals increases with a decreasing size.52
Infrared Spectroscopy.
Molecules and crystals can be thought of as systems
of balls (atoms or ions) connected by springs (chemical bonds). These sys-
tems can be set into vibration, and vibrate with frequencies determined by
the mass of the balls (atomic weight) and by the stiffness of the springs (bond
strengths). The mechanical molecular and crystal vibrations are at very high
frequencies ranging from
10l2
to 1Ol4Hz
(3-300
km wavelength), which is
in the infrared (IR) regions of the electromagnetic spectrum. The oscillations
induced by certain vibrational frequencies provide a means for matter to cou-
ple with an impinging beam of infrared electromagnetic radiation and to
34s
Nanostructures and Nanomaterials
J1111.1.11.1.1.111.1.1.
1.5
2.0
2.5
3.0
3.5
Energy
(eV)
Fig.
8.11.
10-K
optical absorption and photoluminescence spectra
of
optically thin and
clear, close-packed nanocrystals
of
CdSe
of
(A)
30.3,
(B) 39.4, (C) 48.0, and
(D)
62.1
A
in diameter. [C.R. Kagan, C.B. Murray, and
M.G.
Bawendi,
Phys.
Rev.
B54,8633
(1996).]
exchange energy with it when the frequencies are in resonance. These
absorption frequencies represent excitations of vibrations of the chemical
bonds
and,
thus, are specific to the type of bond and the group of atoms
involved in the vibration. In the infrared experiment, the intensity of a beam
of infrared radiation is measured before and after it interacts with the sample
as a function of light frequency.
A
plot of relative intensity versus frequency
is the “infrared spectrum.”
A
familiar term
“FTIR’
refers to Fourier
Transform Infrared Spectroscopy, when the intensity-time output of the
interferometer is subjected to a Fourier transform to convert it to the fmil-
iar infrared spectrum (intensity-frequency). The identities, surrounding
environments or atomic arrangement, and concentrations of the chemical
bonds that are present in the sample can be determined.
Raman
spectro~copy~~
is another vibrational technique and differs from
the infrared spectroscopy by an indirect coupling of high-frequency radia-
tion, such as visible light, with vibrations of chemical bonds.55 Raman spec-
trum is very sensitive to the lengths, strengths and arrangements of chemical
bonds in a material, but less sensitive to the chemical composition. When
the incident photon interacts with the chemical bond, the chemical bond is
excited to a higher energy state. Most of the energy would be re-radiated at
Characterization and
Properties
of
Nanomaterials
349
the same frequency as that of the incident exciting light, which is known as
the Rayleigh scattering. A small portion of the energy is transferred and
results in exciting the vibrational modes, and this Raman process is called
Stokes scattering. The subsequent re-radiation has a frequency lower (a
smaller wavenumber) than that of the incident exciting light. The vibrational
energy
is
deducted by measuring the difference between the frequency of
the Raman line and the Rayleigh line. Existing exciting vibrations, e.g.
through thermal activation, can also couple with and add their energies to
the incident beam, which is called anti-Stokes scattering. The resulting
Raman lines appear at higher frequencies
or
larger wavenumbers. The
Stokes and anti-Stokes scattering spectra are mirror images on opposite
sides
of
the Rayleigh line. However, Stokes scattering spectra are mostly
used, since they are less temperature sensitive. The Raman effect is
extremely weak and, thus, intense monochromatic continuous gas lasers are
used as the exciting light. It should be noted that Raman spectroscopy is
more a structural characterization technique than a chemical analysis.
8.3.2.
Electron spectroscopy
In this section we will briefly discuss the basic and methodologies
of Energy Dispersive X-ray Spectroscopy (EDS), Auger Electron
Spectroscopy (AES), and X-ray Photoelectron Spectroscopy (XPS). The
electron spectroscopy relies on the unique energy levels
of
the emission
of
photons (X-ray) or electrons ejected from the atoms in question. As
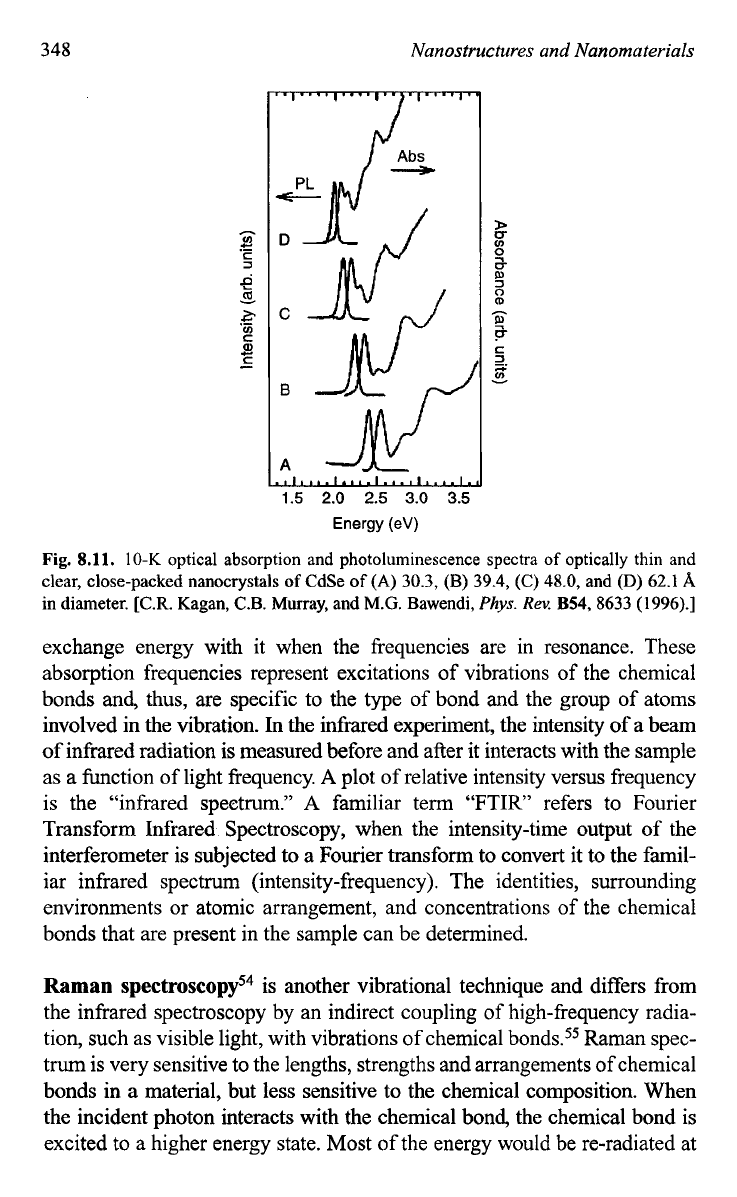
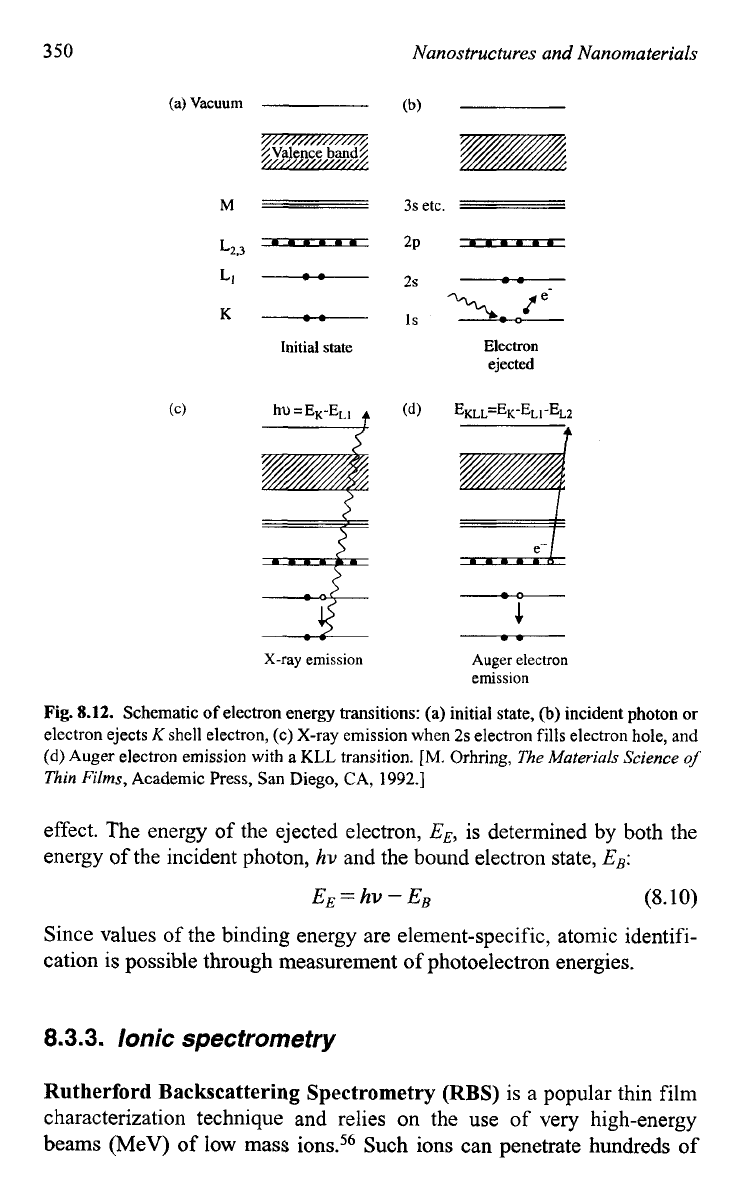
schematically shown in Fig. 8. 12,55 when an incident electron or photon,
such as X-ray or y-ray, strikes an unexcited atom, an electron from an inner
shell is ejected and leaves a hole or electron vacancy in the inner shell (Fig.
8.12b). An electron from an outer shell fills the hole by lowering its energy,
and simultaneously the excess energy is released through either emission
of an X-ray (Fig. 8.12~)~ which is used in
EDS,
or ejection
of
a third elec-
tron that is known as an Auger electron (Fig. 8.12d), from a fiuther outer
shell, which is used in AES. If incident photons are used for excitation, the
resulting characteristic X-rays are known as fluorescent X-rays. Since each
atom in the Periodic Table has a unique electronic structure with a unique
set
of energy levels, both X-ray and Auger spectral lines are characteristic
of
the element in question. By measuring the energies of the X-rays and
Auger electrons emitted by a material, its chemical compositions can be
determined.
A similar discussion is applicable to XPS. In XPS, relatively low-energy
X-rays are used to eject the electrons from an atom via the photoelectric
350
Nunostructures
and
Nunomaterials
(a) Vacuum
M
L2,3
-
LI
-
K-
Initial state
X-ray emission
3s
etc.
2P
-
2s
-
Electron
ejected
-
4
P
Auger
electron
emission
Fig.
8.12.
Schematic
of
electron energy transitions: (a) initial state,
@)
incident photon
or
electron ejects
K
shell electron, (c) X-ray emission when
2s
electron fills electron hole, and
(d)
Auger electron emission with a
KLL
transition.
[M.
Orhring,
The
Materials
Science
of
Thin
Films,
Academic Press, San Diego,
CA,
1992.1
effect. The energy
of
the ejected electron,
EE,
is determined by both the
energy
of
the incident photon,
hv
and the bound electron state,
Es:
EE=
hv-
EB
(8.10)
Since values of the binding energy are element-specific, atomic identifi-
cation is possible through measurement
of
photoelectron energies.
8.3.3.
Ionic spectrometry
Rutherford Backscattering Spectrometry
(RBS)
is a popular thin film
characterization technique and relies on the use of very high-energy
beams (MeV)
of
low
mass ions.56 Such ions can penetrate hundreds
of

Characterization
and
Properties
of
Nanomaterials
35
1
nanometers deep into samples and lose their energies through electronic
excitation and ionization of target atoms. Sometimes, such fast-moving
light ions (usually 4Hef) penetrate the atomic electron cloud shield and
undergo close impact collisions with the nuclei of the much heavier target
atoms. The resulting scattering from the Coulomb repulsion between ion
and nucleus is known as Rutherford Backscattering. This collision is elas-
tic and insensitive to the electronic configuration or chemical bonding
of
target atoms. The energy of the backscattered ion after such a collision,
El,
is solely dependent on the mass,
Mo,
and energy,
Eo,
of the incident ion,
the mass of the target atom,
M,
and the scattering angle,
9,
as given by:
With
known
mass and energy of incident ions and angular position of the
ion detector (typically
170°),
information on the nature of the elements
present, their concentrations and depth distribution can all be simultane-
ously determined by measuring the number and energy of backscattered
incident ions.
Secondary
Ion
Mass
Spectrometry
(SIMS)
is
capable of detecting an
extremely low concentration in a solid, far exceeding any known analyti-
cal
technique^.^^
In SIMS, a source of ions bombards the surface and sput-
ters neutral atoms, for the most part, but also positive and negative ions
from the outermost surface layer. Once in the gas phase, the ions are mass-
analyzed in order to identify the species present as well as determine their
abundance. SIMS can be further distinct as “static” and “dynamic” SIMS.
Static SIMS requires that data be collected before the surface is apprecia-
bly modified by ion bombardment, and is well suited to surface analysis.
Dynamic SIMS is operated with high sputtering rates, and thus enables
depth profiling.
Table
8.1
summarizes the chemical characterization methods of
electron spectroscopy and ionic spectrometry discussed above, and the
Table
8.1.
Summary
of
some chemical characterization techniques.
Method Element Detection Lateral Effective Probe
Sensitivity Limit
(at
%)
Resolution
Depth
SEM/EDS
Na-U
-0.1
-1
pm
-I
pm
AES
Li-U
-0.1
-1
50 nm -1.5nm
XPS
Li-U
-0.1
-1
-1OOkm
-1.5nm
RBS
He-U
-1
1
mm
-20
nm
SIMS
H-U
-
104%
-1
p,m
1.5nm
352
Nanostructures and Nanomaterials
following summarizes the capabilities and limitations of each method as
well as some of the distinctions among these techniques5?
(1)
AES,
XPS
and SIMS are true surface analytical techniques, since the
detected electrons and ions are emitted from surface layers less than
-
1.5 nm deep. Provision is made to probe deeper, or depth profile,
by sputter-etching and continuously analyzing the newly exposed
surfaces.
(2)
AES,
XPS
and SIMS are broadly applicable to detecting almost all the
elements in the Periodic Table, with few exceptions, whereas
EDS
can
only detect elements with
Z>
11
and
RBS
is restricted to only
selected combinations of elements whose spectra do not overlap.
(3)
Only
RBS
is quantitatively precise to within an atomic percent with-
out the use of composition standards.
EDS
is the second better choice
for quantitative analysis of chemical compositions.
AES,
XPS
and
SIMS
all require composition standards for quantitative analysis and
have composition error of several atomic percent.
(4)
XPS,
and to a much lesser extent
AES,
are capable of readily provid-
ing information on the nature of chemical bonding and valence states.
8.4.
Physical
Properties
of
Nanomaterials
Between the dimensions on an atomic scale and the normal dimensions,
which characterize bulk material is a size range where condensed matter
exhibits some remarkable specific properties that may be significantly dif-
ferent from the physical properties of bulk materials. Some such peculiar
properties are known, but there may be a lot more to be discovered. Some
known physical properties
of
nanomaterials are related to different ori-
gins: for example,
(i)
large fraction of surface atoms, (ii) large surface
energy, (iii) spatial confinement, and (iv) reduced imperfections. The
following are just a few examples:
(1)
Nanomaterials may have a significantly lower melting point or phase
transition temperature and appreciably reduced lattice constants, due
to a huge fraction of surface atoms in the total amount of atoms.
(2) Mechanical properties of nanomaterials may reach the theoretical
strength, which are one or two orders of magnitude higher than that of
single crystals in the bulk form. The enhancement in mechanical
strength is simply due to the reduced probability of defects.
(3)
Optical properties of nanomaterials can be significantly different
from bulk crystals. For example, the optical absorption peak of a
Characterization and Properties
of
Nanomaterials
353
semiconductor nanoparticle shifts to a short wavelength, due to an
increased band gap. The color of metallic nanoparticles may change
with their sizes due to surface plasmon resonance.
(4)
Electrical conductivity decreases with a reduced dimension due to
increased surface scattering. However, electrical conductivity of
nanomaterials could also be enhanced appreciably, due to the better
ordering in microstructure, e.g. in polymeric fibrils.
(5)
Magnetic properties of nanostructured materials are distinctly differ-
ent from that of bulk materials. Ferromagnetism of bulk materials dis-
appears and transfers to superparamagnetism in the nanometer scale
due to the huge surface energy.
(6)
Self-purification is an intrinsic thermodynamic property of nanostruc-
tures and nanomaterials. Any heat treatment increases the diffusion
of
impurities, intrinsic structural defects and dislocations, and one can
easily push them to the nearby surface. Increased perfection would
have appreciable impact on the chemical and physical properties. For
example, chemical stability would be enhanced.
Many such properties are size dependent. In other word, properties of
nanostructured materials can be tuned considerably simply by adjusting
the size, shape or extent of agglomeration. For example, the optical
absorption peak,
A,,
of metal particles can shift by hundreds of nanome-
ters and particle charging energies altered by hundreds of millivolts via
particle size and shape.
8.4.1.
Melting points and lattice constants
Nanoparticles of metals, inert gases, semiconductors and molecular crys-
tals are all found to have lower melting temperatures as compared with
their bulk forms, when the particle size decreases below
100
nm. The low-
ering of the melting points is in general explained by the fact that the sur-
face energy increases with a decreasing size. The decrease in the phase
transition temperature can be attributed to the changes in the ratio of sur-
face energy to volume energy as a function of particle size. One can apply
the known methods of phenomenological thermodynamics to systems of
nanoparticles with finite size by introducing the Gibbs model to account
for the existence
of
a surface. Some assumptions are applied to develop a
model or approximation to predict a size dependence of melting tempera-
ture of nanoparticles. The starting assumption is made of the simultaneous
existence of a solid particle, of a liquid particle having the same mass, and
of a vapor phase. The equilibrium conditions are then described based on
3
54
Nanostructures and Nanomaterials
these
assumption^.^^,^^.
The relationship between the melting points of a
bulk material,
T,,
and a particle,
T,
is given by59,60
(8.12)
Where
r,
is the radius
of
the particle,
AH
is the molar latent heat
of
fusion,
and
y
and
p
are surface energy and density, respectively. It should be noted
that the above theoretical description is based on classical thermodynamic
considerations, in which the system dimensions are infinite, which is
obviously inconsistent with the subject of nanoparticles in the range of a
few nanometers. It should also be noted that the model is developed based
on the assumption that nanoparticles all have the equilibrium shape and
are perfect crystals. The equilibrium shape of a perfect crystal is given by
the Wulff relationship6'>62 as discussed in detail in Chapter
2.
However,
small crystal particles are likely to consist of a multiple twinned structure,
which may produce particles with energy less than
a
Wulff crystal. Further
experimental results support that the multiple-twinned crystal particles
possess well-defined and invariant shapes.63@
As
will become clear in the
following discussion, the approximation or the model discussed above has
been found to be in a good agreement with the experimental results,60
regardless of these assumptions.
It is not always easy to determine or define the melting temperature of
nanoparticles. For example, the vapor pressure of a small particle is sig-
nificantly higher than that of bulk counterpart, and the surface properties
of nanoparticles are very different from the bulk materials. Evaporation
from the surface would result in an effective reduction of particle size,
and thus affect the melting temperature. Increased surface reactivity may
promote oxidation of the surface layer and, thus, change the chemical
composition on the particle surface through reactions with surrounding
chemical species, leading to a change
of
melting temperature. However, it
is possible to make an experimental determination of the size dependence
of melting temperature of nanoparticles. Three different criteria have been
explored for this determination: (i) the disappearance
of
the state of order
in the solid, (ii) the sharp variation of some physical properties, such as
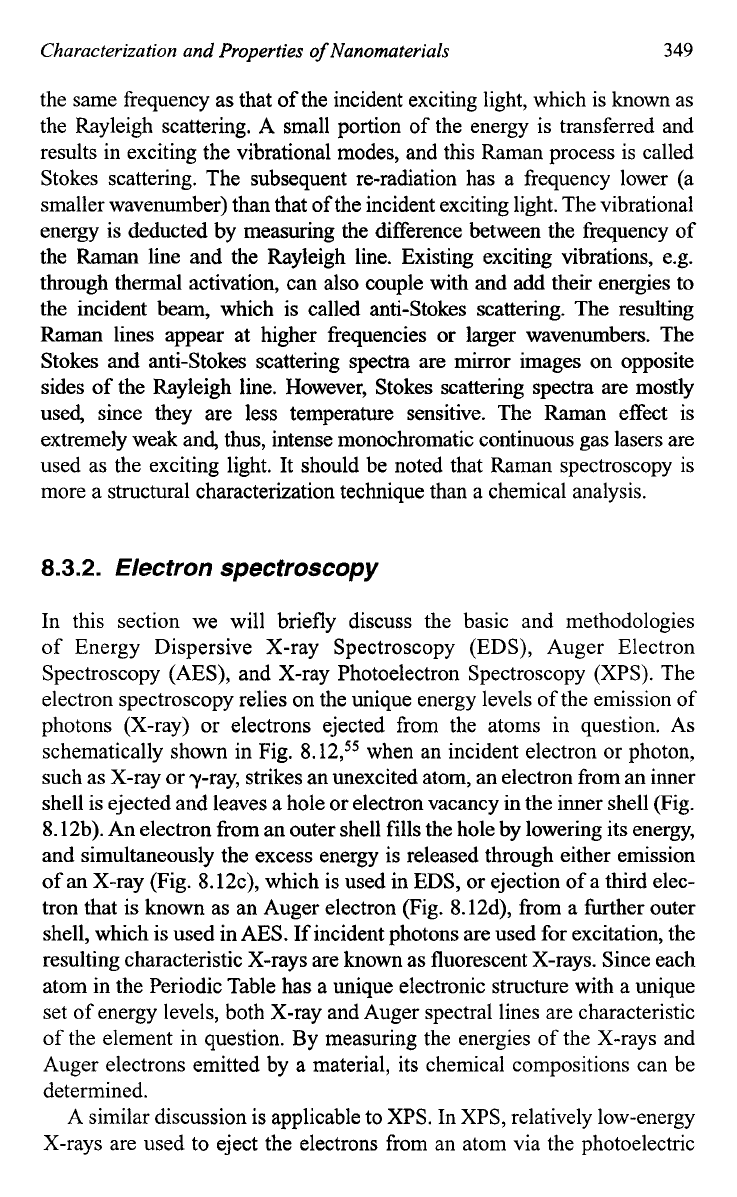
evaporation rate, and (iii) the sudden change in the particle shape.59 The
melting point of bulk gold is of
1337
K
and decreases rapidly for nanopar-
ticles with sizes below 5nm as shown in Fig.
8.13.59
This figure shows
both experimental data (the dots) and the results of a least-squares fits to
Eq.
(8.1)
(the solid line). Such size dependence has also been found
in other materials such as copper,65 tin,66 indium,67 lead and bismuth68 in
the forms of particles and films.
Characterization and Properties
of
Nanomaterials
355
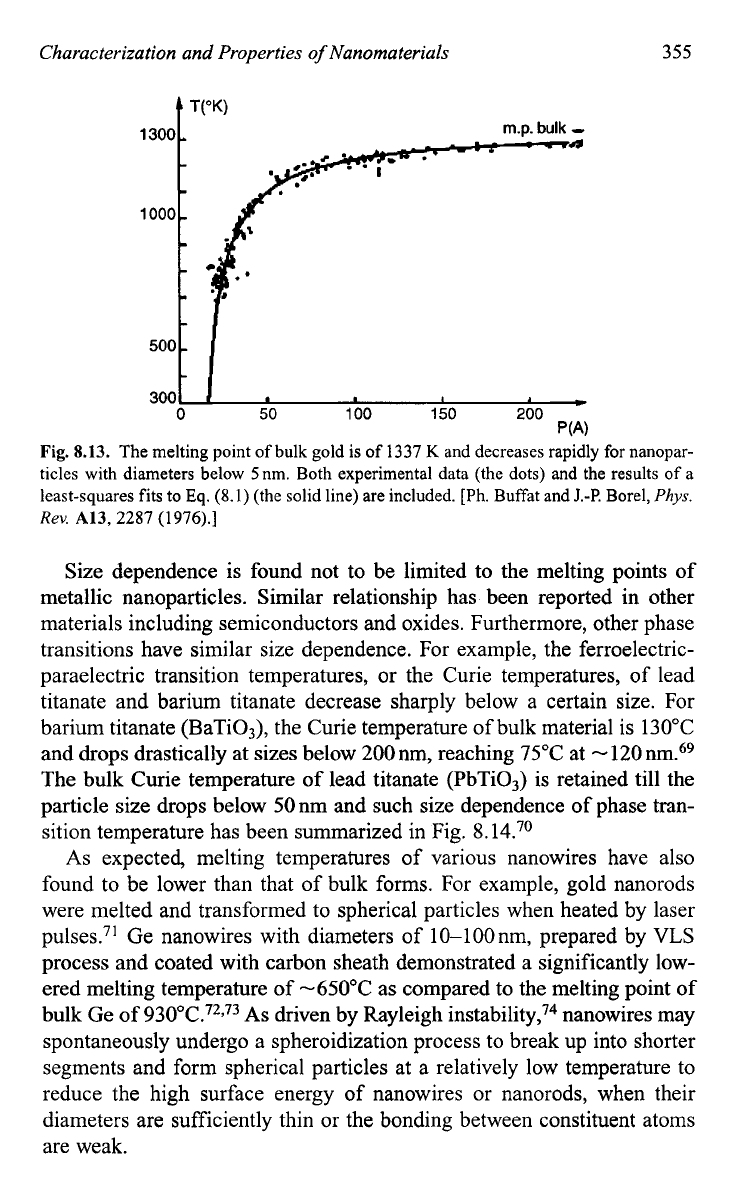
Fig.
8.13.
The melting point
of
bulk gold is of
1337
K
and decreases rapidly for nanopar-
ticles with diameters below 5nm. Both experimental data (the dots) and the results
of
a
least-squares fits
to
Eq.
(8.1)
(the solid line) are included.
[Ph.
Buffat and
J.-P.
Borel,
Phys.
Rev.
A13,
2287
(1976).]
Size dependence is found not to be limited to the melting points
of
metallic nanoparticles. Similar relationship has been reported in other
materials including semiconductors and oxides. Furthermore, other phase
transitions have similar size dependence. For example, the ferroelectric-
paraelectric transition temperatures,
or
the Curie temperatures, of lead
titanate and barium titanate decrease sharply below a certain size. For
barium titanate (BaTi03), the Curie temperature of bulk material is 130°C
and drops drastically at sizes below
200
nm, reaching
75°C
at
-
120
nm.69
The bulk Curie temperature
of
lead titanate (PbTiO,) is retained till the
particle size drops below 50nm and such size dependence
of
phase tran-
sition temperature has been summarized in Fig.
8.
14.70
As
expected, melting temperatures of various nanowires have also
found to be lower than that of bulk forms. For example, gold nanorods
were melted and transformed to spherical particles when heated by laser
pulses.71 Ge nanowires with diameters of lO-lOOnm, prepared by
VLS
process and coated with carbon sheath demonstrated a significantly low-
ered melting temperature
of
-650°C
as compared to the melting point
of
bulk Ge
of
930"C.72*73
As
driven by Rayleigh instabilityY4 nanowires may
spontaneously undergo a spheroidization process to break up into shorter
segments and form spherical particles at a relatively low temperature to
reduce the high surface energy of nanowires or nanorods, when their
diameters are sufficiently thin or the bonding between constituent atoms
are weak.