Ellis,J. Pressure transients in water engineering, A guide to analysis and interpretation of behaviour
Подождите немного. Документ загружается.

flow has the consequence of producing reversed pump rotation as
illustrated in Fig. 21.19.
A stiffer valve sleeve is required to avoid inversion. Increasing the
maximum allowable differential head to in excess of þ80 m to say
100 m produces the desired effect. Figure 21.20 shows velocity changes
at the valve and at chainage 500 m. An oscillation in velocity was
predicted to develop following sleeve closure after about 4.7 s, with
432
Head (mAD)
Time
(
s
)
Series 1
Series 2
Series 3
Series 4
Red valve – longer system: c
v
= 0.08, h
max
= 60.0
60
50
40
30
20
10
0
–10
–20
0.005
0.475
0.946
1.416
1.886
2.357
2.027
3.218
3.768
4.218
4.749
5.109
5.650
6.120
6.590
7.061
7.581
8.002
8.472
8.942
9.413
9.883
10.354
10.824
11.294
11.765
12.285
12.706
13.176
13.646
14.117
14.587
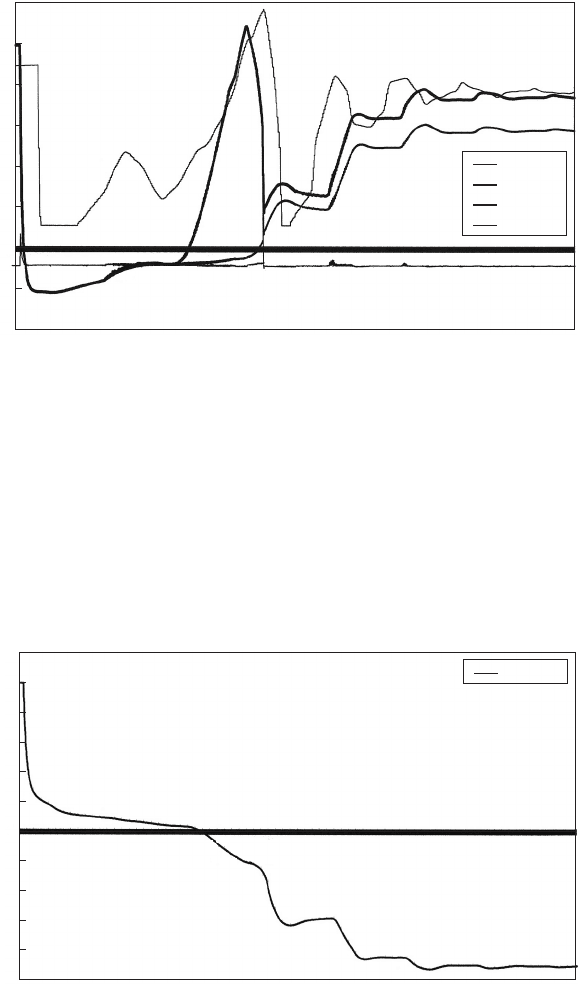
Fig. 21.18. Head at failing sleeve valve after pump trip
Pump speed/design speed
Time (s)
Series 1
Red valve – longer system: c
v
= 0.08, h
max
= 60.0
0.005
0.480
0.955
1.431
1.906
2.381
2.857
3.332
3.807
4.283
4.758
5.233
5.708
6.184
6.659
7.134
7.610
8.085
8.560
9.036
9.511
9.986
10.461
10.937
11.412
11.887
12.363
12.838
13.313
13.789
14.264
1.2
1.0
0.8
0.6
0.4
0.2
0.0
–0.2
–0.4
–0.6
–0.8
–1.0
Fig. 21.19. Pump speed for sleeve valve failure
Pressure transients in water engineering
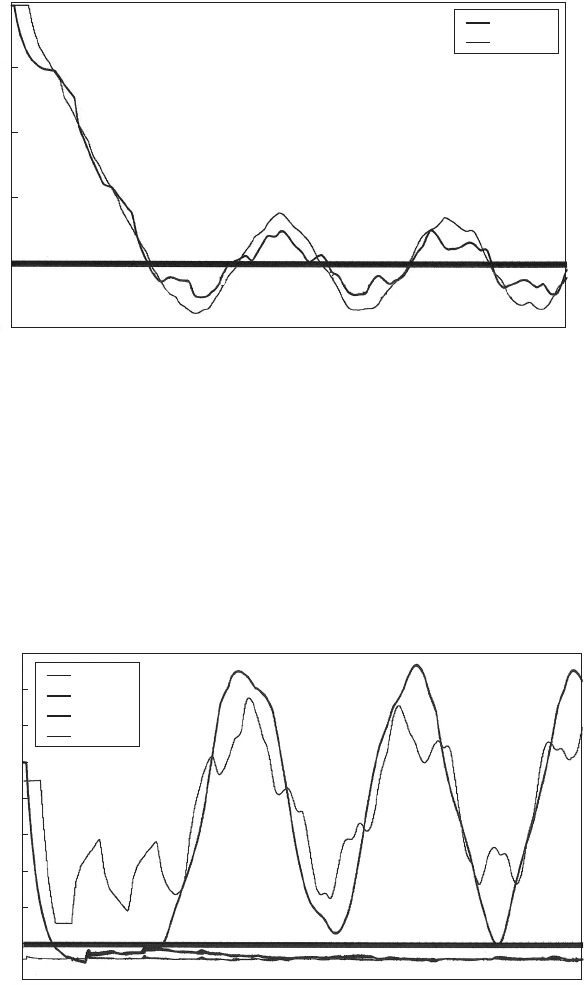
this oscillation taking place around the zero flow condition. A similar
velocity variation occurs at the valve inlet and with no continuous
reversed flow there is no motivation for reversed pump rotation to
occur. The predicted oscillation was due to substantial deformation of
the sleeve. Under the action of transient effects within the pipeline,
only a 10 litre margin remains before inversion could occur. Head
changes are shown in Fig. 21.21, with peak head of þ75 m at the
433
Velocity (m/s)
Time (s)
Series 1
Series 2
Red valve – longer system: c
v
= 0.08, h
max
= 100.0
0.005
0.603
1.200
1.798
2.396
2.994
3.592
4.189
4.787
5.385
5.983
6.581
7.178
7.776
8.374
8.972
9.570
10.167
10.765
11.363
11.961
12.559
13.156
13.754
14.352
14.950
15.548
16.145
16.743
17.341
17.939
18.537
2
1.5
1
0.5
0
–0.5
Fig. 21.20. Velocity variation at sleeve valve in longer pipeline
Head (mAD)
Time (s)
Series 1
Series 2
Series 3
Series 4
Red valve – longer system: c
v
= 0.08, h
max
= 100.0
0.005
0.612
1.220
1.818
2.430
3.043
3.650
4.258
4.866
5.473
6.081
6.688
7.296
7.904
8.511
9.119
9.726
10.334
10.942
11.549
12.157
12.764
13.372
13.080
14.587
15.195
15.802
16.410
17.018
17.625
18.233
18.840
80
70
60
50
40
30
20
10
0
–10
Fig. 21.21. Head variations at sleeve valve in longer pipeline
Check valve characteristics
valve outlet. A large oscillation was predicted following deceleration of
the reversed velocity.
It should be noted that use of a sleeve which allows inversion to occur
may produce lower system pressures generally than when a stiffer sleeve
is used which prevents inversion. However, the inverted sleeve is liable
to suffer damage and there is the matter of inverse pump rotation to
consider.
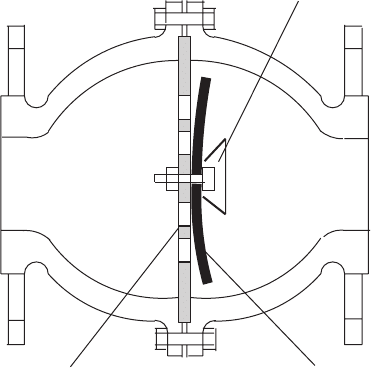
21.11 Membrane valve
The closing system for this type of valve is in the form of a flexible
membrane (Fig. 21.22). During flow the membrane deforms and is
held at its centre on a perforated seat. On flow reversal, the mem-
brane is held against a fixed diaphragm, usually of coated steel. The
diaphragm has openings of area approximating the pipe area. The
thickness and elasticity of the membrane can allow progressive open-
ing and closing, rendering this valve suitable for pulsating operation
or in systems having variable flow pumps. Closure is not dependent
upon gravity and so the valve can be used in all positions. The
valve may be considered for use in circumstances where deceleration
is rapid.
434
Perforated steel seat
Flexible membrane
Steel coated grill
Fig. 21.22. Membrane valve
Pressure transients in water engineering
21.12 Prediction of valve behaviour
The variety of valve designs makes it impossible to have a standard
approach to assessment of valve behaviour. Damped valves and the
sleeve or duckbill valve can be studied by including the valve as part
of the pipeline system into which the valve is intended to be installed.
However, other valves of the free-acting type are amenable to having
their closure performance presented in the form of charts which are
independent of any specific pipeline system. This section describes
closure behaviour for a range of valve types. Many valves remain
unknown in terms of their dynamic performance and even a relatively
modest change in a documented valve’s configuration can produce a
significant change in its performance.
The potential for many patterns of check valve to produce shock
pressures following a delay in valve closure has been long recognised
and extensive studies have been undertaken to improve valve design.
As early as 1954, Livingston described studies undertaken by Glenfield
and Kennedy which included measurements of the hydraulic moment
acting on swing check and tilting disk valve patterns. These studies
led to the development of the ‘recoil’ valve. The year 1959 saw con-
siderable activity in studying check valve performance with Whiteman
and Pearsal measuring closure behaviour of swing check valves at
Kingston Power Station; Worster (1959) and also Esleek and Rosser
(1959) proposed means of calculating dynamic response of a reflux
valve door in a decelerating and reversing water column. In 1962
Pool et al. used a modification of the work of Esleek and Rosser and
produced good agreement between prediction and observation of
valve closure motion. Confidence in their model was sufficiently high
for it to be used in the analysis of check valve performance in both
thermal and nuclear power plants. During his 1965 studies, Parmley
used the techniques developed by Pool et al. to predict response of
swing-check valves, Recoil valves and tilting disk valves under reflux
conditions. His predictions showed good agreement with observations
obtained from a transient test facility constructed by Glenfield and
Kennedy. Despite these studies, problems associated with check
valves continued to occur and in his opening address to the second
Conference on Pressure Surges in 1976, Lupton (1976) appealed for
further research and development into check valves and suggested
that up to 50% of waterhammer incidents could be attributed to this
source. Since his address, numerous studies, both experimental and
numerical, have been undertaken and dynamic closure performance
of a large number of valve patterns has now been quantified. Despite
435
Check valve characteristics
the research into valve behaviour, incidents of unacceptable valve
performance still continue to occur.
Model testing plays an essential role in quantifying dynamic perfor-
mance of check valves and around the world test facilities have been
constructed which allow a check valve to be subject to varying decelera-
tion rates in order to establish how that valve will respond over a range
of operational circumstances. An early example was that of Glenfield
and Kennedy and among later installations were those of CEGB at
Marchwood in England and Delft Hydraulics. Delft laboratory has
been especially active in examining different valve patterns and in
working to establish a means of presentation for test results. By testing
different patterns of valve in this way, the relative merits of each valve
can be gauged and appropriate limits of operation, in terms of allowable
gradient jdV=dtj, defined. In the absence of information on dynamic
performance, check valves have often been selected on the basis of
price and availability. However, increasingly engineers are specifying
the need for ‘non-slam’ performance. ‘Slam’ refers to the noise gener-
ated on closure and is a function of the dynamic response of the
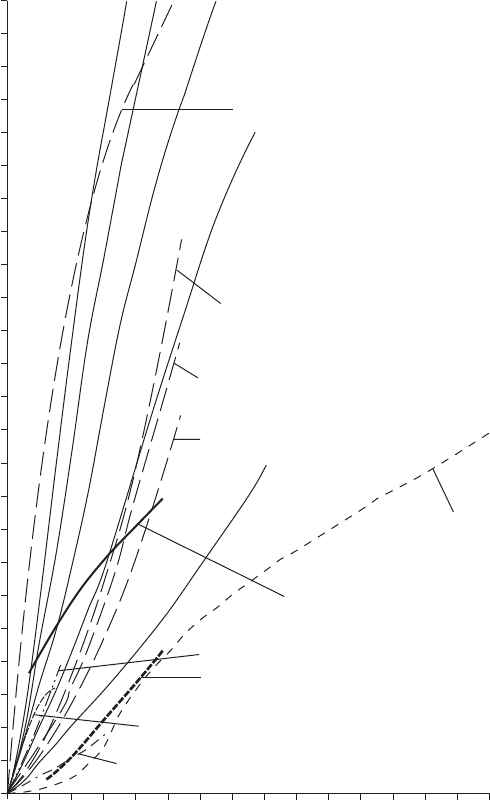
valve. However, valves come in a range of sizes. Take, for example,
the popular ‘split-disk’ type. This may be obtained in diameters ranging
from 40 mm to 1800 mm. Dynamic closure performance deteriorates
with increasing diameter and so a means of extrapolating findings
from tests on one valve size to a geometrically similar family of valve
diameters is required. Further complications may also arise, for instance
from a range of spring stiffnesses, or different properties of lever, weight
and lever/door angle, all of which can significantly alter the dynamic
response of a valve. Mathematical modelling has a role to play by
allowing a diameter of valve which has been tested to be treated as a
model for other valve sizes.
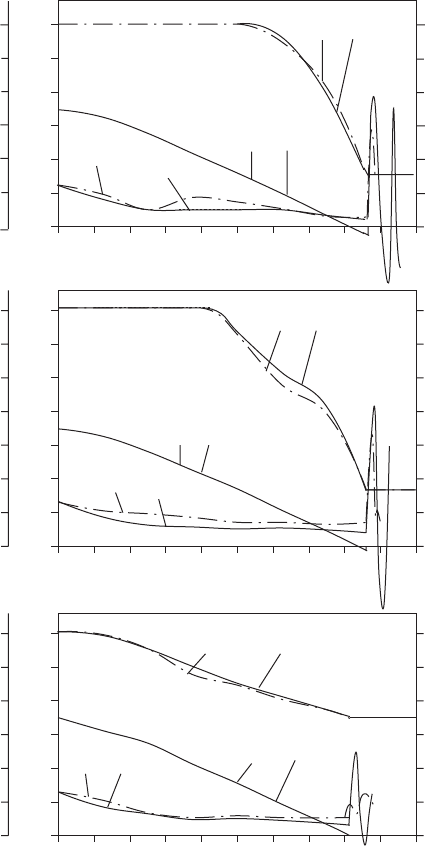
Before any reliance can be placed upon computational models, the
predictions must be compared with observations. Figure 21.23 shows
some typical comparisons between model predictions and laboratory
measurements for Glenfield Valves of the swing check, tilting disk
and recoil patterns. These valves were all installed in a horizontal pipe-
line. In this figure, H is the pressure head just downstream of the check
valve, is the valve door angle measured from the vertical and V is the
velocity of flow in the pipe at the check valve. The subscript ‘m’ denotes
measured valves and subscript ‘c’ indicates a computed value.
A convenient means of presentation for many but not all valve types,
is to plot deceleration gradient jdV=dtj against the reversed velocity V
r
at the time of valve closure. Results both directly from physical testing
436
Pressure transients in water engineering
and supplemented by computational predictions have been presented
for different valve types. In any specific pipeline investigation, the
value of deceleration gradient jdV=dtj will be obtained from hydraulic
transient investigation. Entering the curve at the appropriate point
437
60
50
40
30
20
10
0
60
50
40
30
20
10
0
60
50
40
30
20
10
0
60
50
40
30
20
10
0
70
60
50
40
30
20
10
0
70
60
50
40
30
20
10
0
6
5
4
3
2
1
0
6
5
4
3
2
1
0
7
6
5
4
3
2
1
0
0 0.2 0.4 0.6 0.8 1.0 1.2 1.4 1.6 1.8 2.0
0 0.2 0.4 0.6 0.8 1.0 1.2 1.4 1.6 1.8 2.0
0 0.2 0.4 0.6 0.8 1.0 1.2 1.4 1.6 1.8 2.0
Swing check DN 225
H (m) q (deg) V (m/s)
H (m) q (deg) V (m/s)
H (m) q (deg) V (m/s)
Tilting disk DN 225
Recoil valve DN 225
H
m
H
c
H
m
H
c
H
m
H
c
V
m
V
c
V
m
V
c
V
m
V
c
q
m
q
c
q
m
q
c
q
m
q
c
Fig. 21.23. Measured and computed behaviour at closing check valves
Check valve characteristics
along the horizontal j dV=dtj axis using the gradient obtained by
analysis, the intercept with the appropriate curve is obtained and the
value of reversed velocity V
r
at closure is found.
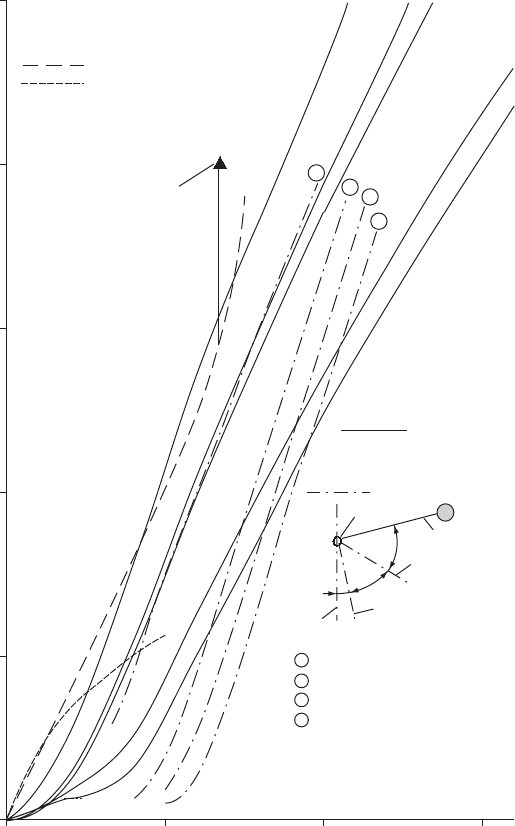
Figure 21.24 shows results from studies of swing check valves of
differing patterns. The Keystone Figure 85 is a wafer type with a seating
438
2.5
2.0
1.5
1.0
0.5
0.0
0 5 10 15
Magnitude of reversed velocity at closure (m/s)
DN 100 Delft hydraulics data
Keystone Fig. 85 DN 200
Delft hydraulics data
Effect of shifting centre of
gravity of valve door
400
300
200
250
150
1
Glenfield M1
Glenfield M1 DN 225
Deceleration
g
radient |dV/dt|
(
m/s
2
)
Lever length 508 mm
Vertical
1 Initial velocity 1.6 m/s no wt.
2 Initial velocity 2.7 m/s 44.53 N
3 Initial velocity 3.1 m/s 66.8 N
4 Initial velocity 3.5 m/s 92.5 N
Seat angle 16.1∞
Weighted lever
Fully open door position
40∞
44∞
Pivot
2
3
4
Fig. 21.24. Performance curves for swing-check valves
Pressure transients in water engineering
angle close to the vertical when installed in a horizontal pipeline. By
contrast, the Glenfield M1 has a seating angle 16.18 from the vertical
in a similar installation and a 448 angle of turn to the full open position.
A spread in performance results from differences in size, opening angle
and seating angle. Valve performance deteriorates as opening angle
increases. Door weight and other factors such as a lever and weight
may also influence closure performance. When a lever and weight are
added (curves 2—4), the performance is improved for lower deceleration
rates up to around 6 m/s
2
but for steeper rates of retardation the effect of
additional inertia caused by the weighted lever produces deterioration
in performance. In one of many tests Provoost (1980) moved the
centre of gravity of the check valve towards the pivot and measured
a deterioration in performance as shown in the figure. Application of
swing check valves will usually be restricted to modest deceleration
gradients unless special measures are introduced such as damping of
439
Magnitude of reversed velocity at closure (m/s)
Deceleration
g
radient |dV/dt|
(
m/s
2
)
2.0
1.5
1.0
0.5
0
0 5 10 15
Glenfield tilting disk
DN 225
Glenfield recoil
series 5100
DN 600 recoil type
DN 300
DN 250
DN 200
DN 150
DN 100
Fig. 21.25. Performance curves for Glenfield recoil and tilting disk valves
Check valve characteristics
valve movement. A maximum reversed velocity <1.0 m/s would seem
reasonable.
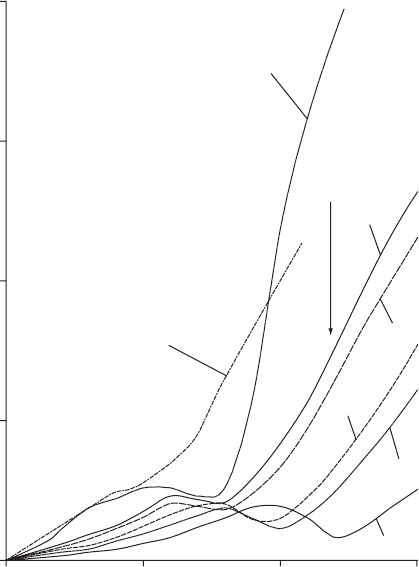
The recoil type of valve represents a derivation of the swing check,
with a considerable improvement in performance (Fig. 21.25). The
curves shown are a combination of findings from both measurements
and computer simulations. Performance deteriorates with size, possibly
for the same reason as for the swing check with lever and weight.
Deceleration gradients of 10 m/s
2
or more are considered acceptable
without risk of valve slam.
Also contained in Fig. 21.25 are limited data for the Glenfield tilting
disk valve DN 225. Performance of this valve is not as good as the recoil
type but has been designed to fulfil a different function.
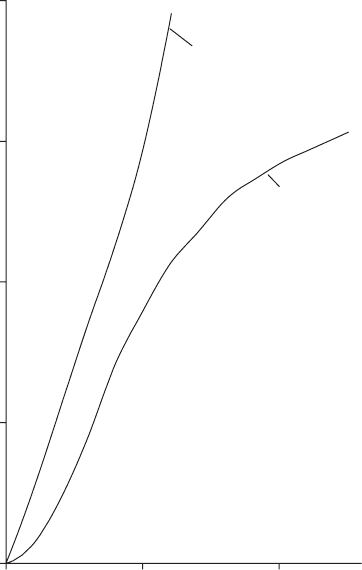
Measurements from the test facility at Delft Hydraulics on the
moving ball type valve, reported by Provoost (1980, 1983), are shown
in Fig. 21.26. Closure performance is relatively poor, with substantial
440
Magnitude of reversed velocity at closure (m/s)
Deceleration
g
radient |dV/dt| (m/s
2
)
2.0
1.5
1.0
0.5
0
0 5 10
DN 200
from Delft hydraulics data
DN 100
from Delft hydraulics data
Fig. 21.26. Performance of moving ball valves
Pressure transients in water engineering
reversed velocity at closure attained with deceleration gradients
<5 m/s
2
. While other valves show a deterioration in performance
with increasing size, the curves in Fig. 21.26 show an improvement
for the large valve tested. It may be expected that ball weight and
rolling friction play some part in determining closure time, or some
441
Magnitude of reversed velocity at closure (m/s)
Deceleration
g
radient |dV/dt|
(
m/s
2
)
2.4
2.3
2.2
2.1
2.0
1.9
1.8
1.7
1.6
1.5
1.4
1.3
1.2
1.1
1.0
0.9
0.8
0.7
0.6
0.5
0.4
0.3
0.2
0.1
0.0
0 2 4 6 8 10 12 14 16 18 20 22 24 26 28 30
Duo-chek DN 200, strong springs
Gestra BB16 DN 200 weak spring
Valve open at velocity = 0.5 m/s
Duo-chek DN 150 vertically upward flow
Duo-chek DN 200 weak springs
Gestra BB16 DN 200
super-strong springs
Valve open at velocity = 4.8 m/s
1 broken spring
Duo-chek DN 150
DN 150
Duo-chek DN 225
spring stiff = 0.01 Nm/deg
Duo-chek DN 225
spring stiff = 0.0 Nm/deg
Duo-chek DN 225
spring stiff = 0.012 Nm/deg
Duo-chek DN 225
spring stiff = 0.016 Nm/deg
DN 750
DN 600
DN 300
DN 450
Fig. 21.27. Performance of split-disk valves
Check valve characteristics