Das Sh.P. Statistical Physics of Liquids at Freezing and Beyond
Подождите немного. Документ загружается.

A3.1 The schematic model for nucleation 161
Both of the above two solutions for ψ
in
and ψ
out
are equal to ψ
c
at r =r
c
. In addition,
for continuity of the solution we require that the derivative dψ/dr is also continuous at
r =r
c
, i.e.,
dψ
in
dr
*
*
*
*
r=r
c
=
dψ
out
dr
*
*
*
*
r=r
c
. (A3.1.6)
Upon applying this condition on the two solutions, we obtain a key relation linking ψ
c
to ψ
s
,
ψ
c
= ψ
s
1 −r
−1
c
tanh r
c
1 +¯ν tanh r
c
. (A3.1.7)
The boundary r =r
c
therefore is a marker for the crystalline phase in this case and is a
natural identification of the radius of the critical nucleus corresponding to the condition
(3.2.2).From(A3.1.4) it follows that ψ
in
(0) →ψ
s
, i.e., the order parameter at the center
of the nucleus approaches the bulk-solid value.
A3.1.2 The free-energy barrier
The free energy for the formation of the critical nucleus relative to the liquid is computed
in the present schematic model as
NC
= 4π
∞
0
dr r
2
ω[ψ(r, t)]+
|∇ψ(r, t)|
2
2
, (A3.1.8)
where the subscript “NC” refers to a nonclassical quantity to distinguish it from the corre-
sponding quantity in the CNT. On integrating the second term on the RHS of (A3.1.8) by
parts we obtain
NC
= 4π
∞
0
r
2
dr
ω[ψ(r )]−
ψ(r)
2
∇
2
ψ
. (A3.1.9)
Using eqn. (3.2.9) for the second derivative of the order-parameter field ψ, we obtain
NC
= 4π
∞
0
dr r
2
ω[ψ(r )]−
ψ(r)
2
dω
dψ
. (A3.1.10)
Integration using the expressions for ω in the inner (r < r
c
) and outer (r > r
c
) regions as
given by (3.2.5) gives the result
NC
= 4π
r
c
0
dr r
2
λ
s
2
(ψ − ψ
s
)
2
+
T
−
λ
s
2
(ψ − ψ
s
)ψ
=
4πr
c
3
3
T
− 2πλ
s
ψ
s
r
c
0
dr r
2
[
ψ − ψ
s
]
. (A3.1.11)
In writing the last equality we have used the fact that for the r > r
c
part of the integral
in the second term on the RHS of (A3.1.11) the expression (3.2.5) for ω(ψ) produces a
162 Appendix to Chapter 3
vanishing contribution. Now, using the result (A3.1.4) in the second term on the RHS of
(A3.1.11), the expression for the free energy of the critical nucleus reduces to the form
NC
=
4πr
3
c
3
T
− 2πλ
s
ψ
2
s
r
2
c
ψ
c
ψ
s
− 1
1 −r
−1
c
tanh r
c
tanh r
c
=
4πr
3
c
3
T
− 4πr
2
c
sp
1 −r
−1
c
tanh r
c
1 +¯ν tanh r
c
(
¯ν +r
−1
c
)
. (A3.1.12)
The last equality above is reached by using the relation (A3.1.7) for ψ
c
/ψ
s
.Usingthe
leading-order expansion of tanh r
c
≈ 1 −2exp(−2r
c
) for large r
c
, the second term on the
RHS can be further simplified to obtain
NC
=
4πr
3
c
3
T
− 4πr
2
c
¯ν
1 +¯ν
−r
−1
c
sp
. (A3.1.13)
A3.2 The excess free energy in the DFT model
The excess free energy per particle of the critical nucleus is then obtained from (3.3.1)
by evaluating for the optimum density distribution. The latter is determined from the
Euler–Lagrange equation, i.e., the density function characterized by the order-parameter
fields {η, A
i
}satisfying eqn. (3.3.30). Using this relation, the RHS of the expression (3.3.17)
for
u
reduces to
n
l
dx
&
1 + η +
i
A
i
e
iK
i
· x
'
⎡
⎣
c
0
η −βU
0
+
j
e
iK
j
· x
1
{c
i
A
j
− βU
j
}
⎤
⎦
− n
l
dx
&
η +
i
A
i
e
iK
i
· x
'
−
n
2
l
2
dx
dx
c(x, x
;γ)
×
&
η +
i
A
i
e
iK
i
· x
'
⎧
⎨
⎩
η +
j
A
j
e
iK
j
· x
⎫
⎬
⎭
. (A3.2.1)
The above expression easily reduces to the following convenient form for
u
as a func-
tional of the order-parameter functions {η, A
i
}:
u
n
l
k
B
T
=
dx
D
0
(x) −{1 +η(x)}U
0
−
i
A
i
(x)U
i
, (A3.2.2)
where D
0
is given by
D
0
= η(c
0
− 1) +
c
0
2
η
2
+
i
c
i
2
A
2
i
. (A3.2.3)
A3.2 The excess free energy in the DFT model 163
To further clarify this expression for the excess free energy of formation of the nucleus, we
rewrite the last two terms on the RHS of (3.3.22) as
n
l
2
i
c
i
dr
{
ˆ
K
i
· ∇A
i
(r)}
2
−
1
2
{
ˆ
K
i
· ∇A
i
(r)}
2
+
n
l
2
c
0
dr
|∇η(r)|
2
−
1
2
|∇η(r)|
2
. (A3.2.4)
On carrying out a partial integration of the first and third terms and using the fact that
the derivative of the order parameters vanishes at the boundaries of the integral, (A3.2.4)
reduces to
−
n
l
2
i
c
i
dr
A
i
(r){
ˆ
K
i
· ∇}
2
A
i
(r) +
1
2
{
ˆ
K
i
· ∇A
i
(r)}
2
−
n
l
2
c
0
dr
{1 + η(r)}∇
2
η(r) +
1
2
{∇η(r)}
2
= n
l
dr
{1 + η(r)}U
0
+
i
A
i
(r)U
i
− n
l
c
0
4
{∇η(r)}
2
+
c
i
4
{
ˆ
K
i
· ∇A
i
(r)}
2
, (A3.2.5)
wherewehaveused(3.3.25) for substituting U
i
in the first term. The third term on the
RHS of (3.3.22) can be treated in an exactly similar manner to a positive definite form. On
taking an angular average for {
ˆ
K
i
· ∇}
2
we obtain for the surface free energy the result
n
l
k
B
T
= 4π
∞
0
r
2
D
0
[η, A
i
]−
c
0
4
dη
dr
2
−
i
c
i
12
dA
i
dr
2
dr. (A3.2.6)
D
0
[η(r ), A
i
(r)] gives the local contribution in terms of the corresponding functional for
a uniform system characterized by {η, A
i
}. The last two terms on the RHS of (A3.2.6)
represent the nonlocal contribution due to the variation of the order-parameter field.
4
The supercooled liquid
In the previous chapters we have discussed the transition of the liquid from a disordered
fluid state to an ordered crystalline state through a first-order phase transition at the melt-
ing or freezing point T
m
. In the present chapter we consider the behavior of the liquid
supercooled below T
m
and the associated phenomenon of the liquid–glass transition.
4.1 The liquid–glass transition
Almost all liquids can, under suitable conditions, be supercooled below the freezing point
T
m
while avoiding crystallization. The undercooled liquid continues to remain in the dis-
ordered state and is characterized by very rapidly increasing viscosity with decreasing
temperature. The characteristic relaxation time τ of the liquid grows with increasing super-
cooling. Eventually, at low enough temperature, the supercooled liquid becomes so viscous
that it can hold shear stress and behaves like a solid. At this stage the supercooled liquid is
said to have transformed into a glass. The latter is an amorphous solid without long-range
order. It is in fact in a nonequilibrium state on the time scale of the experiment. The relax-
ation time τ required for the supercooled liquid to equilibrate is longer than the typical
time scale τ
exp
of an experiment. Apart from the viscosity, other dynamic quantities such
as the diffusion coefficient, dielectric response function, and conductivity change strongly
with increasing supercooling. In contrast, thermodynamic properties such as the specific
heat, enthalpy, compressibility, and static structure factor do not show any strong change
with supercooling. The specific heat drops as the liquid transforms into an amorphous solid
due to the freezing of the translational degrees of freedom. In the present chapter and the
rest of this book we will discuss theoretical methods for understanding the physics of the
formation of the amorphous solid state as one approaches it from the ergodic liquid side.
Complementary treatments of the physics of the glassy state have been carried out. These
refer to, for example, the models based on treating the glass as an elastic solid and termed
shear-tranformation-zone theory of amorphous plasticity (Falk and Langer, 1998, 2010).
Glasses have also been studied with models based on geometric approaches (Nelson, 2002)
treating the frustration or incompatibility of long-range tiling with locally preferred order
in the liquid. For a review of the geometric approaches to glassy behavior see Tarjus et al.
(2005).
164
4.1 The liquid–glass transition 165
4.1.1 Characteristic temperatures of the glassy state
There are several characteristic temperatures associated with the physics of supercooled
liquids and glassy behavior.
The calorimetric glass transition at T
g
At this temperature the relaxation time becomes of the order of the experimental timescale
τ
exp
. The calorimetric glass transition T
g
is fixed by setting τ
exp
= 10
2
–10
3
s. Using the
relation
τ
R
= ηG
∞
, (4.1.1)
where G
∞
is the high-frequency shear modulus, and taking the typical value G
∞
∼
10
10
–10
11
dynes/cm
2
the shear viscosity at the glass transition is obtained as
η(T
g
) ∼ 10
13
poise. (4.1.2)
Therefore the temperature at which the viscosity of the supercooled liquid reaches this
generic value of 10
13
P has been identified as the calorimetric glass-transition temperature
T
g
(Ediger et al., 1999). We refer to the out-of-equilibrium liquid below T
g
as a structural
glass.
The ease of glass formation and avoidance of crystallization in a particular glass-forming
material varies widely. From the above discussion on defining T
g
, it follows that different
choices of the experimental time scale or the cooling rates will correspond to different
values of T
g
. Therefore the accepted norm is to define T
g
in the limit of zero cooling rate.
Let us consider the cooling-rate dependence of the glass-transition point further. Indeed,
a too sensitive dependence of T
g
on the choice of the experimental time scale will make its
location rather arbitrary. However, since the growth of the relaxation time is exponential in
the vicinity of T
g
, the variation in the cooling rate does not affect T
g
in any drastic manner.
To demonstrate this, we note that for an experimental time scale of τ
exp
giving rise to the
glass-transition temperature T
g
we have (assuming an Arrhenius temperature dependence)
τ
exp
= τ
0
exp
E
A
k
B
T
g
, (4.1.3)
where E
A
is an activation energy. Differentiation of this relation gives
dT
g
T
g
=−
k
B
T
g
E
A
dτ
exp
τ
exp
. (4.1.4)
Since τ
exp
is large, a correspondingly large variation will be needed to make any apprecia-
ble shift in T
g
.
Diverging relaxation time at T
0
The relaxation time sharply increases in the supercooled liquid. Many different expressions
have been used to fit the experimentally observed temperature dependence of the viscosity

166 The supercooled liquid
of a supercooled liquid approaching T
g
. A number of different choices of fitting functions
and their relative merits have been listed by Angell et al. (1994). Besides the standard
Arrhenius form for the enhancement of the relaxation time (described above in eqn. (4.1.3))
the other most studied form of standard fitting function is the Vogel–Fulcher (Vogel, 1921;
Fulcher, 1925)form:
τ ∼ τ
0
exp
E
VF
T − T
0
, (4.1.5)
where where E
VF
is some characteristic energy scale of the material. For an alternative
formula see Mauro et al. (2009). The temperature T
0
, though purely phenomenological in
nature, is an important characteristic property of glass-forming liquids. It represents the
point at which the extrapolated relaxation time would diverge. It is lower than T
g
by defi-
nition since the glass transition intervenes before the relaxation time of the liquid diverges.
In the case of fragile systems T
0
is close T
g
, whereas for the strong glassy systems it is far
below T
g
and is close to absolute zero. The Vogel–Fulcher form has been used in fitting
of the data over a wide range, including well above T
g
. Note, however, that it is a very
nonlinear fit of the temperature dependence of the relaxation time. This is different from
similar fits for the thermodynamic properties like entropy. Hence extrapolation of the data
for predicting a divergence at T
0
is less reliable.
Power-law relaxation T
c
Over the initial range of growth of the relaxation time the power-law fit of the form
τ ∼ (T − T
c
)
−a
has often been used. a is a material-dependent exponent. The temper-
ature T
c
obtained in such power-law fits to relaxation times or diffusion coefficients has
almost exclusively, irrespective of the situation, been called the transition temperature of
the mode-coupling theory (MCT). The mode-coupling model for the slow dynamics will
be discussed in detail in the subsequent chapters of this book. In its simplest form the
model involves an ideal ergodic–nonergodic transition at a temperature T
c
(say) that lies
between the freezing point T
m
and the glass-transition temperature T
g
. This theory predicts
a power-law growth of the relaxation time around this so-called transition temperature.
The Kauzmann temperature T
K
From the definition of the glass-transition temperature T
g
it is clear that if the waiting
time required for the supercooled liquid to equilibrate in an experiment could be arbitrar-
ily increased then thermodynamic measurements below T
g
would be possible. Kauzmann
(1948) tested such a scenario by extrapolating various properties of the supercooled liquid
to temperatures below T
g
. The metastable nature of the supercooled liquid with respect to
the crystal was investigated by extrapolating various thermodynamic properties such as the
entropy, enthalpy, free energy, and specific volume to low temperatures. Let us consider
the change of entropy with temperature. The difference of entropies of the liquid state and
the crystalline state is defined as S(T ) and the quantity S(T )/S(T
m
) was plotted
4.1 The liquid–glass transition 167
against T/T
m
for low temperatures. Kauzmann observed that for some liquids the extrap-
olated entropy difference goes to zero at a finite temperature. This temperature, usually
denoted T
K
, represents a limiting point. For T < T
K
the entropy of the supercooled liquid
would be lower than that of the crystal. This is a paradoxical situation, since common
intuition implies that entropy grows with disorder, and is termed the Kauzmann paradox.
In this regard it is important to note that, unlike entropy, the free-energy difference between
the supercooled liquid and the crystalline state does not decrease on being extrapolated
to lower temperatures. This rules out the possibility that the temperature T
K
represents a
point at which the metastable supercooled liquid undergoes a continuous phase transition
into the crystalline state. The above issue regarding the behavior of the supercooled liquid
near T
K
cannot be settled by experiment. Equilibrating the liquid near T
K
is impossible,
since the glass transition intervenes at a higher temperature T
g
> T
K
. In his original paper
Kauzmann proposed the simplest resolution of this by asserting the existence of a spinodal
point at a temperature T
sp
> T
K
. Thus for T < T
sp
the liquid always equilibrates into the
crystalline state. We will discuss such a possibility in detail below. However, for cases in
which (at least for certain liquids) the spinodal does not exist, the possibility of a transition
to an ideal glassy state at some T ≥T
K
remains and constitutes a subject of much current
research interest.
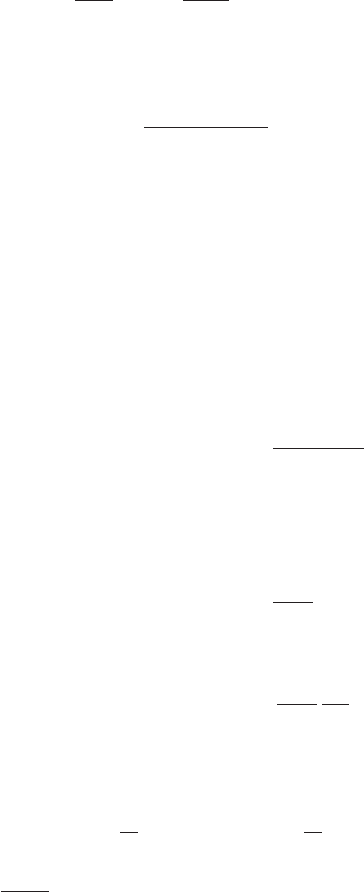
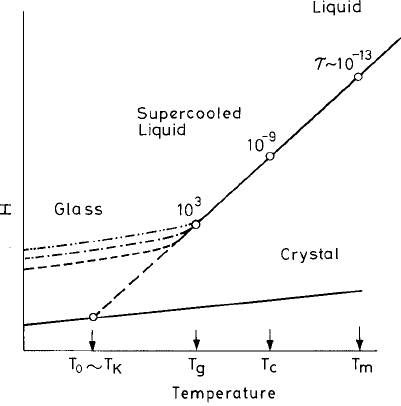
In Fig. 4.1 a schematic drawing of the change of a typical thermodynamic property such
as the enthalpy H or the volume V of the supercooled liquid with temperature is shown.
Fig. 4.1 A schematic drawing of the behavior of a typical thermodynamic property such as the
enthalpy H or the volume V of the supercooled liquid with temperature. The various characteristic
temperatures of the glass physics at different stages of supercooling are marked on the temperature
axis.
168 The supercooled liquid
The various characteristic temperatures of the glass physics are marked on the temperature
axis. The structural relaxation time τ
α
changes by a few orders of magnitudes at each stage
on the temperature axis, ranging over 16 orders of magnitudes from freezing point T
m
to the
calorimetric glass-transition point T
g
. Finally τ
α
approaches divergence at the extrapolated
temperature T
0
≈ T
K
, the Kauzmann temperature at which the configurational entropy
vanishes.
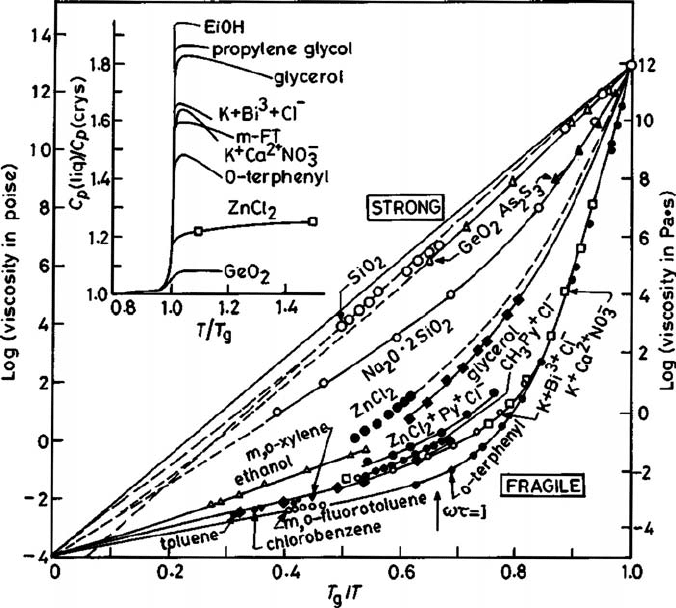
Strong and fragile liquids
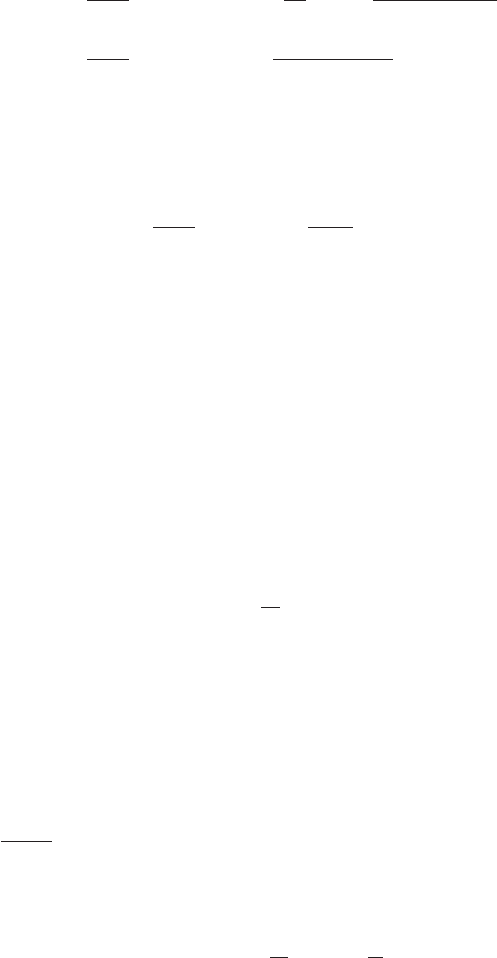
An instructive plot of the data of glassy relaxation was made by Angell (1984) of the relax-
ation time or equivalently the viscosity η vs. the inverse temperature T
g
/T scaled with T
g
(see Fig. 4.2). The increase of viscosity occurs in different ways in different materials. One
extreme is a slow growth of η with lowering of temperature T over the temperature range
T > T
g
followed by a very sharp increase within a small temperature range close to T
g
.
Fig. 4.2 Viscosity plots of various glass-forming liquids vs. T
g
/T . T
g
is defined as the temperature
at which the viscosity reaches 10
14
poise (10
14
P). The inset shows the drop in the specific heat at
T
g
.FromAngell (1984), reproduced by kind permission of the author.

4.1 The liquid–glass transition 169
In a number of systems termed fragile liquids a crossover in the temperature dependence
of viscosity η was observed. A more uniform increase is seen over the whole tempera-
ture range for strong liquids such as B
2
O
3
and SiO
2
. This behavior has been quantified by
defining a fragility parameter m as the slope of the viscosity–temperature curve (Böhmer
et al., 1993):
m =
d log
10
η
d(T
g
/T )
*
*
*
*
T =T
g
. (4.1.6)
Thus, for example, m = 81 (for o-terphenyl) and m = 20 (for SiO
2
), respectively, denote
two extreme cases of fragile and strong systems. While the strong liquids display the
phenomenon of the undercooled liquid uniformly becoming more and more viscous with
decreasing temperature, at the extreme fragile end the change of viscosity is extremely
dramatic, with it growing by many orders of magnitude within a very narrow temperature
range.
The phenomenon of the glass transition in supercooled liquids as described above is
based entirely on an experimental criterion, namely the point at which the supercooled liq-
uid falls out of equilibrium on an experimental time scale. Understanding the true nature of
the transformation will naturally require knowledge of in what ways the supercooled liquid
close to the glass transition is different from the glassy state below T
g
. At the macroscopic
level both the crystal and the glass are solid states, i.e., have elastic properties. In a crystal
the constituent particles are vibrating about their mean positions, which form a lattice with
long-range order. A simple picture of the glassy state will portray individual constituent
atoms vibrating around their mean positions on an amorphous or random lattice struc-
ture without any long-range order. Such a picture of the glass holds only over time scales
smaller than the structural-relaxation time. Similarly to the case in a crystal, ergodicity is
broken in the glass over this time scale. From a theoretical point of view the system is con-
fined to a single equilibrium state having a minimum energy in the phase space. Beyond T
g
the system can no longer explore the whole phase space and ergodicity is broken. Transla-
tional motion of the particles is practically absent and the system is confined to one local
minimum of the energy. At T
g
the specific heat c
p
at constant pressure drops, becoming
close to that of the crystal (see the inset of Fig. 4.2). This is simply understood from the
fact that in both cases, of the crystal and the glass, only vibrational motion of the parti-
cles around their mean positions is contributing. This view can be supported by invoking
the fact that quantities such as volume and energy remain almost constant. However, what
makes the two systems very different is that the crystal is a system in equilibrium, whereas
a glass is strongly out of equilibrium. A dynamic correlation function of two times, e.g., the
density–density correlation function, is a function of two times. The system is not invari-
ant under time translation, which is a typical feature of nonequilibrium systems. This is
termed aging. Over short time scales the system appears as if it were in equilibrium with
a characteristic amorphous structure, whereas over longer times nonequilibrium effects
show up.
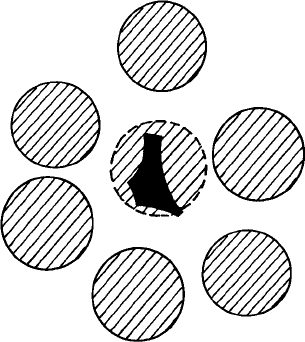
170 The supercooled liquid
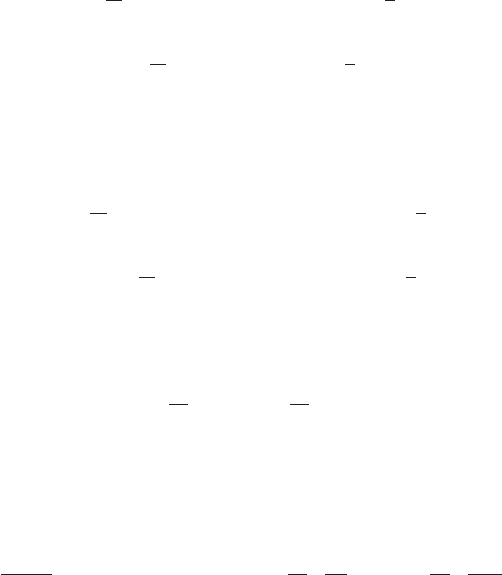
Fig. 4.3 A schematic two-dimensional picture of the free volume available for a particle in the fluid,
assuming the neighbors to be fixed. The dark area represents the free area available to the center of
the disk.
4.1.2 The free-volume model
The idea of free volume in a liquid is a useful concept in providing phenomenological
explanations of some of its observed behavior. In this approach, mass transport in the dense
liquid or the glassy state is understood in terms of the movement of free volume in the
system. The definition of free volume at high density, however, is not unique. As a typical
example, let us consider a fluid in which the volume per particle is v and let v
0
be the
volume per particle which is excluded from all other particles. This is shown schematically
for a single particle in Fig. 4.3. For example, in a low-density fluid of hard spheres of
diameter σ in which only binary collisions occur v
0
= 2πσ
3
/3 and the excess volume
(v −v
0
) per particle is not shared with any other particle. In a dense liquid or an amorphous
solid the excess volume remains largely fixed in the jammed state due to severe packing
constraints. If the solid is heated, then at the initial stage the excess volume increases
without any redistribution. Thermal expansion primarily increases the anharmonicity in
the vibrational motion of the fluid particles around corresponding fixed positions, similarly
to that which occurs in a crystal. A note of caution with this description, however, is that
(as has already been pointed out above) such a picture in the glassy state can at best hold
over certain time scales. As the fluid is heated, eventually a stage is reached in which a part
of the excess volume is available for redistribution and this allows mass movement in the
system with randomization of the particle motions. This part of the excess volume available
for redistribution without any energy cost is referred to as the free volume v
f
in the system,
v − v
0
= v
c
+ v
f
, (4.1.7)
where v
c
denotes the part which cannot be randomly distributed.