Cohen I.M., Kundu P.K. Fluid Mechanics
Подождите немного. Документ загружается.

772 Introduction to Biofluid Mechanics
Net Work Done by the Ventricle on Blood During One Cardiac Cycle
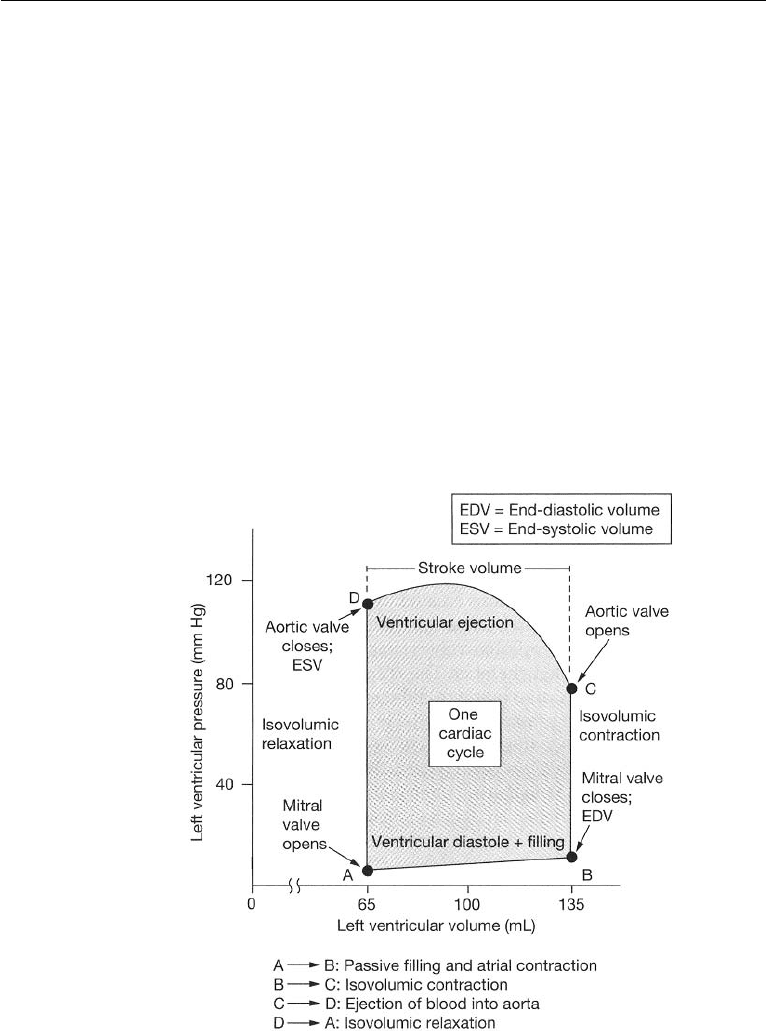
The work done by the ventricle on blood may be calculated from the area enclosed by
the pressure–volume curve for the ventricle. Consider, for example, the left ventricle
(LV). Fig. 17.6 shows the pressure–volume curve for the LV.
Blood pressure is measured in mm of Hg, and the volume in ml. At A, the ven-
tricular pressure and volume are at their lowest values. With the increase of atrial
pressure, the bicuspid valve will open and let blood flow into the ventricle. AB
represents diastolic ventricular filling. During AB work is being done by the blood in
the LV to increase the volume. At B, the ventricular volume is filled to its maximum
and this volume is called the end diastolic volume (EDV ). The ventricular muscles
begin to contract, pressure increases, and the bicuspid valve closes. BC is the constant
volume contraction of the ventricle. No work is done during BC but energy is stored
as elastic energy in the muscles. At C, ventricular pressure is greater than that in the
aorta, the aortic valve opens and blood is ejected into the aorta. Ventricular volume
decreases, but the ventricle continues to contract and the pressure increases. However,
at D, pressure in the aorta exceeds that of the ventricular pressure and the aortic valve
closes. During CD, work is done by the heart muscles on blood. The volume in the
Figure 17.6 Left ventricular pressure–volume curve. (Reproduced with permission from Silverthorn,
D.U. (2001) Human Physiology: An Integrated Approach, 2nd ed., Prentice Hall, Upper Saddle
River, NJ.).

2. The Circulatory System in the Human Body 773
LV at D is at its lowest value, and this is called the end systolic volume (ESV ). DA
is the constant volume pressure decrease in the ventricle due to muscle relaxation
and no work is done during this process. Ventricular pressure falls below that in the
aorta causing the aortic valve to close. ABCD constitutes one cardiac cycle, and the
area within the pressure-volume diagram represents the net work done by the LV on
blood. The energy required to perform this work is derived from the oxygen in the
blood. A similar development applies for the right ventricle.
Typically, work done by the heart is only about 10–15% of the total input energy,
and the remainder is dissipated as heat.
The volume of blood pumped by the LV into the systemic circulation in a cardiac
cycle is called the stroke volume (SV ), and it is expressed in ml/beat. The normal
stroke volume is 70 ml/beat.
SV = EDV − ESV (17.1)
A parameter that is related to stroke volume is ejection fraction (EF). EF is the fraction
of blood ejected by the LV during systole. At the start of systole, the LV is filled with
blood to the EDV. During systole, the LV contracts and ejects blood until it reaches
ESV. EF is given by
EF = (SV/EDV) × 100% (17.2)
Cardiac output (CO) is the volume of blood being pumped by the heart (in particular,
by a ventricle) in a minute. It is the time averaged flow rate. It is equal to the heart
rate multiplied by the stroke volume. Thus,
CO = SV × HR, (17.3)
where HR is the heart rate in beats/min. For a normal adult, the typical HR is between
70 and 75 beats per minute. With 70 beats per minute, and 70 ml blood ejection
with each beat of the heart, the CO is 4900 ml/m. This value is typical for a normal
adult at rest, although CO may reach up to 30 l/m during extreme activity (say,
exercise). Heart rate can vary by a factor of approximately 3, between 60 and 180
beats per minute, while the stroke volume can vary between 70 and 120 ml, a factor
of only 1.7. The cardiac index (CI) relates CO with the body surface area, BSA as
given by,
CI = CO/BSA = SV × HR/BSA, (17.4)
where, BSA is in square meters.
Nature of Blood
Composition of Blood
Blood is about 7% of the human body weight. Its density is approximately
1054 kg/m
3
. The pH of normal blood is in the range 7.35 < pH < 7.45. The nor-
mal adult has a blood volume of about 5 liters. At any given time, about 13% of

774 Introduction to Biofluid Mechanics
the total blood volume resides in the arteries and about 7% resides in the capillaries.
Blood is a complex circulating liquid tissue consisting of several types of formed
elements (corpuscles or cells) (about 45% by volume) suspended in a fluid medium
known as plasma (about 55% by volume; 2.7−3.0 liters in a normal human). The
plasma is a dilute electrolyte solution (almost 92% water) containing, about 8% by
weight, three major types of blood proteins—fibrinogen (5%), globulin (45%), and
albumin (50%) in water. Beta lipoprotein and lipalbumin are also present in trace
amounts. Plasma proteins are large molecules with high molecular weight and do
not pass through the capillary wall. The formed elements (cells) consist of red blood
cells (erythrocytes; about 45% of blood volume), white blood cells (leukocytes; about
1% of blood volume), and platelets (thrombocytes; <1% of blood volume). Thus, the
formed elements in blood consist of 95% red blood cells, 0.13% white blood cells, and
about 4.9% platelets. The specific gravity of red blood cells is about 1.06. The white
blood cells further consist of monocytes, lymphocytes, neutrophils, eosinophils, and
basophils.
In humans, mature red blood cells lack a nucleus and organelles. They are pro-
duced in the bone marrow, and the cell life span is about 125 days. The red blood cell is
biconcave in shape. It consists of a concentrated solution of hemoglobin, an oxygen
carrying protein, surrounded by a flexible membrane. The hemoglobin transports
oxygen from the lungs to capillaries in various tissues, and some carbon dioxide. The
cell is about 8.5µm in diameter with transverse dimensions of 2.5µm at the thickest
portion and about 1µm at the thinnest portion. However, its flexibility is such that it
can bend and pass through capillaries as small as 5µm in diameter. The surface area
of the cell is about 163(µm)
2
, and the intracellular fluid volume is about 87(µm)
3
.
There are approximately 5 × 10
6
red blood cells in each mm
3
of blood. The bicon-
cave shape of the cell provides it with a very large ratio of surface area to volume.
This enables efficient gas exchange in the capillaries. The percentage of blood vol-
ume made up by red blood cells is referred to as the hematocrit. Hematocrit ranges
from 42 to 45 in normal blood, and plays a major role in determining the rheological
properties of blood. White blood cells or leukocytes are cells of the immune system
which defend the body against both infectious disease and foreign materials. Sev-
eral different and diverse types of leukocytes exist and they are all produced in the
bone marrow. There are normally about 10
4
white blood cells in each mm
3
of blood.
Platelets or thrombocytes are cell fragments circulating in blood that are involved in
the cellular mechanisms of hemostasis leading to the formation of blood clots. They
are smaller in size than red or white blood cells. Low levels of platelets predisposes
to bleeding, while high levels increase the risk of thrombosis (coagulation of blood
in the heart or a blood vessel).
Viscosity of Blood
An important property of a flowing fluid is its viscosity. The viscosity of blood depends
on the viscosity of the plasma and its protein content, the hematocrit, the temperature,
the shear rate (also called the rate of shearing strain), and the narrowness of the vessel
in which it is flowing (for example, a narrow diameter capillary). The dependence

2. The Circulatory System in the Human Body 775
on the narrowness of the vessel diameter is called the Fahraeus-Lindqvist effect.
The dependence on the prevailing shear rate and the Fahraeus-Lindqvist effect, each
classify blood as a non-Newtonian fluid.
The presence of white cells and platelets do not significantly affect the viscosity
since they are in such small proportions. We will briefly discuss these various features
of blood viscosity.
The viscosity of plasma and blood are often given in terms of relative viscosity
as compared to that of water (viscosity of water is about 0.8 centipoise at room
temperature; 1 centipoise (1 cP) =0.01 Poise, conversion: 1 Poise = 1dyne s/cm
2
=
0.1Ns/m
2
). The viscosity of plasma depends on the protein composition of the
plasma and ranges between 1.1 and 1.6 centipoise. The viscosity of whole blood at a
physiological hematocrit of 45% is about 3.2 cP. Higher hematocrit results in higher
viscosity. At a hematocrit of 60%, the relative viscosity of blood is about 8. Viscosity
of blood increases with decreasing temperature, and the increase is approximately
2% for each
◦
C. The dependence of viscosity on flow rate in vessels is complicated.
As noted in earlier chapters, viscous flow rates in vessels are significantly influenced
by the shear stress, τ , and the associated rate of shearing strain (or shear rate), ˙γ .For
Newtonian fluids, τ is linearly related to ˙γ , and the slope of this characteristic is the
viscosity, µ. For whole blood, this relationship is complicated due to the following
reasons. In a blood volume at rest, above a minimum hematocrit of about 5−8%,
blood cells form a continuous structure. A finite stress (called the yield stress), τ
y
,
is required to break this continuous structure into a suspension of aggregates in the
plasma. This yield stress depends also on the concentration of plasma proteins, in
particular, fibrinogen. An empirical correlation for the yield stress is given by the
expression:
√
τ
y
= (H − 0.1)(C
F
+ 0.5), (17.5)
where H is the hematocrit expressed as a fraction and it is >0.1, and C
F
is the fib-
rinogen content in grams per 100 ml and 0.21 <C
F
< 0.46. For 45% hematocrit
blood, the yield stress is in the range 0.01 <τ
y
< 0.06 dynes/cm
2
, (conversion:
1 dyne/cm
2
= 0.1N/m
2
). Beyond the yield, when sheared in the bulk, up to about
˙γ<50 sec
−1
, the aggregates in blood break into smaller units called rouleaux for-
mations. For shear rates up to about 200 sec
−1
, the rouleaux progressively break into
individual cells. Beyond this, no further reduction in structure is noted to occur with
an increase in the shearing rate.
For whole blood, at low shear rates, ˙γ<200 sec
−1
, the variation of τ with ˙γ is
noted to be nonlinear. This behavior at low ˙γ is non-Newtonian. Low ˙γ values are
associated with flows in small arteries and capillaries (microcirculation). At higher
shear rates, ˙γ>200 sec
−1
, the relationship between τ and ˙γ is linear, and the viscosity
approaches an asymptotic value of about 3.5 cP. Blood flows in large arteries have
such high shear rates, and the viscosity in such cases may be assumed as constant and
equal to 3.5 cP. Since whole blood behaves like a non-Newtonian yield stress fluid,
the slope of the shear stress—rate of strain characteristic at any given point on the
curve is defined as the apparent viscosity of blood at that point, µ
app
. Clearly, µ
app
is not a constant but depends on the prevailing ˙γ at that point. (See Fig. 17.7.) There
776 Introduction to Biofluid Mechanics
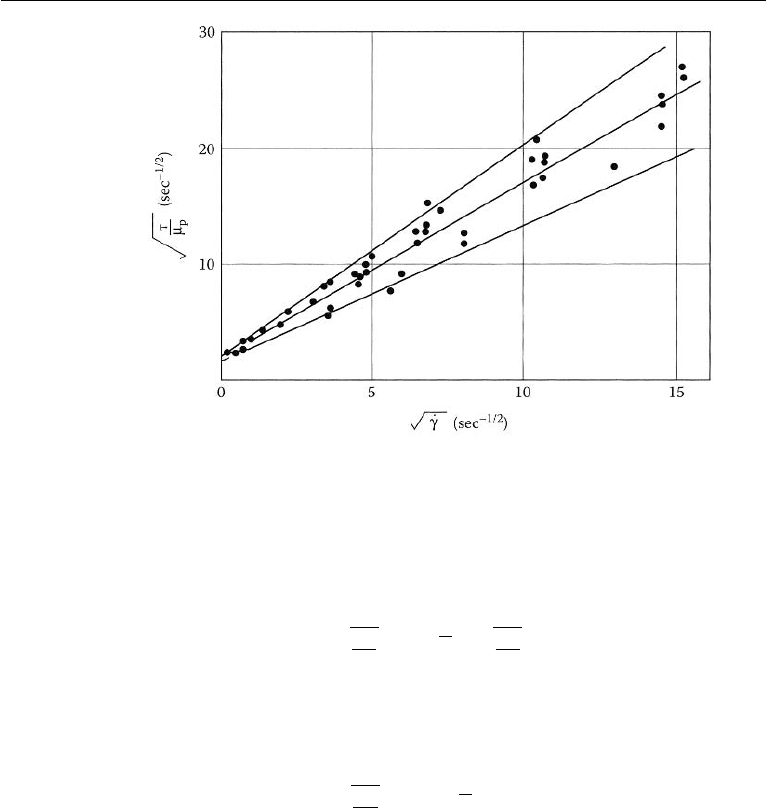
Figure 17.7 Shear stress vs. Shear rate for blood flow. (Reproduced with permission from
Whitmore, R. L. (1968) Rheology of Circulation, Pergamon Press, New York).
are a number of constitutive equations available in the literature that attempt to model
the relationship between shear stress and shear rate of flowing blood. A commonly
used one is called the Casson model and it is expressed as follows:
τ
µ
p
= k
c
˙γ +
τ
y
µ
p
, (17.6)
where µ
p
is plasma viscosity and k
c
is the Casson viscosity coefficient (a
dimensionless number). An expression based on a least square fit of the experimental
data and expressed in Casson form is that of Whitmore (1968),
τ
µ
p
= 1.53
˙γ + 2.0. (17.7)
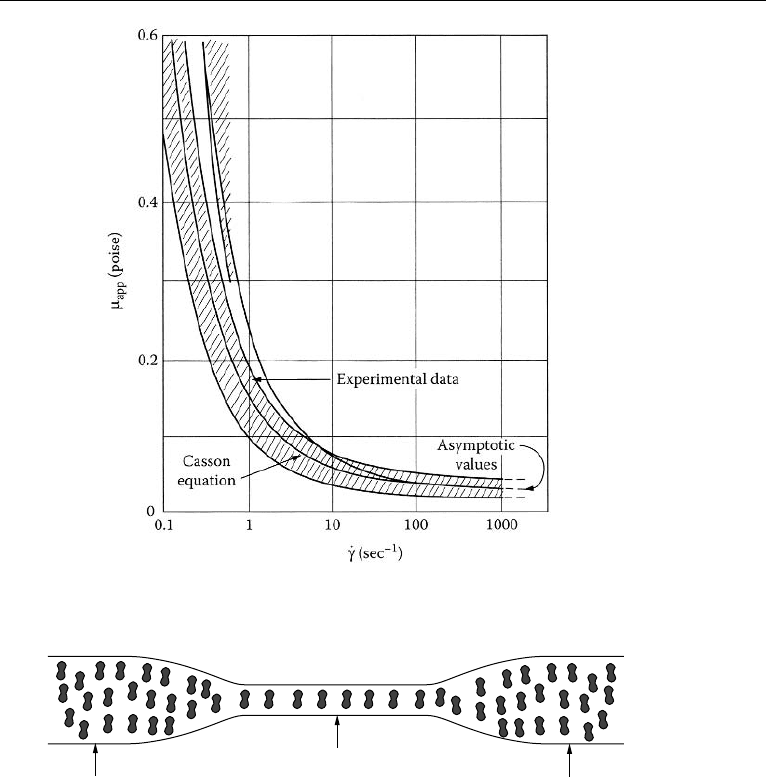
This expression is plotted in Fig. 17.8. Apparent viscosity significantly increases at
low rates of shear. It must be noted that although the Casson model is suitable at low
shear rates, it still assumes that blood can be modelled as a homogeneous fluid.
In blood vessels of less than about 500 µm in diameter, the inhomogeneous
nature of blood starts to have an effect on the apparent viscosity. This feature will be
discussed next.
Fahraeus-Lindqvist Effect
When blood flows through narrow tubes of decreasing radii, approximately in
the range (15 µm <d<500 µm), the apparent viscosity, µ
app
, decreases with
2. The Circulatory System in the Human Body 777
Figure 17.8 A least square fit of apparent viscosity as a function of shear rate in Casson form. (Reproduced
with permission from Whitmore, R. L. (1968) Rheology of Circulation, Pergamon Press, New York).
H
T
< H
F
,
H
D
H
F
H
T
H
D
Figure 17.9 The Fahraeus effect.
decreasing radius of the vessel. This is a second non-Newtonian characteristic of
blood and is called the Fahraeus-Lindqvist (FL) effect. The reduced viscosity in
narrow tubes is beneficial to the pumping action of the heart.
The basis for the FL effect is the Fahraeus effect.
When blood of constant hematocrit (feed hematocrit or bulk hematocrit, H
F
)
flows from a large vessel into a small vessel (vessel sizes in the ranges cited above),
the hematocrit in the small vessel (dynamic or tube hematocrit, H
T
) decreases as the
tube diameter decreases. (See Fig. 17.9.) This phenomenon is called Fahraeus effect
and must not be confused with a diminution of particle concentration in the smaller

778 Introduction to Biofluid Mechanics
vessel because of an entrance effect whereby particle entry into the smaller vessel
is hindered (see, Goldsmith et al. (1989) for detailed discussions). To separate this
possible “screening effect” and confirm the Fahraeus effect, H
T
may be compared
with the hematocrit in the blood flowing out (discharge hematocrit, H
D
) from the
smaller tube into a discharge vessel of comparable size to the feed vessel. In the
steady state, H
F
= H
D
. In vivo and in vitro experiments show that, H
T
<H
D
in tubes up to about 15 µm in diameter. The H
T
/H
D
ratio decreases from about
1 to about 0.46 as the capillary diameter decreases from about 600 µm to about
15 µm. While the discharge hematocrit value may be 45%, the corresponding
dynamic hematocrit in a narrow sized vessel such as an arteriole may just be
20%. As a consequence, the apparent viscosity decreases in the diameter range
15 µm <d<500 µm. However, for tubes less than about 15 µm in diameter, the
ratio H
T
/H
D
starts to increase.
Why does the hematocrit decrease in small blood vessels? The reason for this
effect is not fully understood at this time. In blood vessel flow, there seems to be
a tendency for the red cells to move toward the axis of the tube, leaving a layer of
plasma, whose width, usually designated by δ, increases with increase in the shear
rate. This tendency to move away from the wall is not observed with rigid particles;
thus, the deformability of the red cell appears to be the reason for lateral migration.
Deformable particles are noted to experience a net radial hydrodynamic force even at
low Reynolds numbers and tend to migrate towards the tube axis. (see, Fung (1993)
for detailed discussions). Chandran et al. (2007) state that as the blood flows through a
tube, the blood cells (with their deformable biconcave shape) rotate (spin)in the shear
field. Due to this spinning, they tend to move away from the wall and toward the
center of the tube. The cell free plasma layer reduces the tube hematocrit. As the size
of the vessel gets smaller, the fraction of the volume occupied by the cell-free layer
increases, and the tube hematocrit is further lowered. A numerical validation of this
reasoning is available in a recent paper by Liu and Liu (2006). There is yet another
reason. Blood vessels have many smaller sized branches. If a branching daughter
vessel is so located that it draws blood from the larger parent vessel mainly from the
cell free layer, the hematocrit in the branch will end up being lower. This is called
plasma skimming. In all these circumstances, the tube hematocrit is lowered. The
viscosity of blood at the core may be higher due to a higher core hematocrit, H
c
,
there, but the overall apparent viscosity in the tube flow is lower.
As the tube diameter becomes less than about 6 µm, the apparent viscosity
increases dramatically. The erythrocyte is about 8 µm in diameter and can enter
tubes somewhat smaller in size, and a tube of about 2.7 microns is about the smallest
size that an RBC can enter, Fournier (2007), Fung (1993). When the tube diameter
becomes very small, the pressure drop associated with the flow increases greatly and
there is increase in apparent viscosity.
If we consider laminar blood flow in straight, horizontal, circular, feed and capil-
lary tubes, a number of straightforward relationships between Q
F
, Q
c
, Q
p
, H
F
, H
T
,
H
c
, δ, and a may be established based on the law of conservation of blood cells. Here,
Q denotes flow rate, subscripts c and p denote core and plasma regions, respectively,
and a is the radius of the capillary tube. Thus,

2. The Circulatory System in the Human Body 779
Q
F
H
F
= Q
c
H
c
,Q
c
+ Q
p
= Q
F
, and,H
T
a
2
= H
c
(
a − δ
)
2
, (17.8)
where a is the radius of the capillary tube. Equation (17.8) will be useful in modelling
the FL phenomenon. A simple mathematical model for the FL effect is included in a
subsequent section.
Nature of the Blood Vessels
All blood vessels other than capillaries are usually composed of three layers: the
tunica intima, tunica media, and tunica adventitia. The tunica intima consists of a
layer of endothelial cells lining the lumen of the vessel (the hollow internal cavity in
which the blood flows), as well as a subendothelial layer made up of mostly loose
connective tissue. The endothelial cells are in direct contact with the blood flow. An
internal elastic lamina often separates the tunica intima from the tunica media. The
tunica media is composed chiefly of circumferentially arranged smooth muscle cells.
Again, an external elastic lamina often separates the tunica media from the tunica
adventitia. The tunica adventitia is primarily composed of loose connective tissue
made up of fibroblasts and associated collagen fibers. In the largest arteries, such
as the aorta, the amount of elastic tissue is very considerable. Veins have the same
three layers as arteries, but boundaries are indistinct, walls are thinner, and elastic
components are not as well developed.
Blood flows under high pressure in the aorta (about 120 mmHg systolic,
80 mmHg diastolic, pressure pulse of 40 mm Hg at the root) and the major arteries.
These vessels have strong walls. The aorta is an elastic artery, about 25 mm in
diameter with a wall thickness of about 2 mm, and is quite distensible. During
left ventricular systole (about 1/3 of the cardiac cycle), the aorta expands. This
stretching gives the potential energy that will help maintain blood pressure during
diastole. During the diastole (about 2/3 of the cardiac cycle), the pressure pulse
decays exponentially and the aorta contracts passively. Medium arteries are about
4 mm in diameter with a wall thickness of about 1 mm. Arterioles are about 50 µm
in diameter and have thin muscular walls (usually only one to two layers of smooth
muscle) of about 20 µm thickness. Their vascular tone is controlled by regula-
tory mechanisms, and they constrict or relax as needed to maintain blood pressure.
Arterioles are the primary site of vascular resistance and blood flow distribution to
various regions is controlled by changes in resistance offered by various arterioles.
True capillaries average from 9 to 12 µm in diameter, just large enough to per-
mit passage of cellular components of blood. The thin wall consists of extremely
attenuated endothelial cells. In cross section, the lumen of small capillaries may
be encircled by a single endothelial cell, while larger capillaries may be made
up of portions of 2 or 3 cells. No smooth muscle is present. Venules are about
20 µm in diameter and allow deoxygenated blood to return from the capillary beds
to the larger veins. They have three layers. An inner endothelium layer which acts a
membrane, a middle layer of muscle and elastic tissue, and an outer layer of fibrous
connective tissue. The middle layer is poorly developed. The walls of venules are
about 2 µm in thickness, and thus are very much thinner than those of arterioles.
Veins are thin walled, distensible, and collapsible tubes. Some of them may be

780 Introduction to Biofluid Mechanics
collapsed in normal function. They transport blood at a lower pressure than the
arteries. They are about 5 mm in diameter and the wall thickness is about 500 µm.
They are surrounded by helical bands of smooth muscles which help maintain blood
flow to the right atrium. Most veins have one-way flaps called venous valves. These
valves prevent gravity from causing blood to flow back and collect in the lower
extremities. Veins more distal to the heart have more valves. Pulmonary veins and
the smallest venules have no valves. Veins also have a thick collagen outer layer,
which helps maintain blood pressure. In the venous system, a large increase in the
blood volume results in a relatively small increase in pressure compared to the
arterial system (see, Chandran et al. (2007)). The veins act as the main reservoir
for blood in the circulatory system and the total capacity of the veins is more than
sufficient to hold the entire blood volume of the body. This capacity is reduced
through the constriction of smooth muscles, minimizing the cross-sectional area
(and hence volume) of the individual veins and therefore the total venous system.
The superior vena cava is a large, yet short vein that carries de-oxygenated blood
from the upper half of the body to the heart’s right atrium. The inferior vena cava is
the large vein that carries de-oxygenated blood from the lower half of the body into
the heart. The vena cava is about 30 mm in diameter with a wall thickness of about
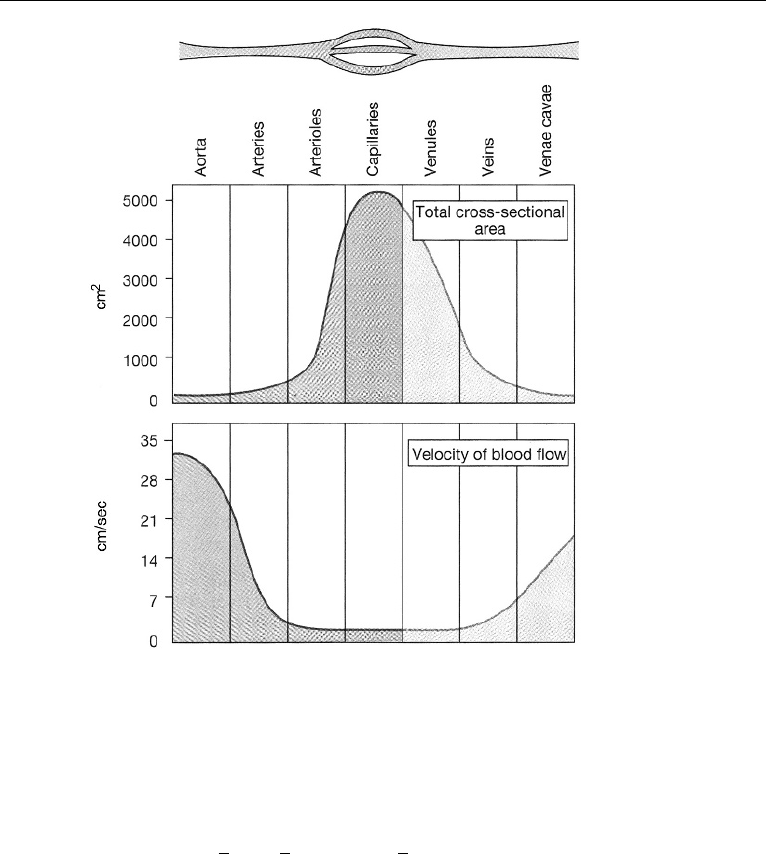
1.5 mm. The venae cavae have no valves. Fig. 17.10 shows the cross-sectional areas
of different parts of the systemic circulation with velocity of blood flow in each
part. The fastest flow is in the arterial system. The slowest flow is in the capillaries
and venules.
Total Peripheral Resistance Concept
As stated earlier, arterioles are the primary site of vascular resistance, and blood
flow distribution to various regions is controlled by changes in resistance offered by
various arterioles. To quantify the resistance of the arterioles in an averaged sense,
the concept of total peripheral resistance is introduced. Total peripheral resistance
essentially refers to the cumulative resistance of the thousands of arterioles involved
in the systemic or pulmonary circulation, respectively. For systemic circulation, with
time averaging of quantities over a cardiac cycle,
Total Peripheral Resistance = R =
¯p
Q
, (17.9)
where R denotes resistance, ¯p is the difference between the time averaged pressure
at the aortic valve and the time averaged venous pressure at the right atrium, and
Q is the time averaged flow rate (cardiac output). The units of peripheral resistance
would therefore be in mmHg per cm
3
/s. This unit of measuring resistance is called
the Peripheral Resistance Unit (PRU). Letting ¯p
A
and ¯p
V
to denote the time averaged
pressures at the aortic valve and at the right atrium, respectively,
p =¯p
A
−¯p
V
, (17.10)
2. The Circulatory System in the Human Body 781
Figure 17.10 Vessel diameter, total cross-sectional area, and velocity of flow. (Reproduced with permis-
sion from Silverthorn, D. U. (2001) Human Physiology: An Integrated Approach, 2nd ed., Prentice Hall,
Upper Saddle River, NJ.).
and, with ¯p
V
= 0, ¯p =¯p
A
, the time averaged arterial pressure. Then, ¯p
A
= QR.
The average pressure, ¯p
A
, may be estimated as:
¯p
A
=
1
3
p
S
+
2
3
p
D
= p
D
+
1
3
(p
S
− p
D
), (17.11)
where, p
S
is the systolic pressure, p
D
is the diastolic pressure, and (p
S
− p
D
)
is the pressure pulse (see, Kleinstreuer (2006)). For a normal person at rest, with
¯p
A
= 100 mmHg, Q = 86.6cm
3
/s, R = 1.2 PRU . An expression similar to that in
equation (17.9) would apply for pulmonary circulation and would involve the differ-
ence between time averaged pressures at the pulmonary artery and at the left atrium,
and the flow rate in pulmonary circulation (same as that in systemic circulation). Since
the difference between time averaged pressures in pulmonary circulation is about an
order of magnitude smaller than in the systemic circulation, the corresponding PRU
would be an order of magnitude smaller.